Andrew (Content Generated by AI)
General educational commentary only, generated automatically with AI. Not investment advice or a recommendation to buy, sell or hold any security. Capital is at risk.
Treasury Yields Pull Back after Fed Comments
The main story in the source material is a tug-of-war. Easing rate-hike expectations are on one side. Persistent inflation and bond-market pressure are on the other. CNBC reported that pressure on U.S. Treasurys eased after the 30-year yield hit its highest level since 2002. The Wall Street Journal reported that stock futures rose as oil prices and rate-hike bets eased. According to the brief, Treasury yields pulled back after Fed comments cooled bets on near-term hikes. This relief follows a bruising quarter for bonds. The brief states that yields recently reached multiyear highs. One reading is that the bond market remains the key variable for equity direction.
Mortgage Rates Rise for a Sixth Straight Week
Higher borrowing costs are already weighing on rate-sensitive areas. CNBC reported that U.S. mortgage rates climbed for a sixth straight week. The average 30-year conforming rate was 7.30%, and a separate survey put the latest rate at 7.58%. Refinancing and homebuyer demand fell. The Wall Street Journal reported that French inflation came in hotter than expected as energy prices rose. This keeps the possibility of another ECB rate increase in view. The brief notes that China's September activity measures improved. CNBC reported that U.S. holiday sales are forecast to exceed $1 trillion. Inflation contributes to that growth, and shoppers are expected to be more price-conscious.
Oil and Geopolitics Keep Energy Costs in Focus
Oil remains a swing factor. CNBC reported that oil prices climbed after President Trump denied offering Iran sanctions relief. Qatar pushed for peace talks. Negotiations over the Strait of Hormuz continue. The brief states that oil gained as uncertainty over U.S.-Iran relations kept energy-price risks in focus. The next test is whether inflation and energy costs keep yields elevated. The other question is whether softer rate expectations can support stocks without weakening market breadth. The brief also notes two policy items. The U.S. SEC proposed broadening retail access to private assets. This could open a new investment channel but bring greater risk. President Trump favors industry self-regulation on AI. Safety concerns, data-center power costs and scrutiny of infrastructure deals remain potential headwinds for the sector.
Online Sentiment Leans Cautious into Key Data
Online sentiment comes from unverified posts by anonymous retail users. These posts may include rumour or speculation and have not been checked. At the theme level, the mood shifted toward anxious caution. A fear/greed reading near 45/100 was cited, down from about 54 previously. Some anonymous posts described high cash levels or broad selling intentions. Others described staying fully invested in speculative positions. Both extremes were well represented, with few in the middle. The most discussed theme was a semiconductor memory earnings event. Bulls and bears argued about cycle risk and demand durability. Some posts worried that one-sided bullishness was itself a warning. Others argued the opposite. None of this is confirmed positioning. It is unverified commentary. One interpretation is that sentiment is split, not unified.
Index Divergence and Quarter-End Rebalancing
The three major indexes diverged on Tuesday. SPY closed at 764.38, down 0.15%. QQQ closed at 737.96, up 0.19%. IWM fell 0.34%. The brief notes that large-cap technology held up better than small caps. Anonymous posts complained that only a few stocks were holding up the market. This matches the divergence data. Month-end and quarter-end rebalancing is also in view. The source cites a Goldman estimate that U.S. pension funds will sell roughly $33 billion in equities around month-end. That figure sits at the 98th percentile since 2000. Potential CTA buying was estimated between $11.5 billion and $29.9 billion. These are estimates from the source, not confirmed flows.
Chart Screen Shows One Index with More Weakness
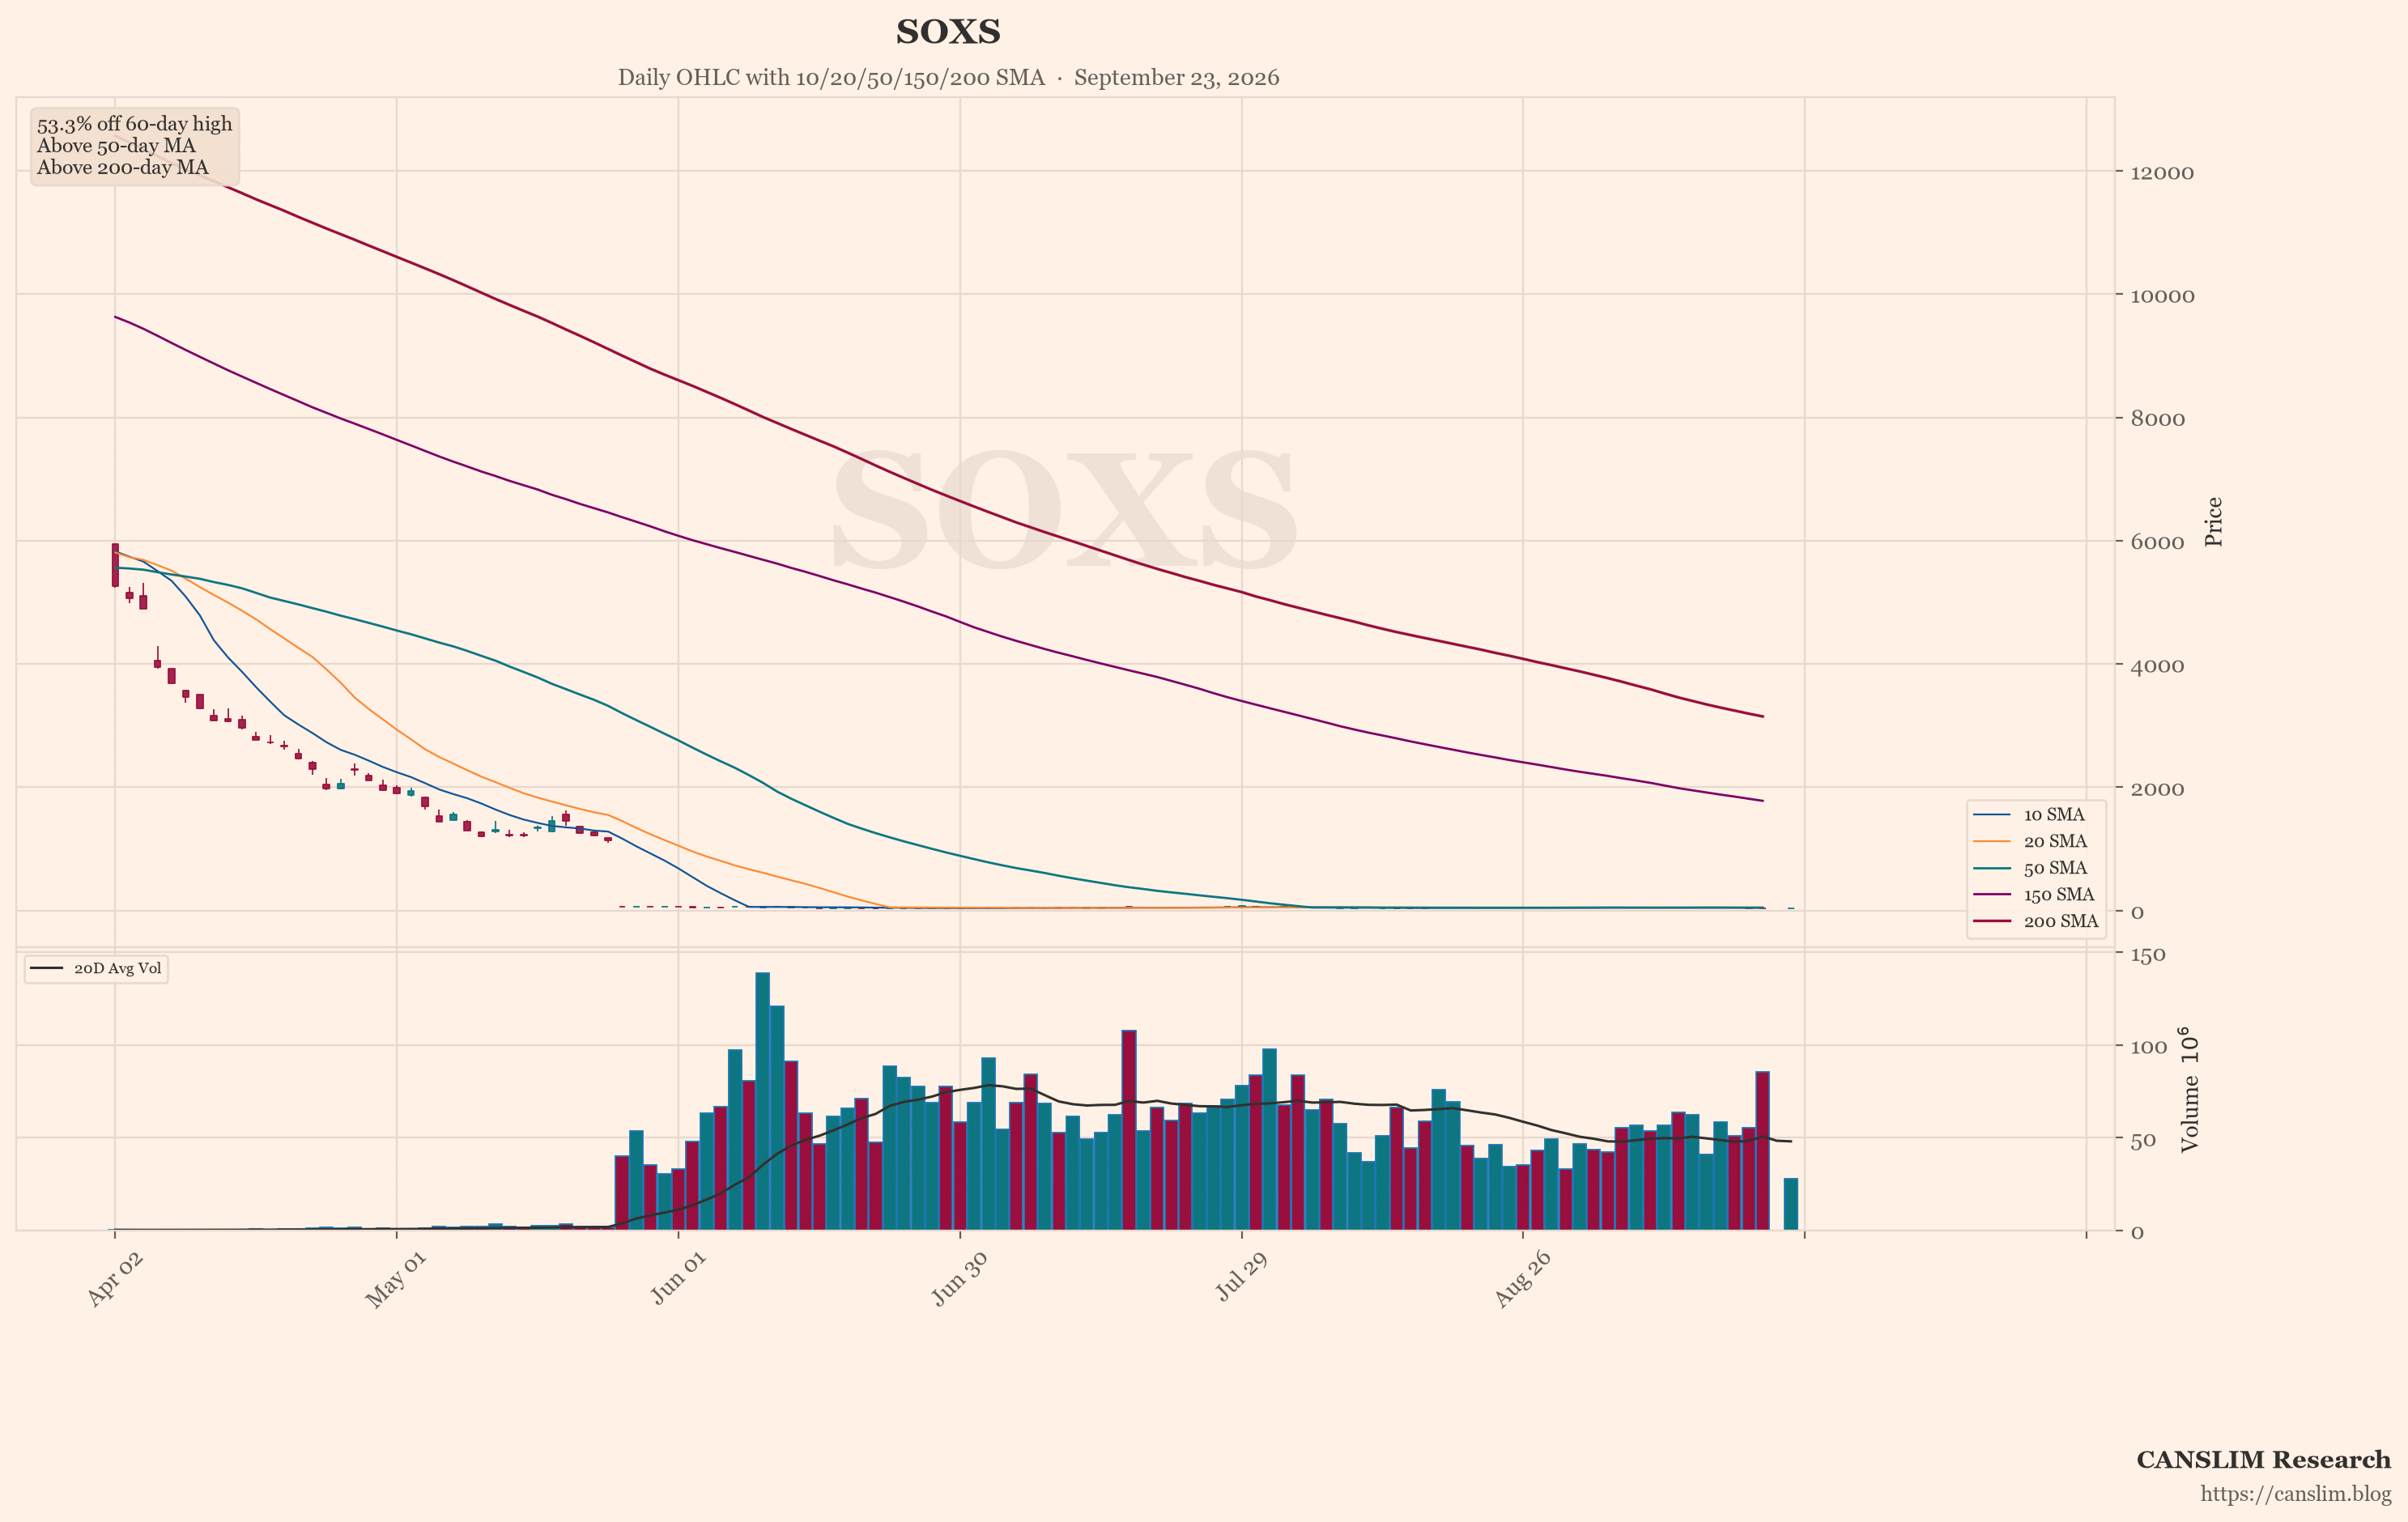
The featured chart shows the Dow Jones (^DJI). An automated technical screen picked it. Among the indices and stocks it checked, it showed the most weakness on a few measures. These include distance from its recent high, position versus its 50-day and 200-day moving averages, and down days on higher volume. This is a factual description of what the screen measured. One screen is not a full view. Past price patterns do not predict future results. The reading is not a signal about direction.
Conditions Remain Split between Relief and Pressure
Conditions in the source material are mixed. Yields eased, which gave stocks short-term relief. Mortgage rates rose for a sixth week. Oil prices climbed on geopolitical uncertainty. Inflation data and bond-market direction remain unresolved. Online sentiment, which is unverified, leaned cautious and divided. Breadth was narrow, with large caps outperforming small caps. Quarter-end rebalancing may add volatility. Risks include renewed yield pressure, energy-driven inflation, and weaker rate-sensitive demand. The path depends on data that had not yet arrived when the source was written.
Sources: a third-party AI-generated market news summary, and an AI summary of unverified posts by anonymous retail users online. This article was written by an AI language model from those summaries and published automatically without human review. Updated 2026-09-30 22:00 HKT.
CANSLIM Research (canslim.blog) is an independent educational publisher. It is not licensed or registered as a broker, investment adviser, research analyst or asset manager in any jurisdiction. This article is general information for education only. It is not investment advice, a research report, an investment recommendation, or an offer or solicitation to buy or sell any security, and it does not consider any reader's objectives, financial situation or needs. No ticker, chart, heading or technical comment is a suggestion to buy, sell, hold or short. Figures come from third-party sources, are not independently verified, and may be incomplete, out of date or wrong. Online sentiment may include rumour, speculation or coordinated posting. Past performance and past price patterns do not predict future results. Investing involves risk, including the loss of capital. This article is not updated after publication. Laws differ by country; seek advice from a licensed professional in your jurisdiction before making any investment decision.
Discover more from CANSLIM Research
Subscribe to get the latest posts sent to your email.