 Andrew@CANSLIM RESEARCH
Crude Jitters Meet a Market That Won’t Blink
Oil is the loudest story right now. U.S.-Iran talks, a possible Saudi pipeline restart, and talk of a diesel export ban have crude swinging hard. Trump said the U.S. would either make a deal with Iran or "annihilate" it. Then he called a three-hour meeting "very good." Iran’s military answered with threats. A cargo ship burned in the Strait of Hormuz after an "unknown projectile" hit it. Two people were hurt. USO fell 2.77% Tuesday, then rose 1.35% before the open. Traders now price a longer stretch of energy stress, not just a winter squeeze. That feeds inflation. It also pressures transport and industrial margins.
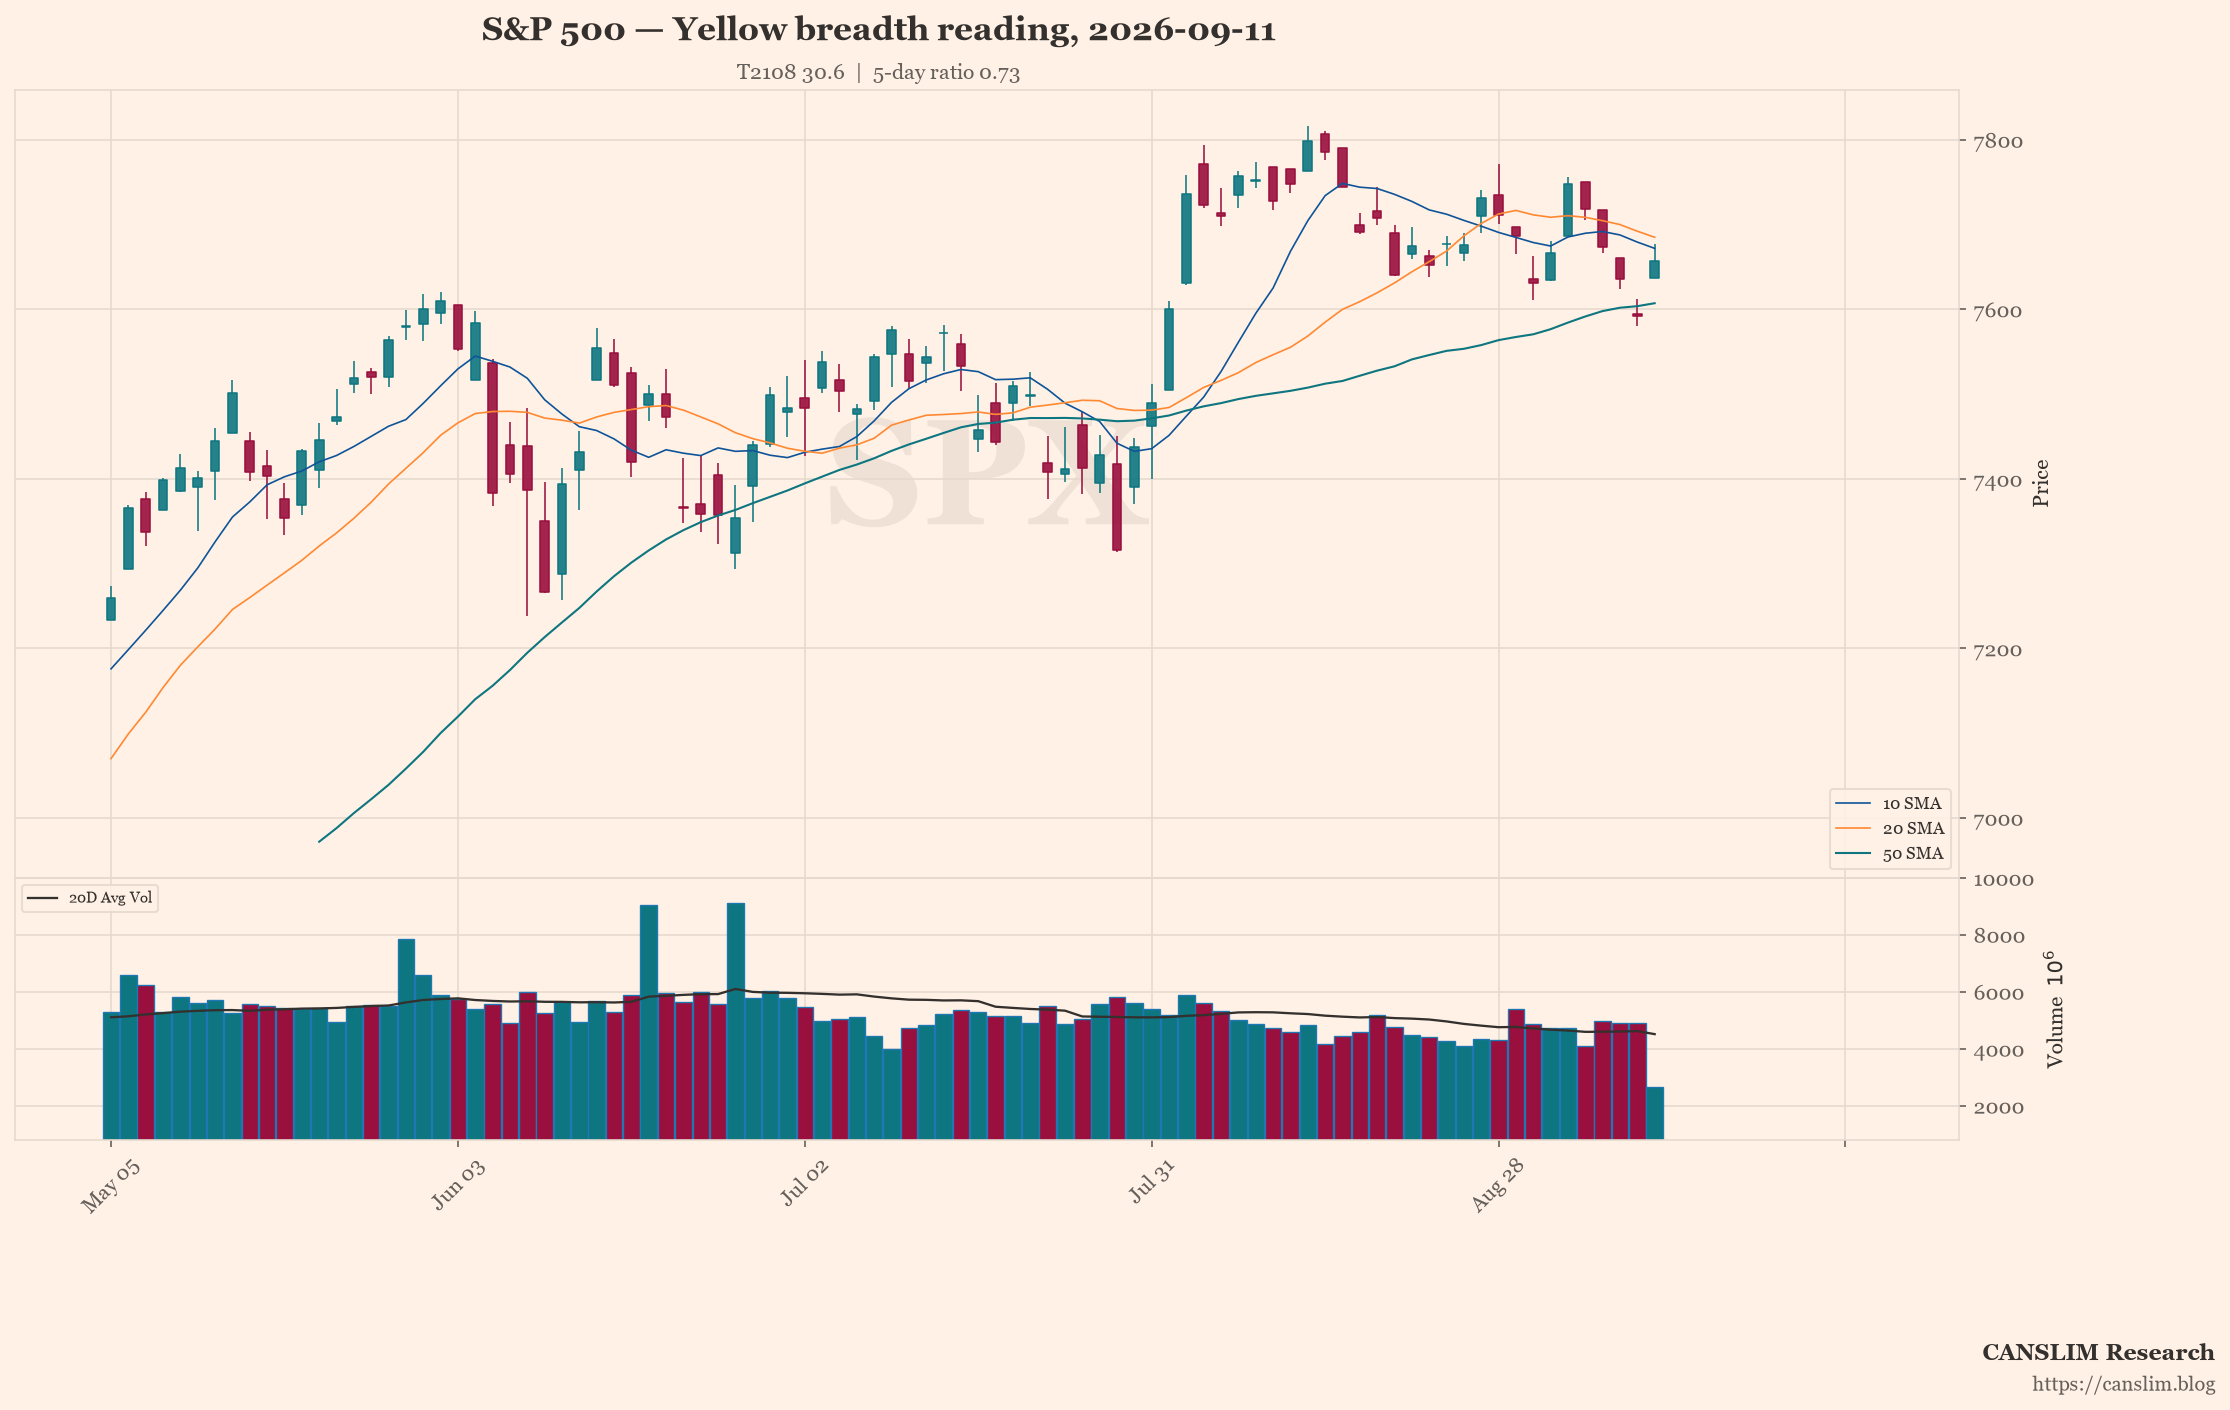
The Index Hides a Broken Foundation
The S&P 500 can sit near highs while most stocks lag. That is exactly what is happening. One widely shared stat says 60% of S&P 500 names sit below their 100-day moving averages. That is the worst breadth since March. QQQ hit a new high Tuesday while DIA fell. META ran to 757.14 intraday, then closed at 736.60, down 0.63%. GOOGL reversed too. DELL dropped 4.56%. A few AI and chip names plus Apple carry the tape. The online crowd noticed. Bears celebrated a tiny red premarket print. Bulls called it a bear trap. The fear/greed gauge slipped to about 62 from 72. Call buying and "SPY 800" chants still dominate.
Memory Chips and the 1100 Wall
MU is the crowd’s favorite battleground. It closed Tuesday at 1095.47, up 4.98%, with a high of 1097.17. That is three straight days of failing to touch 1100. Premarket it traded at 1091.69, down 0.35%. Posts screaming "MU 1200 by Friday" keep flooding in. Options data shows the biggest put open interest at 1040 and Friday’s largest position at 1100. That hints at a short-term pin. A rumor says Citi raised its target to 1300. Searches only find Citi cutting to 1150 in August. Treat it as chatter. Skeptics are growing. Some say memory CEOs always promise strong demand at the cycle peak. Others say Chinese capacity will ease shortages. Bulls answer that everyone expects a drop, so it is already priced in. SNDK rose 6.82% Tuesday.
Rates Are Quietly Tightening the Screws
The dollar hit an 8-week high as Fed hike bets rose. Officials still sound worried about inflation. Mortgage rates pushed above 7%. Nearly 10% of borrowers chose riskier adjustable-rate loans last week. That is housing stress, not relief. Financial stocks are falling as rates rise. Higher funding costs and slower loan growth hurt banks. That is a warning for the whole market. The 10-year yield near 5% made the online crowd nervous. Not the index level. The yield. Watch the Trump-Xi summit for AI rules. Watch Iran and Gulf supply. Watch diesel prices. Watch whether rates start to bite banks, housing, and small caps.
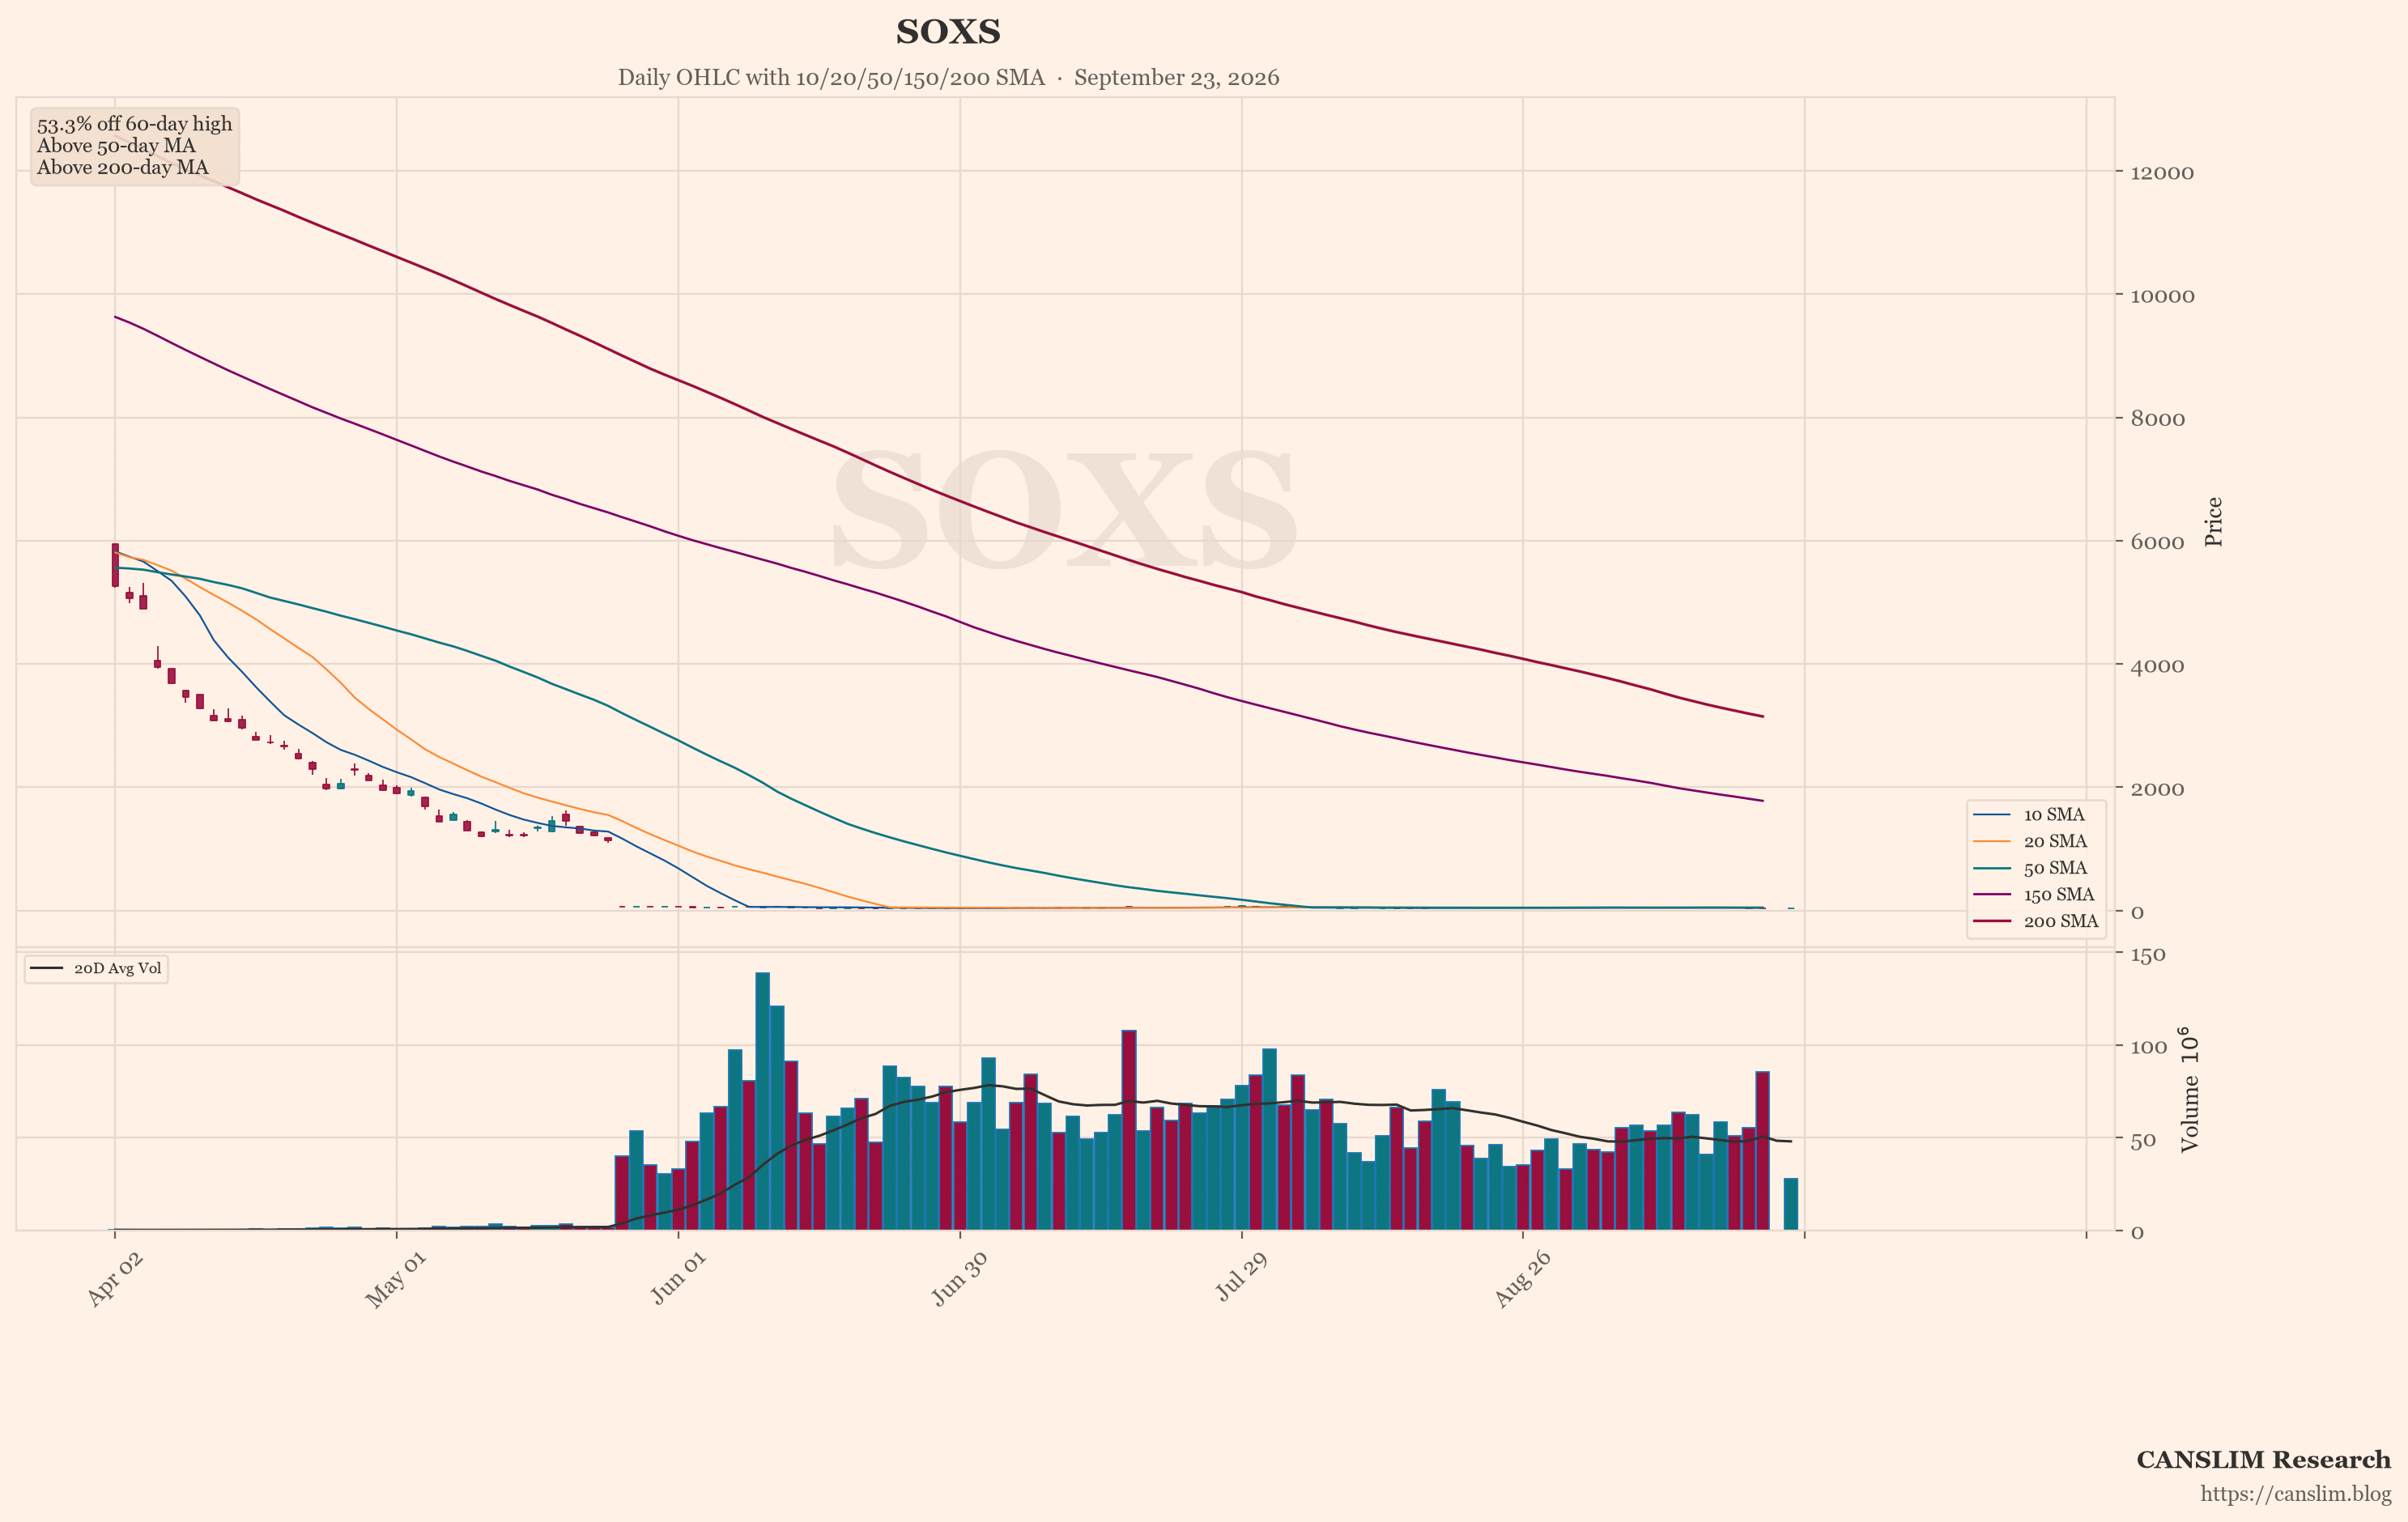
SOXS Flashes the Weakest Chart
The featured chart is SOXS, the inverse semiconductor fund. It shows the weakest technical pattern on the board. That matters. SOXS only works when chips fall. Right now chips are the market’s engine, not its problem. SOXX slipped 1.18% premarket. AVGO fell 1.18% too. MU is holding near highs. So the bearish chip bet is fighting the tape. If SOXS cannot rally on bad chip news, that tells you sellers lack conviction. If it breaks down further, it confirms leadership is still intact. Either way, SOXS is the tell for the AI trade’s next move.
Where This Leaves the Growth Stock Playbook
This is a narrow, fragile rally. Energy risk is real. Rates are a slow drag. AI leadership is crowded. The index can stay near record highs while your watch list quietly breaks down. That is the classic late-stage setup. Stick with leaders showing tight bases and strong volume. Avoid chasing extended names. Respect the 1100 wall in MU. Respect the 7% mortgage rate. Respect weak breadth. If SOXS keeps sinking, the bulls still own the tape. If it starts to climb, tighten stops fast.
Sources: market news brief & global social sentiment data. Updated 2026-09-23 22:00 HKT. For educational purposes only — not investment advice.
Discover more from CANSLIM Research
Subscribe to get the latest posts sent to your email.