Andrew (Content Generated by AI)
General educational commentary only, generated automatically with AI. Not investment advice or a recommendation to buy, sell or hold any security. Capital is at risk.
Rising Treasury Yields Pressure Stock Prices
The Wall Street Journal reported that U.S. stocks slipped Tuesday. Rising Treasury yields were the main pressure point. The 10-year yield moved toward 6%, a multiyear high. Higher yields raise borrowing costs and can weigh on valuations.
Oil prices fell, but that did not lift stocks. New York Fed President John Williams said the Fed need not rush into another rate hike. Barron's reported that odds of an October rate increase dropped after his comments. Even so, the yield move kept pressure on equities.
Consumer Confidence Falls to Multi-Year Low
The Wall Street Journal also reported that U.S. consumer confidence weakened. The Conference Board's September index fell to 81.9, its lowest since 2014, according to a third-party summary. The expectations component stood at 63.6.
Weak confidence adds to concerns about household demand. Markets are still waiting for more direct data on jobs and spending. Wednesday's inflation report includes consumer spending and income figures. The September jobs report follows later.
China Data Improves as Trade Tensions Rise
China's official gauges showed manufacturing, services and construction activity improving. Reuters reported a private survey put services growth at a three-month high. CNBC reported factory activity expanded for the first time in three months.
At the same time, Beijing threatened retaliation if Europe restricts Chinese businesses, CNBC reported. DeepSeek's partnership with Huawei on software tools for Ascend chips shows China's push for an alternative AI ecosystem. This does not resolve questions about the competitiveness of those alternatives.
Online Sentiment Turns Bullish before Key Data
Online sentiment comes from unverified posts by anonymous retail users. It may include rumour or speculation and has not been checked. It is not institutional flow or confirmed positioning.
An estimated fear/greed level of about 54/100 moved slightly toward greed from 46. Posts turned bullish after overnight futures rose. Some users wrote "big green tomorrow" and "770 open." But anxiety remained. PCE data, MU earnings, quarter-end rebalancing and Friday's payrolls are packed into 48 hours.
Some posts described a "PCE cooked books" thesis. They cited estimates that methodology changes could lower core PCE by about 0.15–0.2 percentage points. Others noted this is a reassessment of historical data, not evidence that inflation is cooling. One reading is that bulls are drawing confidence from expectations, not from price confirmation. SPY closed Tuesday down 0.15% and gained only about 0.2% overnight. Some posts noted SPY has failed twice to break through its highs.
Chart Screen Shows Weakness in One Index
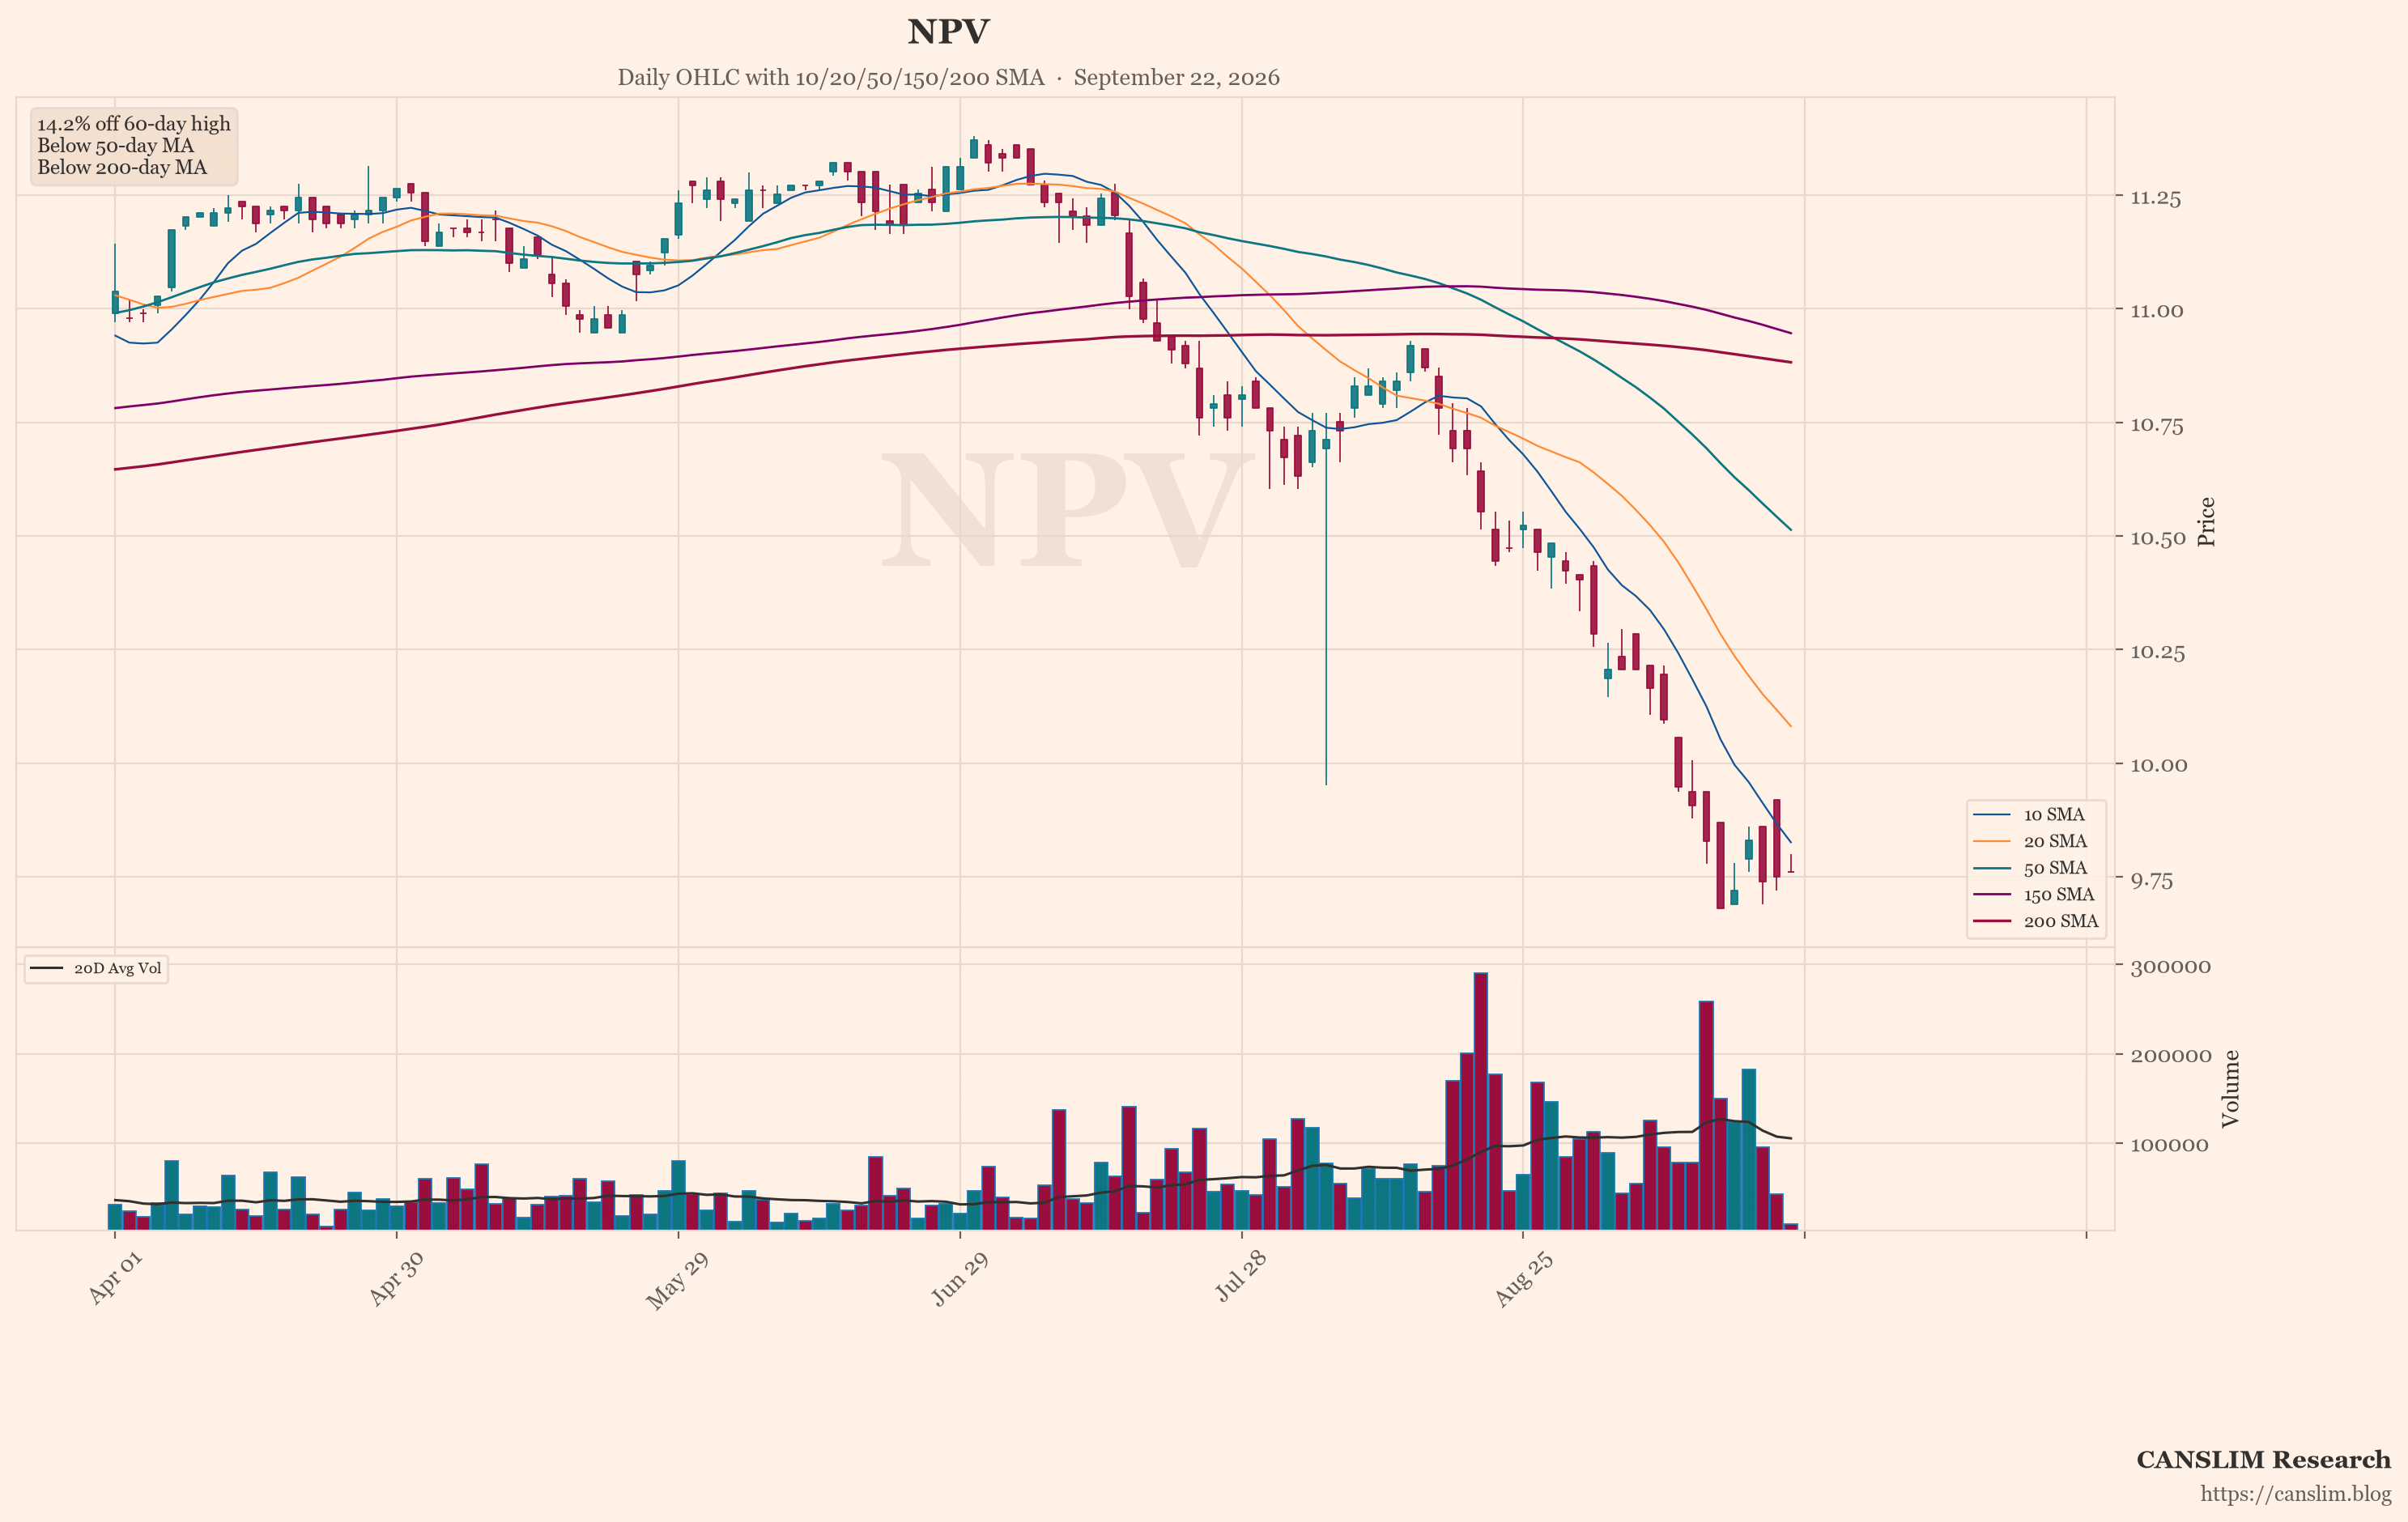
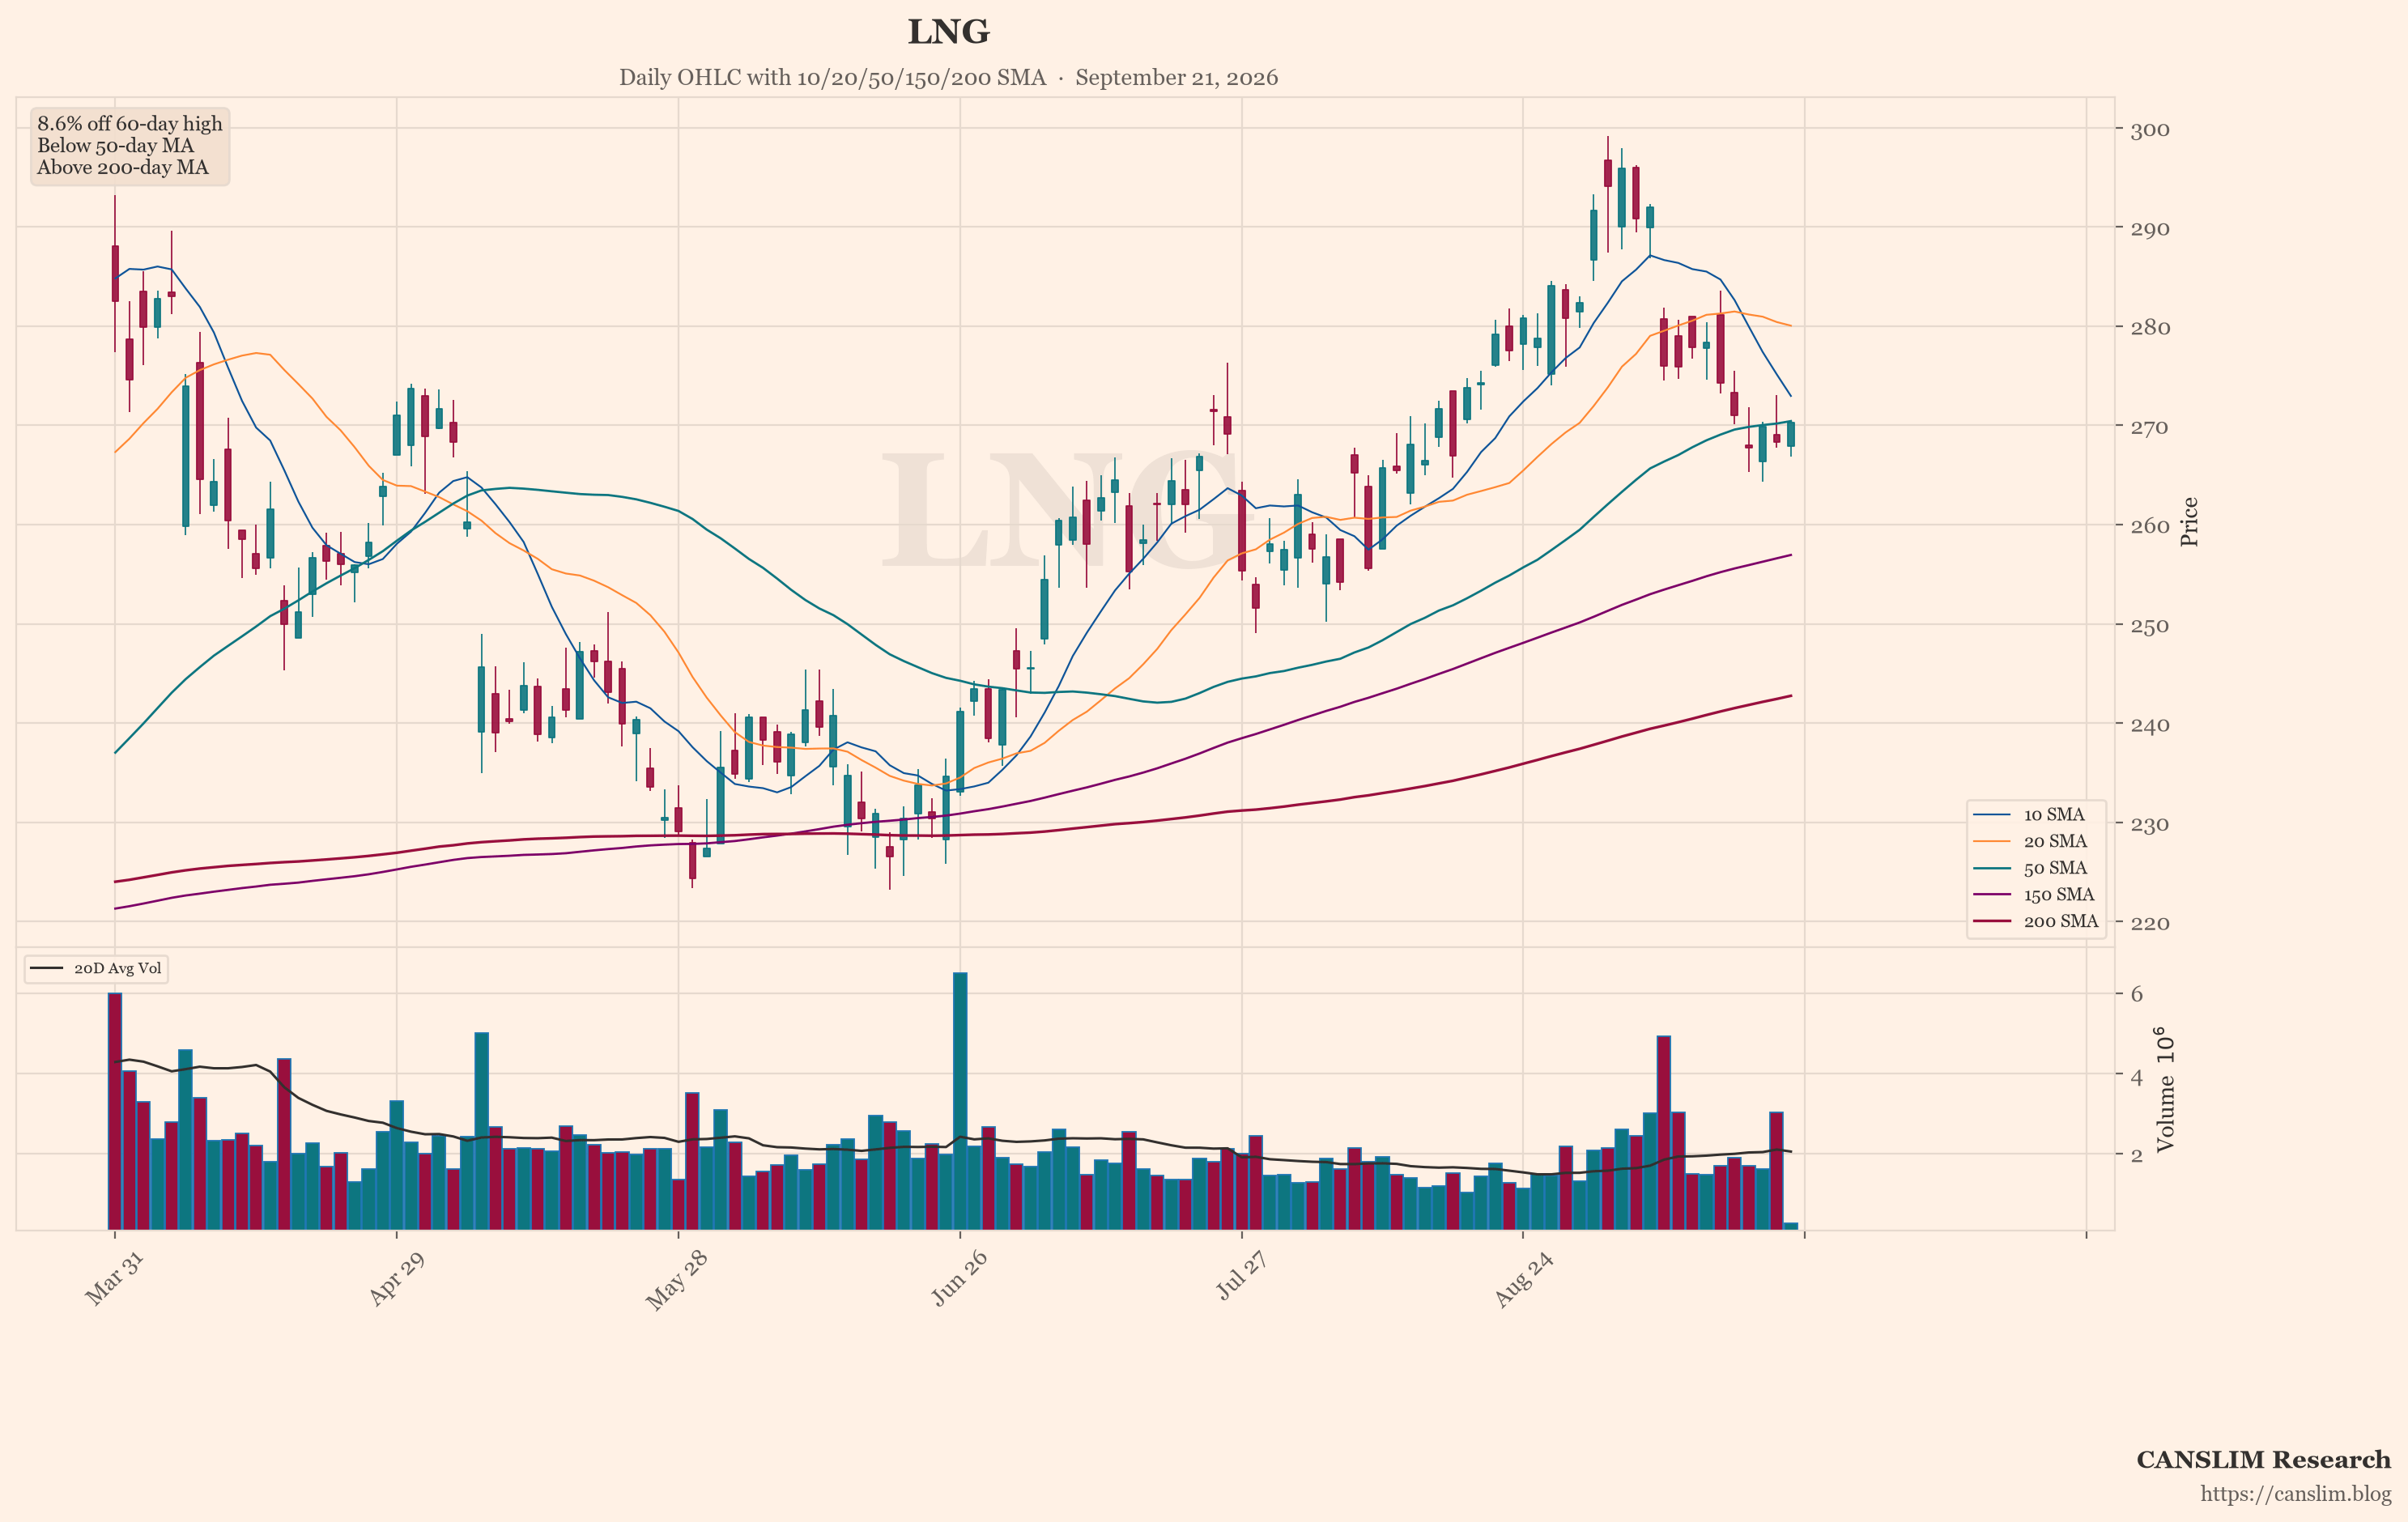
The featured chart shows EU. An automated technical screen picked it because, among the indices and stocks it checked, it showed the most weakness on a few measures. These include distance from its recent high, position versus its 50-day and 200-day moving averages, and down days on higher volume. One screen is not a full view. Past price patterns do not predict future results.
Mixed Signals Leave Direction Uncertain
Conditions remain mixed. Yields are high and consumer confidence is weak. The Fed may pause, but inflation data could change that view. China's data improved, while trade tensions add uncertainty. The U.S. IPO outlook is cooling, with delayed offerings suggesting less appetite for new listings. Online sentiment leans bullish, but it is unverified and may not match price action. Key data due this week could shift rate expectations in either direction.
Sources: a third-party AI-generated market news summary, and an AI summary of unverified posts by anonymous retail users online. This article was written by an AI language model from those summaries and published automatically without human review. Updated 2026-09-30 14:00 HKT.
CANSLIM Research (canslim.blog) is an independent educational publisher. It is not licensed or registered as a broker, investment adviser, research analyst or asset manager in any jurisdiction. This article is general information for education only. It is not investment advice, a research report, an investment recommendation, or an offer or solicitation to buy or sell any security, and it does not consider any reader's objectives, financial situation or needs. No ticker, chart, heading or technical comment is a suggestion to buy, sell, hold or short. Figures come from third-party sources, are not independently verified, and may be incomplete, out of date or wrong. Online sentiment may include rumour, speculation or coordinated posting. Past performance and past price patterns do not predict future results. Investing involves risk, including the loss of capital. This article is not updated after publication. Laws differ by country; seek advice from a licensed professional in your jurisdiction before making any investment decision.
Discover more from CANSLIM Research
Subscribe to get the latest posts sent to your email.