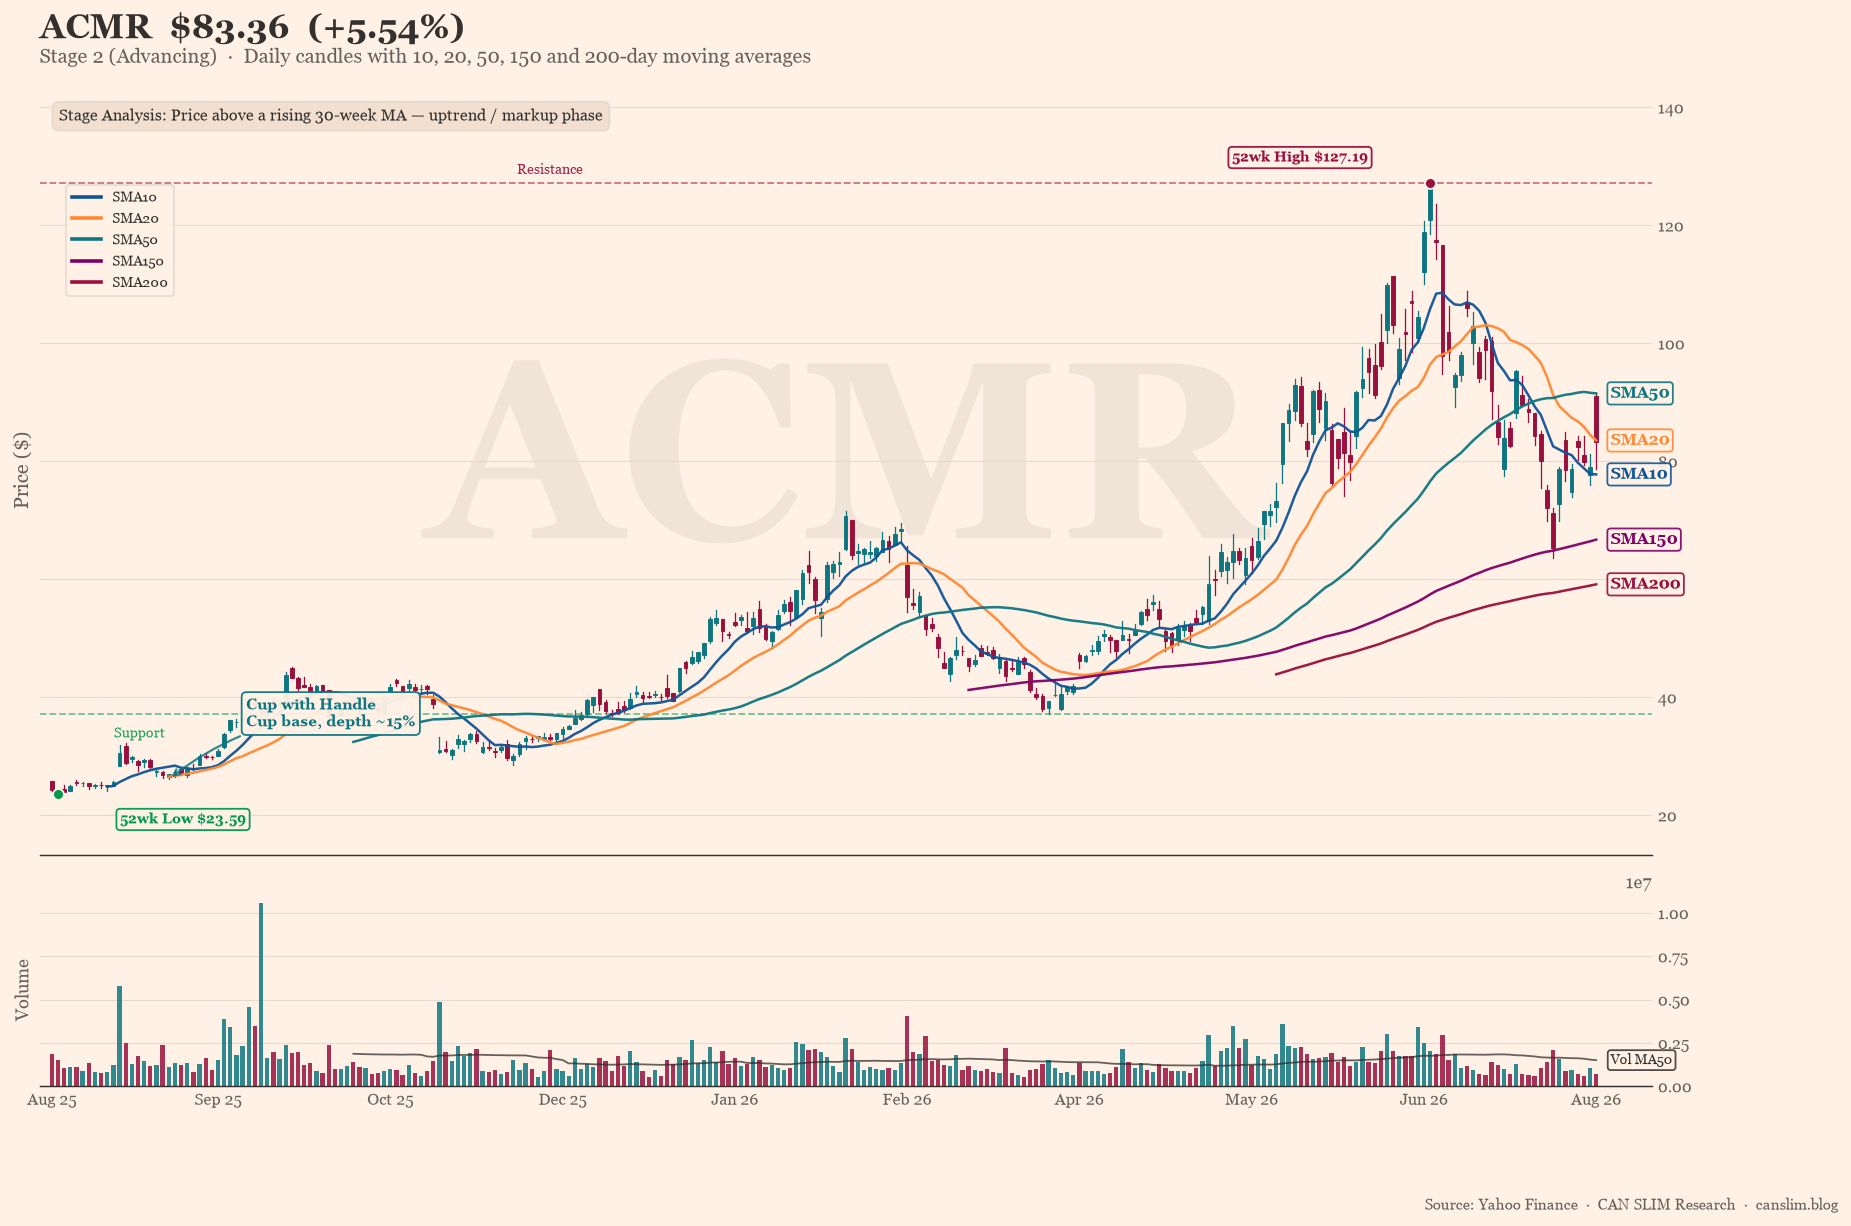
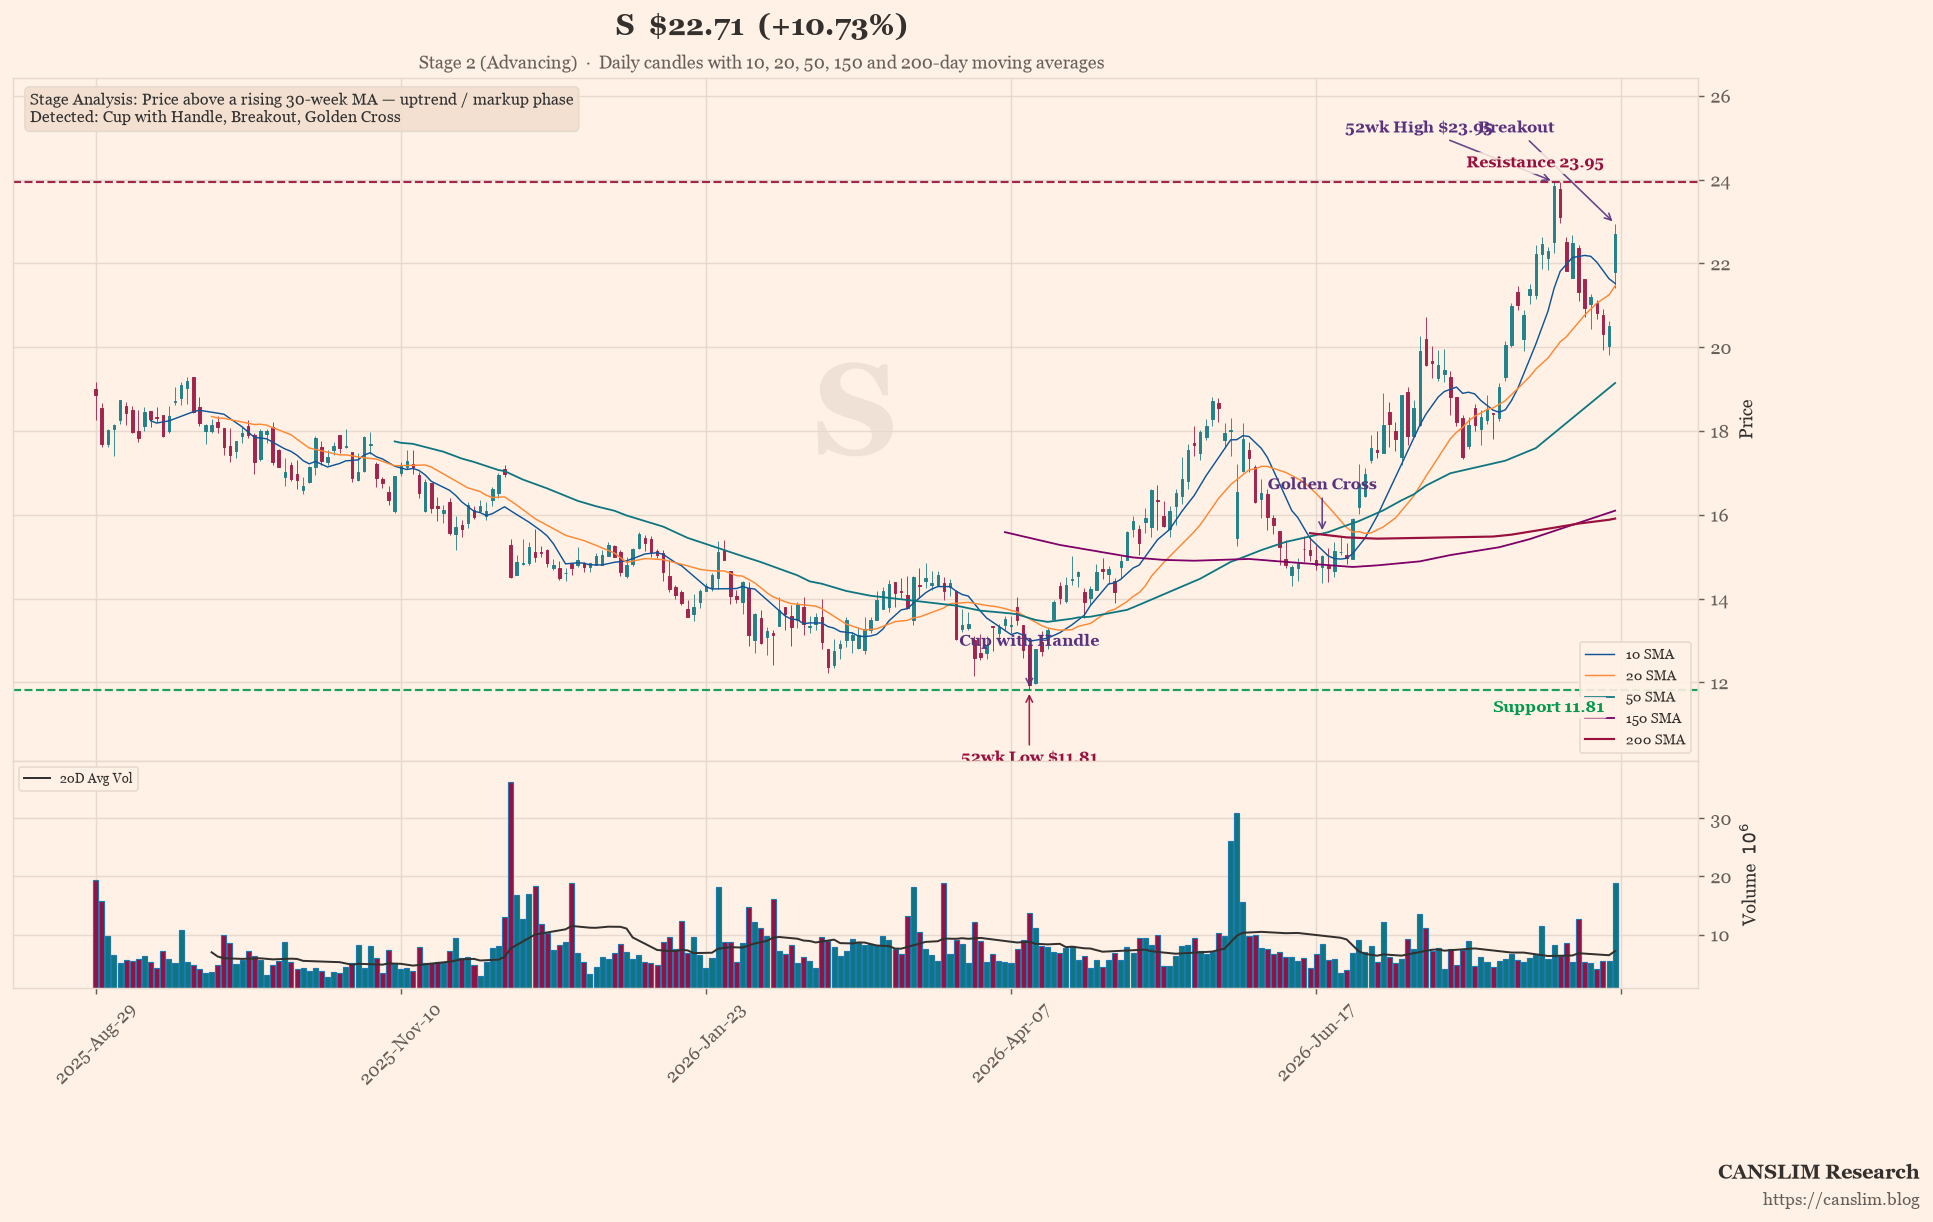
NBIS Daily · data to 2026-11-12 close · 10 SMA 20 SMA 50 SMA 150 SMA RS vs Nasdaq
Frozen at publication – this chart does not move. Open live chart on TradingView →
Nebius posted 571% revenue growth to $907M and guided to $12-13B for 2027, yet the stock fell 16.8%. Management dodged questions on prepayments, customer concentration, and CapEx. The real story: soaring demand but mounting cash burn and evasive answers. Is the AI infrastructure darling running out of runway?
Inside the Full Analysis
- 🔒Record Growth, Record Questions
- 🔒The Missing Metrics: What Nebius Didn’t Tell You
- 🔒When Confidence Cracks: Script vs. Reality
- 🔒Evasion Tactics: The Hot Seat Moments
- 🔒Excuses vs. Execution: The Blame Game
- 🔒The CAN SLIM Check
- 🔒Conclusion
Disclaimer: This report is for informational and educational purposes only and does not constitute investment advice. Always verify against primary filings before making any investment decision.
Continue Reading
This article is for pass holders.
Most Flexible
30-Day Pass$12.00One-time purchase · no auto-renewalBuy 30 DaysSave $24.00
365-Day Pass$120.00$144.00One-time purchase · no auto-renewalBuy 365 Days
30-Day Pass$12.00One-time purchase · no auto-renewalBuy 30 DaysSave $24.00
365-Day Pass$120.00
Already a pass holder? Sign in · Continue with Google