 Andrew
General educational commentary only, generated automatically with AI. Not investment advice or a recommendation to buy, sell or hold any security. Capital is at risk.
Indexes Hold near Records as Leadership Stays Concentrated
U.S. stocks enter a busy week near record highs, according to the news brief. The four-year bull market remains supported by strong earnings expectations and heavy spending on artificial intelligence. However, the brief reports that the rally is narrow. A small group of mega-cap companies is doing much of the lifting. Many S&P 500 stocks and smaller companies are lagging. The brief states that this concentration leaves the index vulnerable if AI spending fails to deliver the growth investors expect.
CPI and Bank Earnings Set the Week's Main Tests
The news brief reports that the main tests arrive on Wednesday with September CPI. Major banks report third-quarter results throughout the week. The brief states that persistent inflation could reinforce expectations for another Fed rate hike. That could keep long-term yields elevated. Higher yields may pressure stock valuations and borrowing-sensitive sectors. Bank results should offer an early read on credit conditions and consumer resilience, according to the brief. One reading is that the market's direction this week may depend more on data than on company news.
Yields above Five Percent Weigh on Rate-Sensitive Areas
The social sentiment report, which comes from unverified posts by anonymous retail users online and may include rumour or speculation, notes that the 10-year U.S. Treasury yield stood at 5.24% on Friday. The report says it briefly reached its highest level since 2002 earlier in the month. The news brief states that high long-term yields threaten equity valuations and add pressure to housing and other debt-sensitive areas. The sentiment report describes online discussion of hedging against an AI bubble, with some posts mentioning long-bond funds. That chatter has not been checked and should not be treated as fact. One interpretation is that rate anxiety is now a common thread across both professional commentary and retail posts.
Chip and Telecom Shares Draw Divergent Online Attention
The sentiment report describes weakness in memory and semiconductor shares on Friday. It cites MU and SNDK as lower, along with SOXL and NVDA. It also reports a one-day drop in telecom names after news that SpaceX plans to acquire spectrum for a satellite mobile service. The report says VZ and TMUS fell sharply, and that ASTS closed at a new 52-week low. These figures come from the sentiment report and have not been independently verified. The news brief does not cover these moves. Online sentiment at the theme level appears split: some posts question AI spending returns, while others point to booked capacity through 2028. This may suggest uncertainty rather than a clear consensus.
Breadth Measures Show Damage beneath the Surface
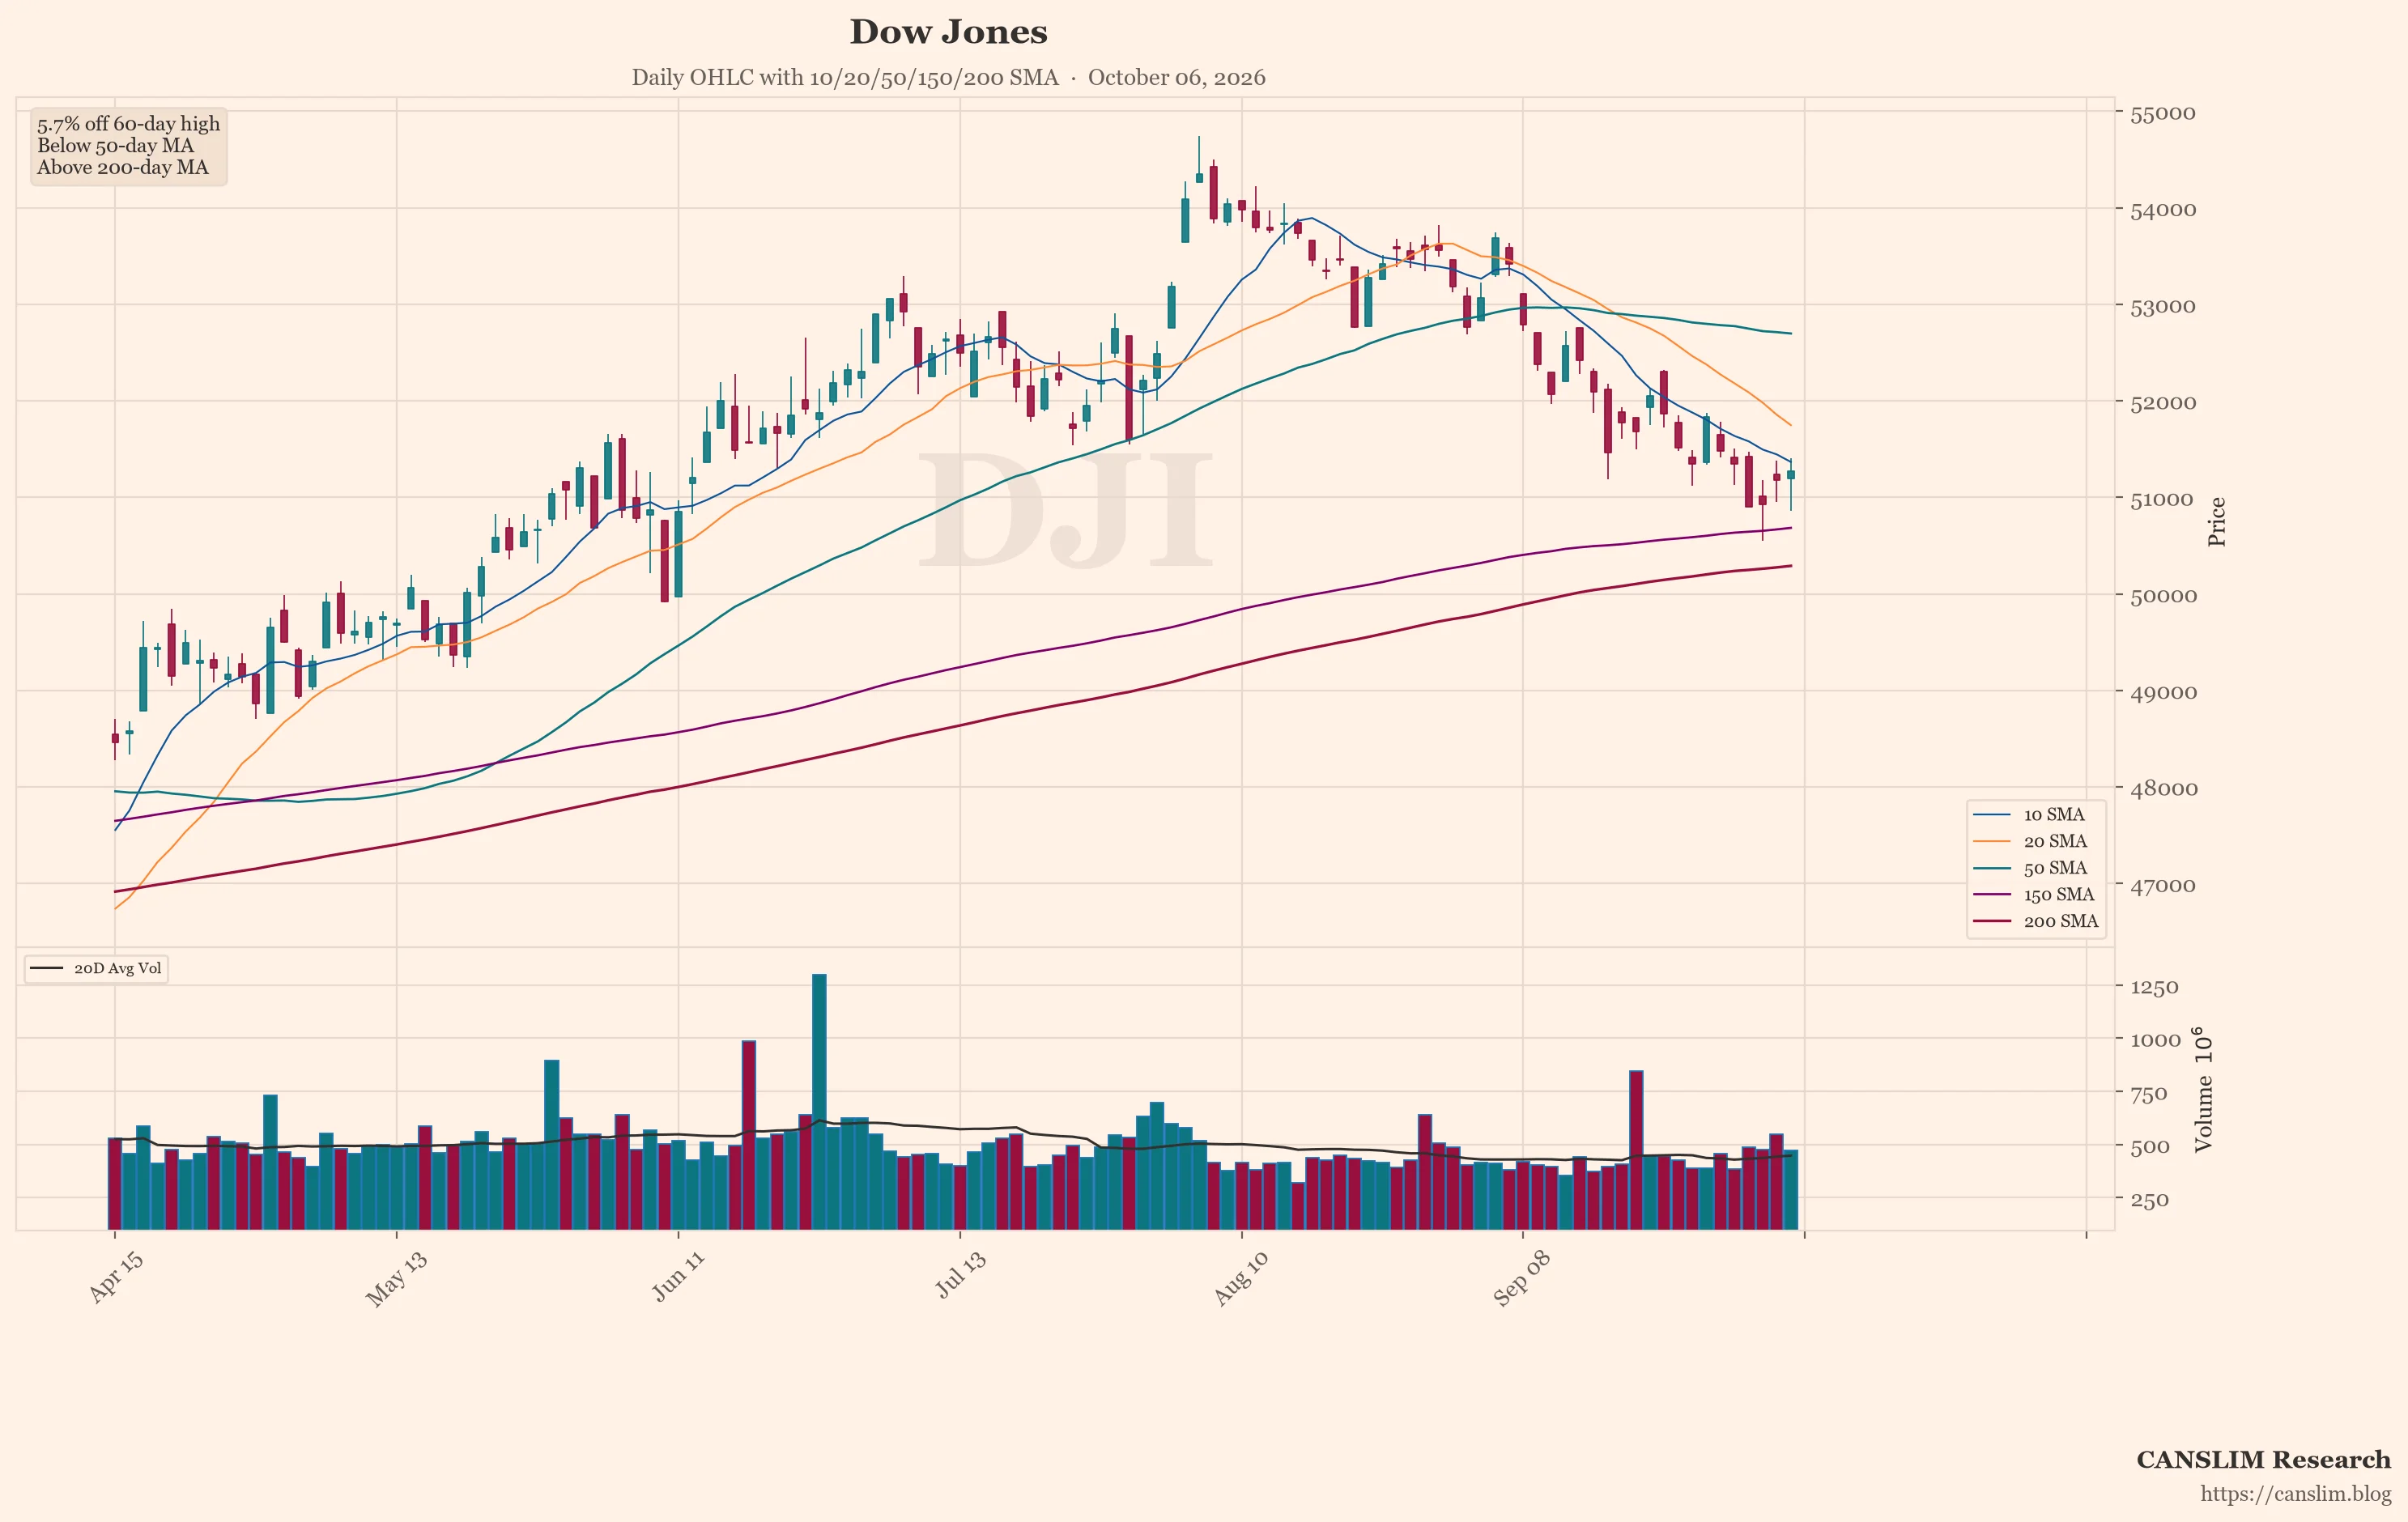
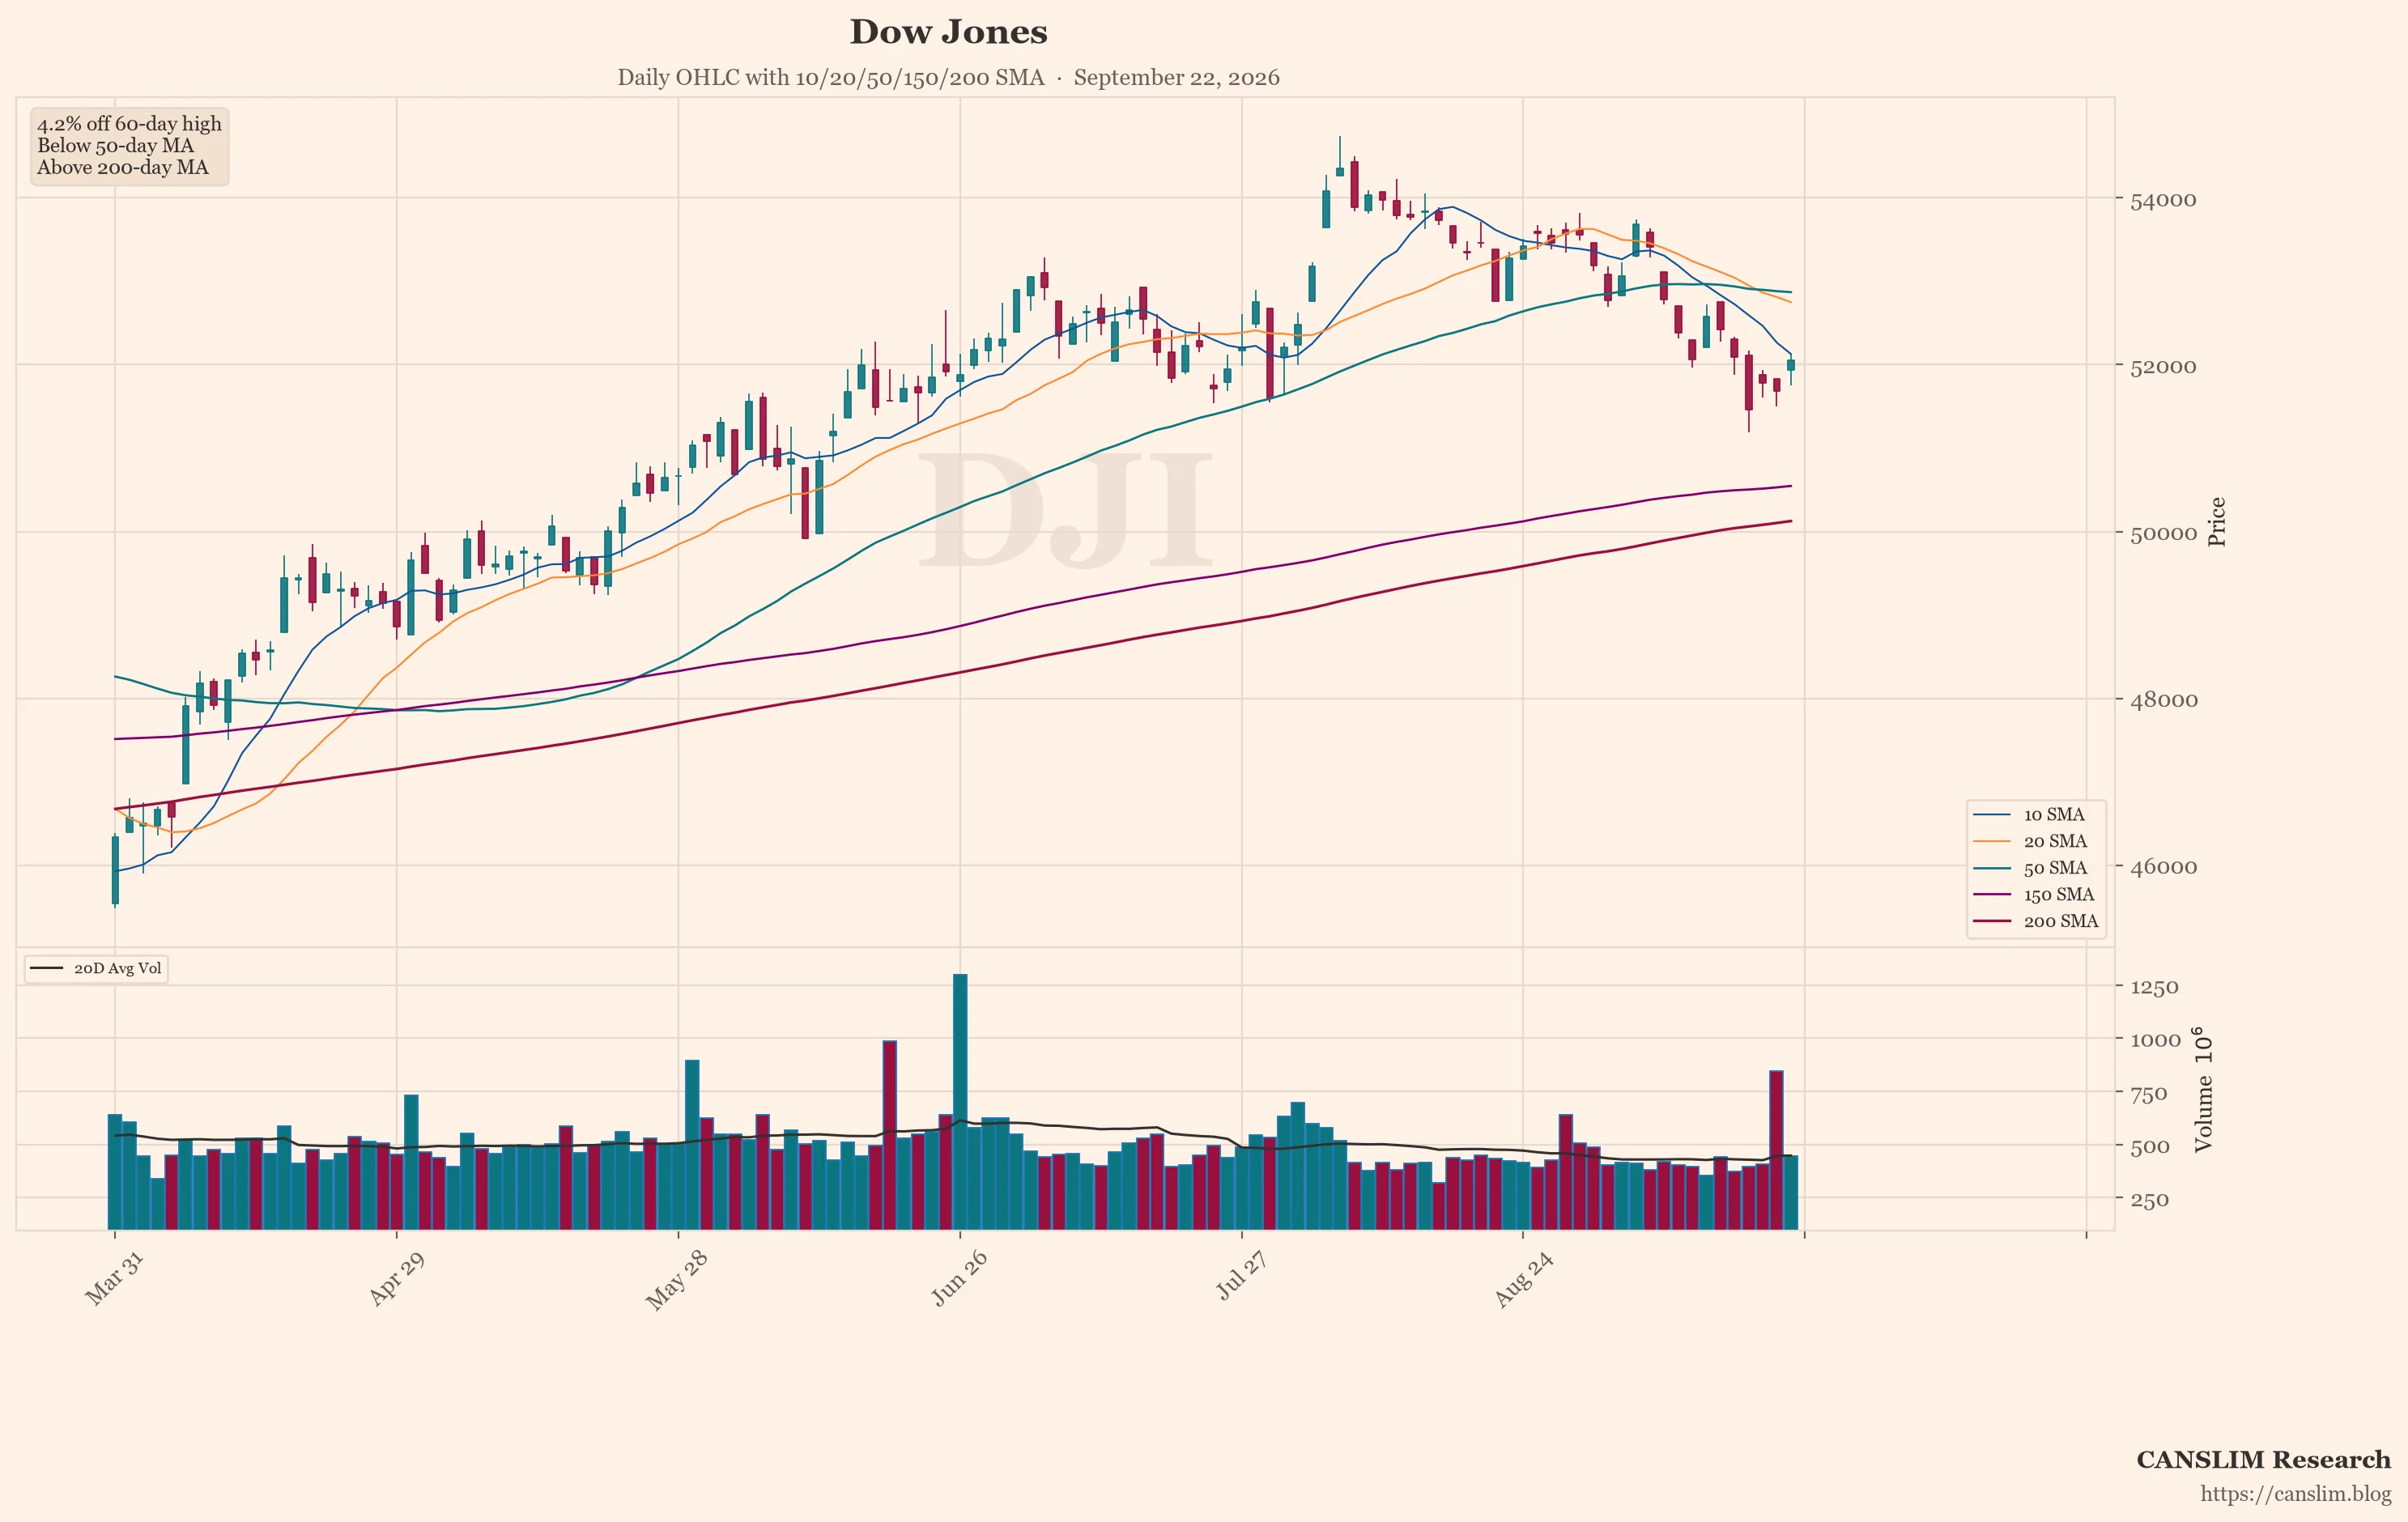
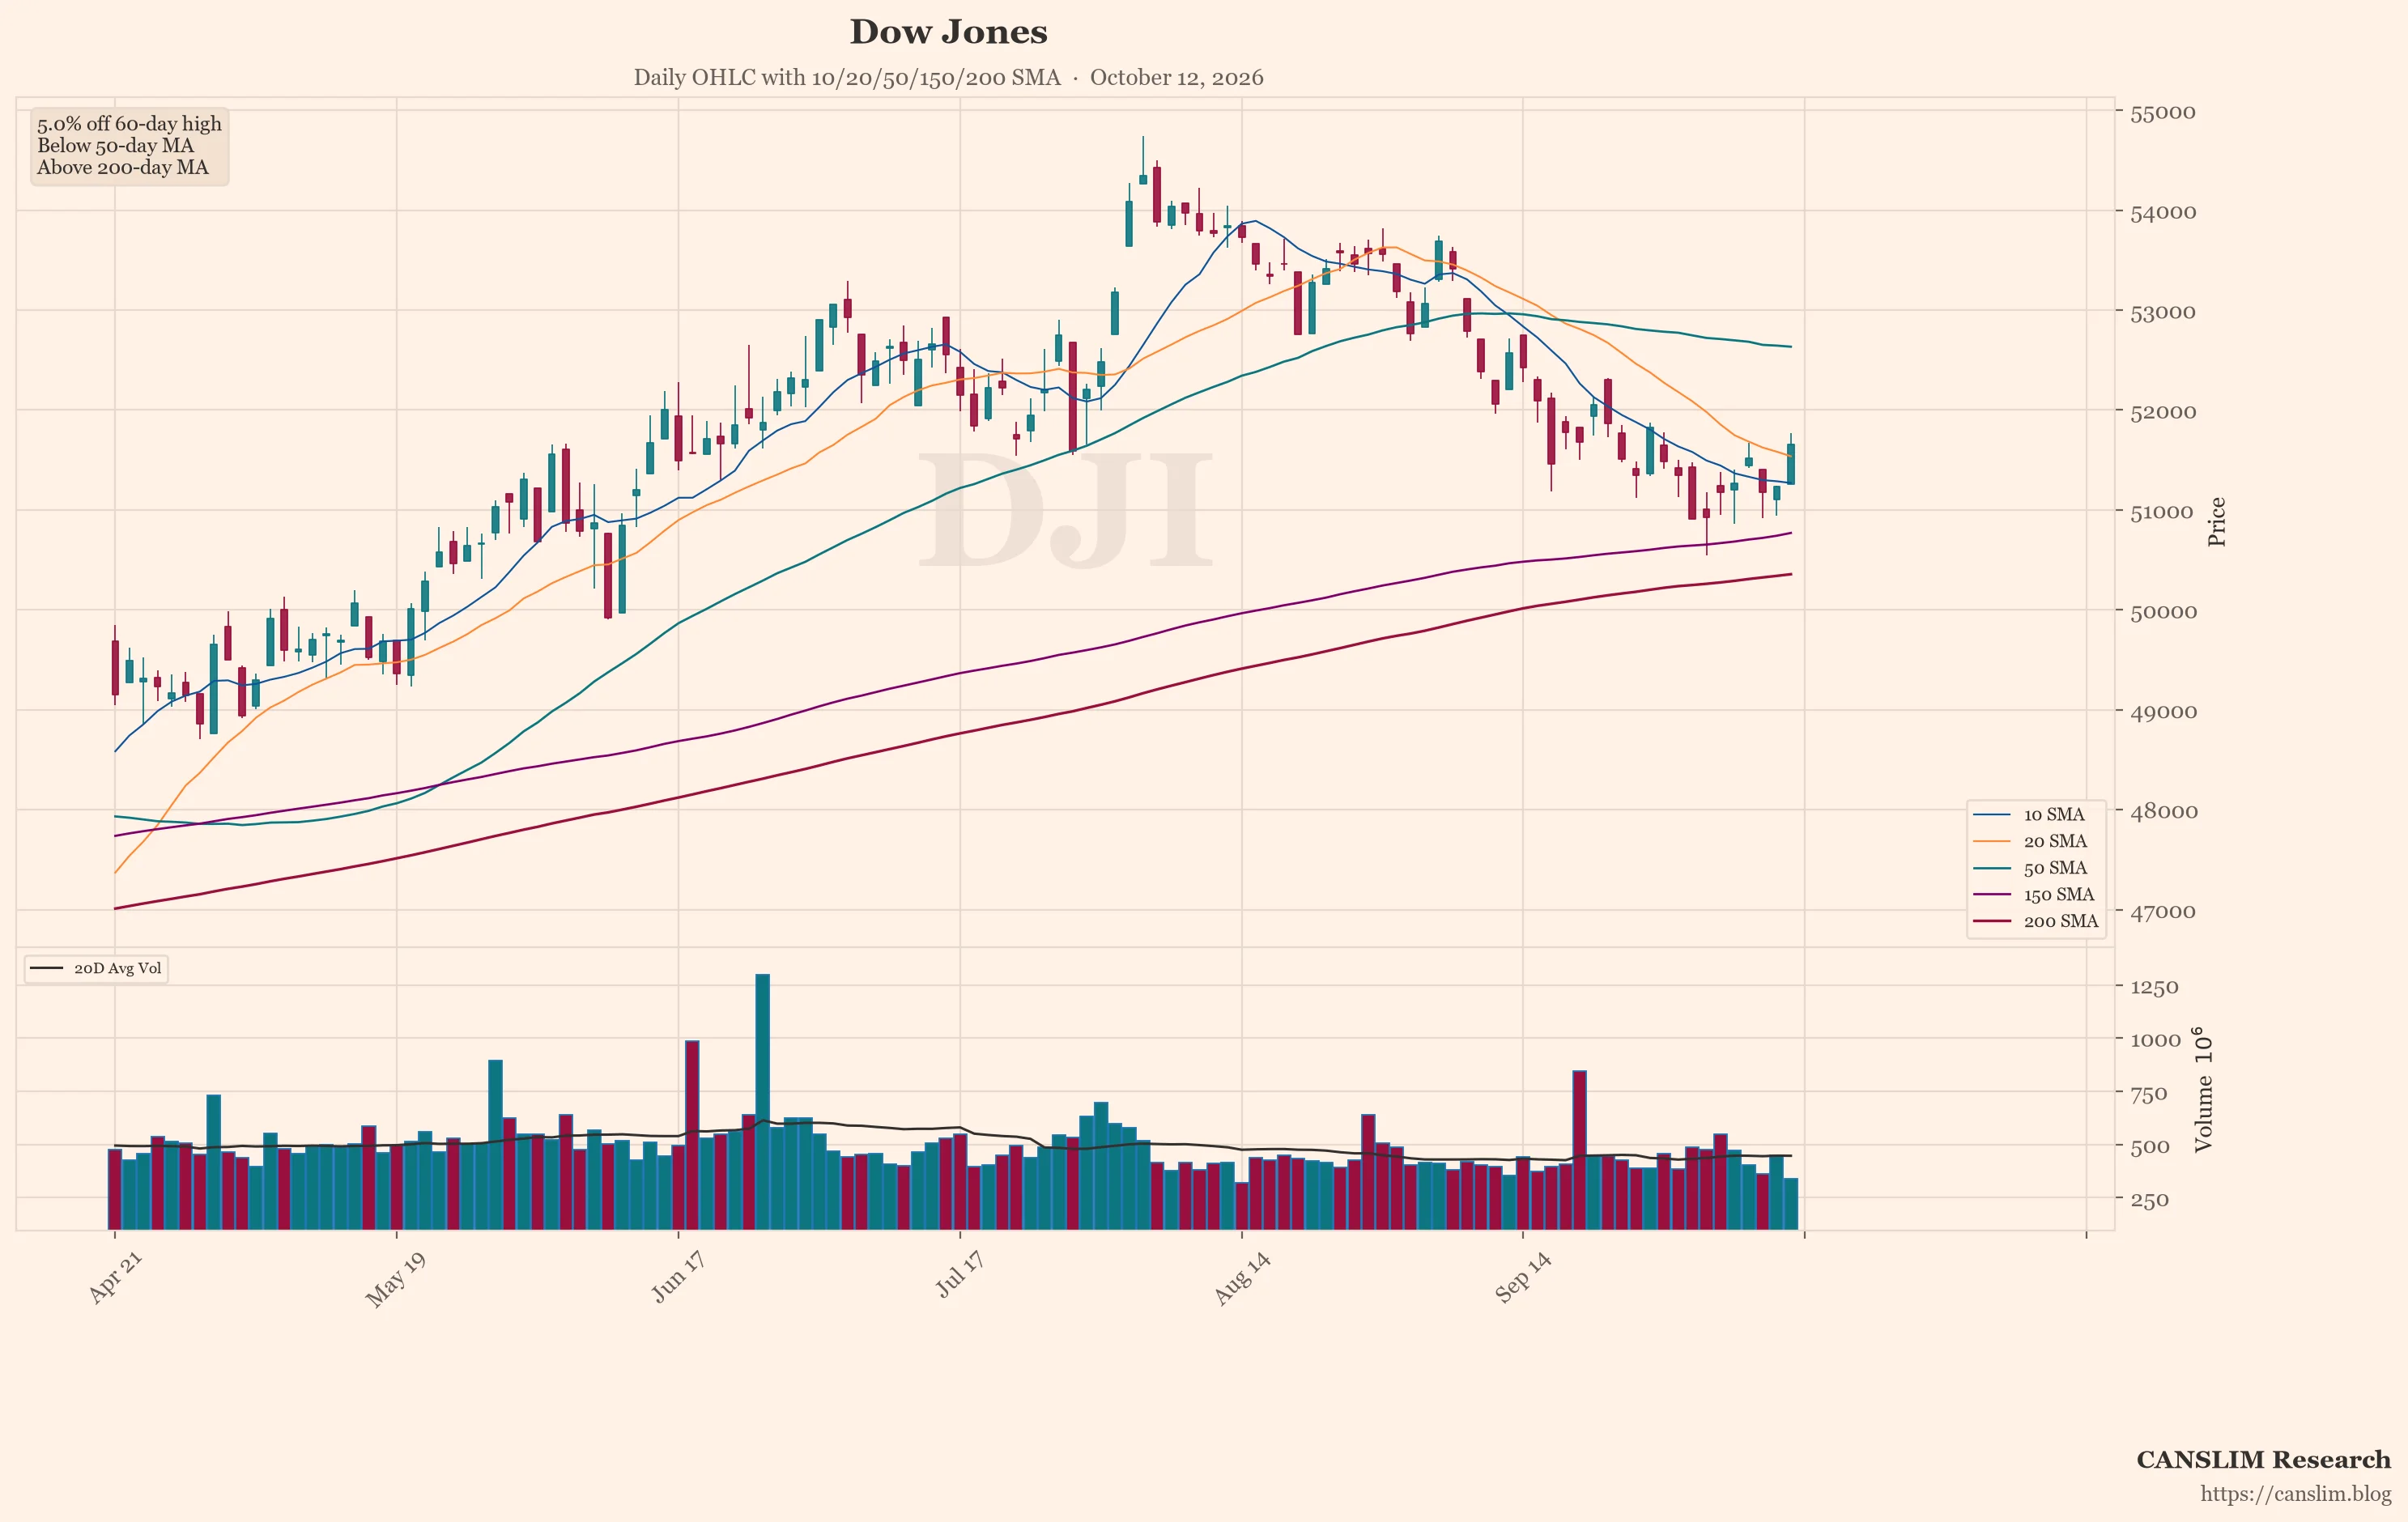
The news brief cites a Seeking Alpha piece titled "15 Years In, I've Never Seen The S&P 500 Hide So Much Damage." The brief also notes that many S&P 500 constituents and smaller stocks are weaker than the headline index. The sentiment report puts the estimated Fear/Greed level at about 45/100, neutral with a slight tilt toward fear. It says calls to hold cash or hedge have become more common than last week. The featured chart shows the Dow Jones (^DJI). An automated technical screen picked it because, among the indices and stocks it checked, it showed the most weakness on a few measures: distance from its recent high, position versus its 50-day and 200-day moving averages, and down days on higher volume. One screen is not a full view, and past price patterns do not predict future results.
Earnings Reactions and AI Spending Remain Unresolved
The sentiment report says reports put OpenAI's annualized revenue at about $50 billion, below market expectations of $68–70 billion. It says this triggered a chip-stock sell-off, followed by a partial recovery. The news brief states that AI investment remains a major source of earnings growth, but investors are increasingly focused on whether that spending produces lasting returns. The brief also notes that the S&P 500's longer-term trend remains bullish, though uneven daily signals make chasing momentum a higher-risk approach. Growth-stock methods often track breadth, earnings reactions and moving averages as descriptions of what has happened, not as signals.
A Narrow Rally with Several Open Questions
Conditions near record highs rest on strong earnings expectations and AI spending. At the same time, leadership is concentrated, long-term yields are elevated, and inflation data could shift rate expectations. Bank results may clarify credit conditions, but the outcome is uncertain. Online sentiment from anonymous retail posts leans cautious, though such posts are unverified and may be wrong. The news brief describes choppy technical signals and argues for selectivity rather than chasing the index. Risks include a hot CPI reading, weak bank commentary, and any sign that AI spending is not producing returns. The longer-term trend remains positive in the brief's account, but the path is uncertain.
Sources: a third-party AI-generated market news summary, and an AI summary of unverified posts by anonymous retail users online. This article was written by an AI language model from those summaries and published automatically without human review. Updated 2026-10-12 06:00 HKT.
CANSLIM Research (canslim.blog) is an independent educational publisher. It is not licensed or registered as a broker, investment adviser, research analyst or asset manager in any jurisdiction. This article is general information for education only. It is not investment advice, a research report, an investment recommendation, or an offer or solicitation to buy or sell any security, and it does not consider any reader's objectives, financial situation or needs. No ticker, chart, heading or technical comment is a suggestion to buy, sell, hold or short. Figures come from third-party sources, are not independently verified, and may be incomplete, out of date or wrong. Online sentiment may include rumour, speculation or coordinated posting. Past performance and past price patterns do not predict future results. Investing involves risk, including the loss of capital. This article is not updated after publication. Laws differ by country; seek advice from a licensed professional in your jurisdiction before making any investment decision.
Discover more from CANSLIM Research
Subscribe to get the latest posts sent to your email.