 Andrew@CANSLIM RESEARCH
Momentum Narrowed While the Index Stood Still
The S&P 500 finished last week almost flat. That sounds calm. It is not. The Fed raised rates by 25 basis points. The 10-year Treasury yield sits near 5%. The 2-year is around 4.75%. Big-cap growth and AI names keep carrying the headline index. Under the surface, breadth is thinning. Liquidity is tighter. Fewer stocks do the heavy lifting. That is a classic late-stage warning. The rally looks strong on the screen but weak underneath.
The Online Crowd Is Euphoric and Knows It
Global social sentiment is one-sidedly bullish. Overnight, SPY traded at 764.62, up 0.39%. QQQ rose 0.53%. The crowd mocked the bears all night. Falling oil was treated as a green light for the index to run. Yet some traders posted a rare warning. "There are too many bulls here," one wrote. That comment got upvotes. When the crowd starts joking about being exit liquidity, pay attention. That is late-stage behavior, not early-stage opportunity.
Memory Chips Are Trading in Their Own Universe
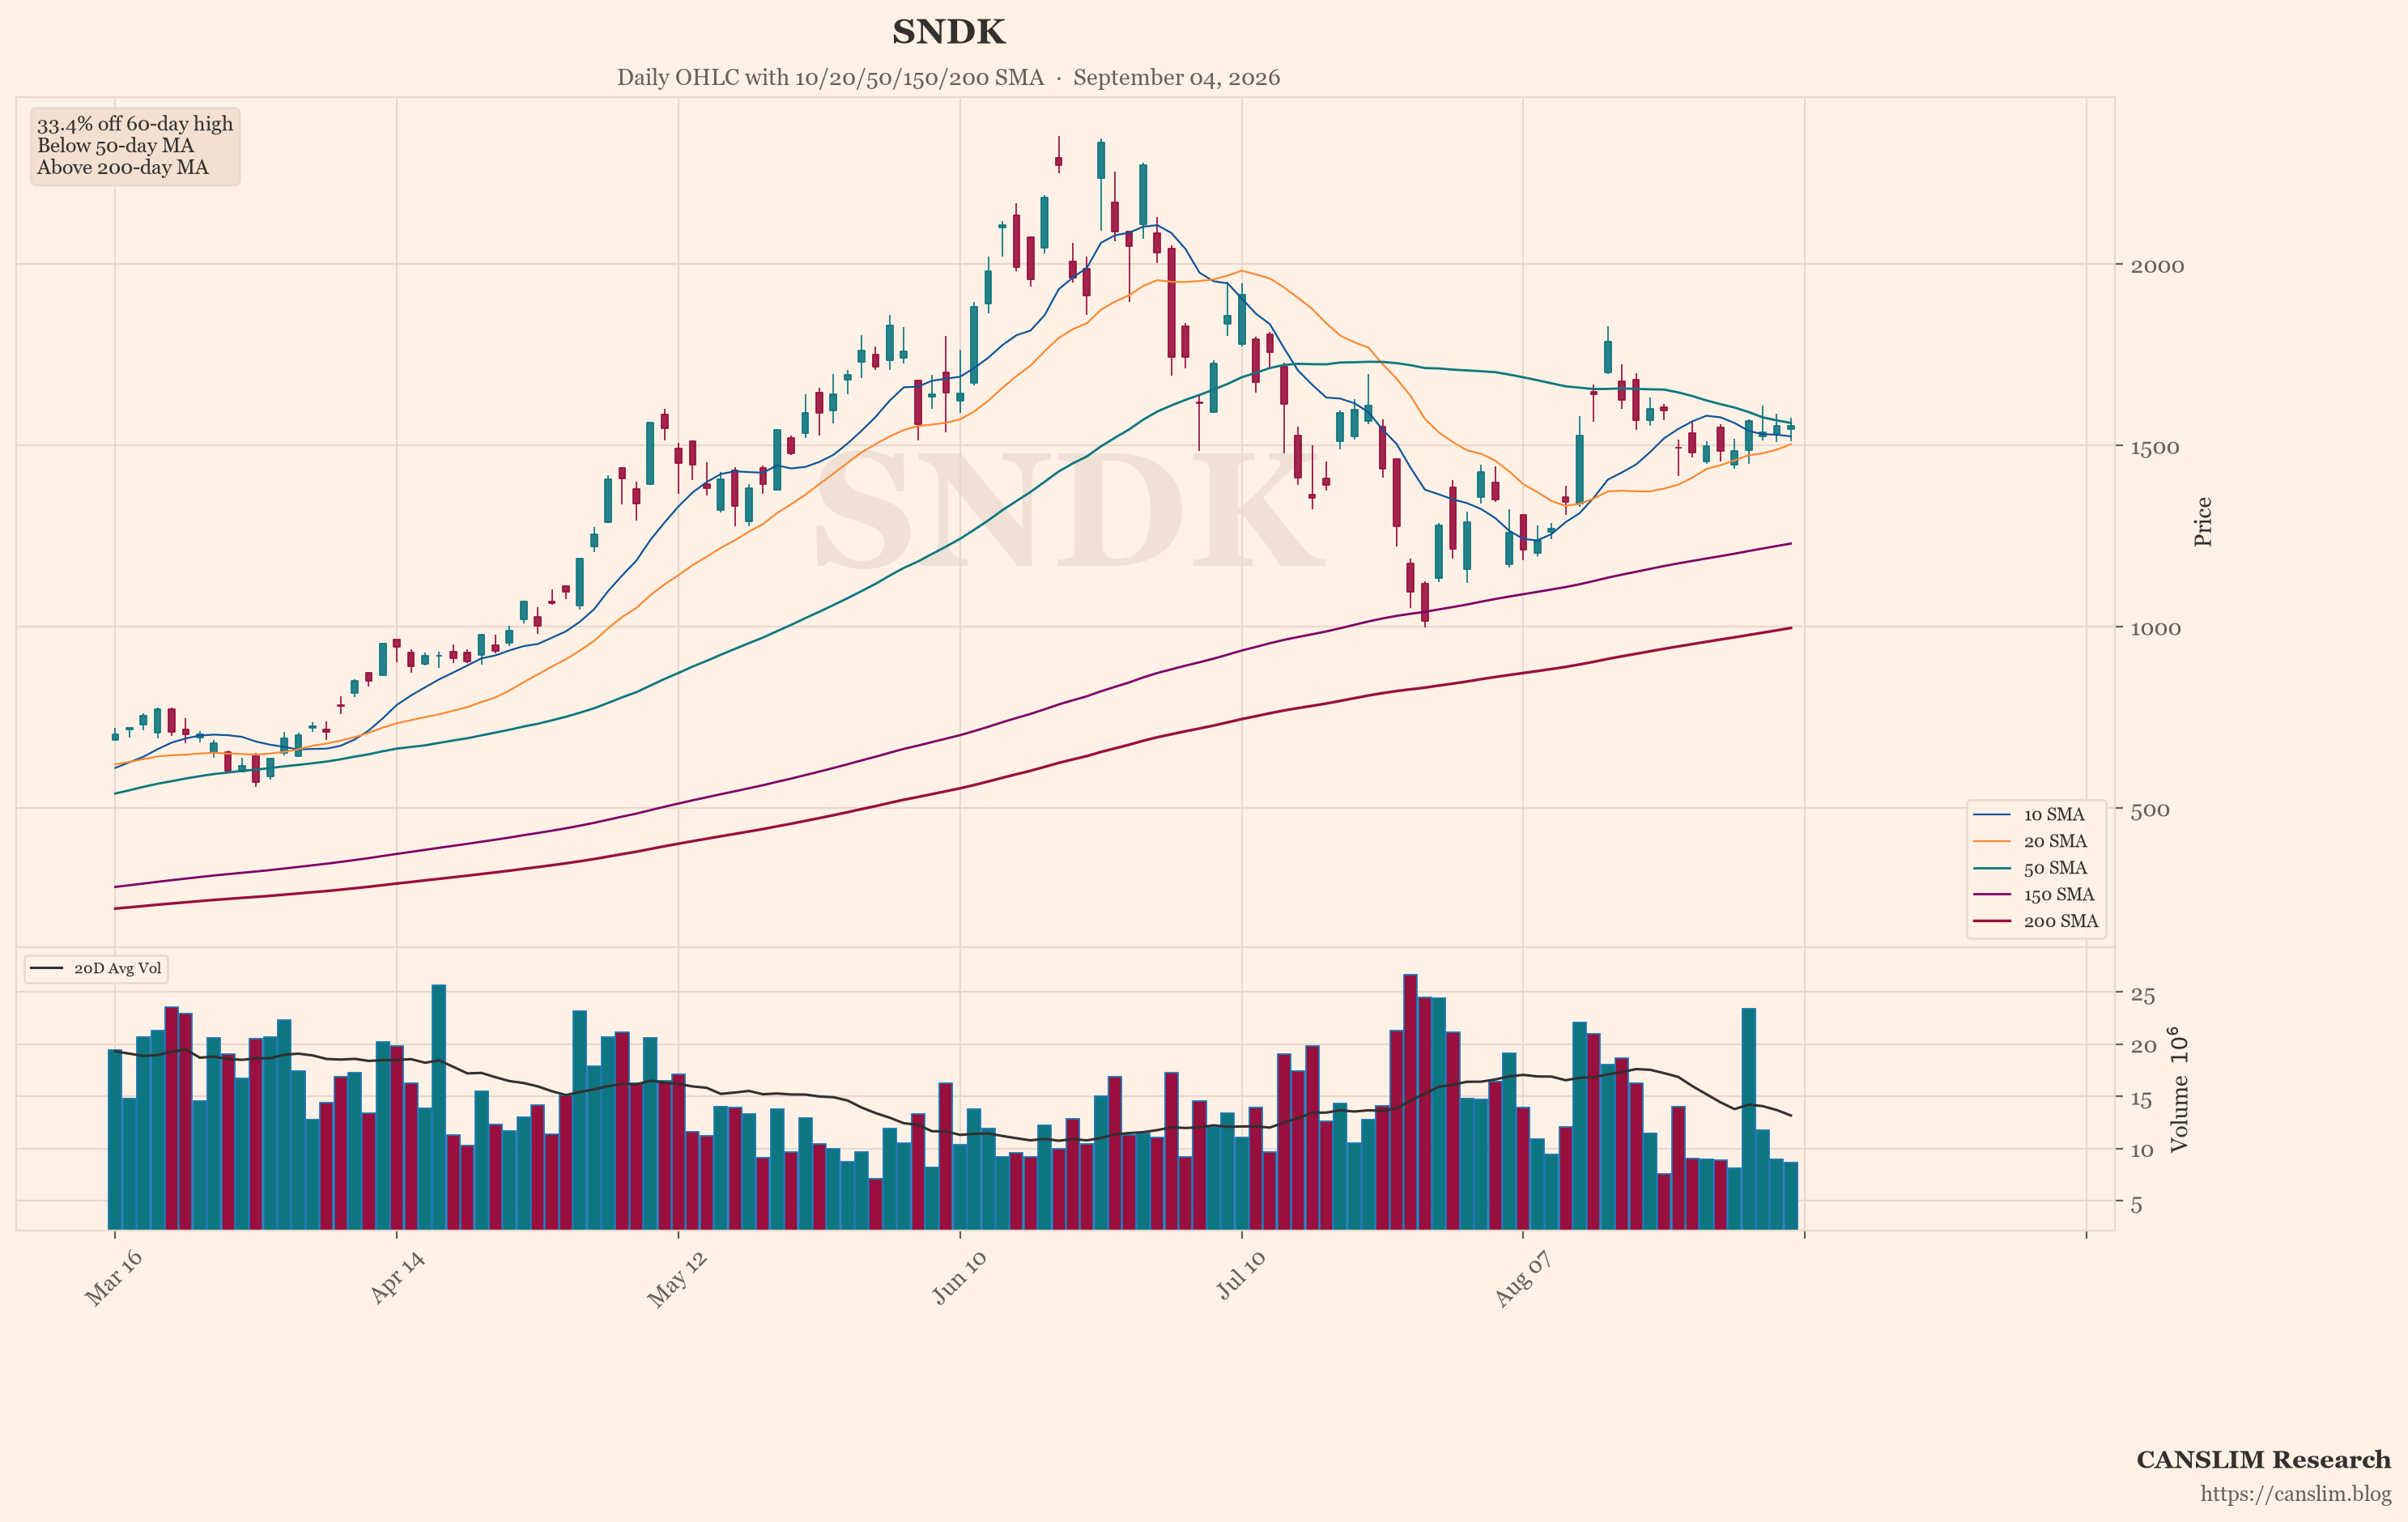
The memory complex is red hot. SNDK closed Friday at 1791.83, up 10.99%. MU closed at 1015.53, up 3.95%. Both pushed higher overnight. SOXL gained 7.92% Friday and another 3.75% overnight. AMD traded at 571.46, up 2.10%. INTC rose 3.96%. All eyes sit on MU's 9/30 earnings call. Consensus wants revenue near $50.8 billion, up roughly 350% year over year. That print is the anchor for the whole group. If it disappoints, the complex shakes.
Oil Fell While Refineries Burned
This is the strangest story of the week. Refineries are being hit. Europe faces a fourth-quarter jet-fuel shortfall. The Strait of Hormuz is blockaded. Yet crude keeps falling. USO closed Friday at 153.85, down 0.98%, then dropped to 150.86 overnight. XLE fell 0.84%. The crowd's best explanation: refining capacity, not production, is the broken link. Diesel crack spreads hit a record near $100 per barrel. Retail diesel hit an all-time high of $6.05. Gasoline sits at $4.29. Crude is weak. Refined products are screaming. That split hurts transport, manufacturers and retailers.
Washington and Beijing Set the Week's Tone
Thursday's Trump-Xi meeting in Washington is the main catalyst. Treasury Secretary Bessent and Vice Premier He Lifeng already met at JPMorgan's New York headquarters. They agreed to set up an AI dialogue mechanism. Bessent called the talks "very successful." Investors want the trade truce extended past November. Chinese biopharma stocks jumped on hopes that U.S. drug-licensing deals stay open. That is a rare bright spot in China-linked assets. Watch Fed speakers, consumer sentiment, and earnings from Costco and Darden for demand clues.
One Chart Shows the Weakest Link
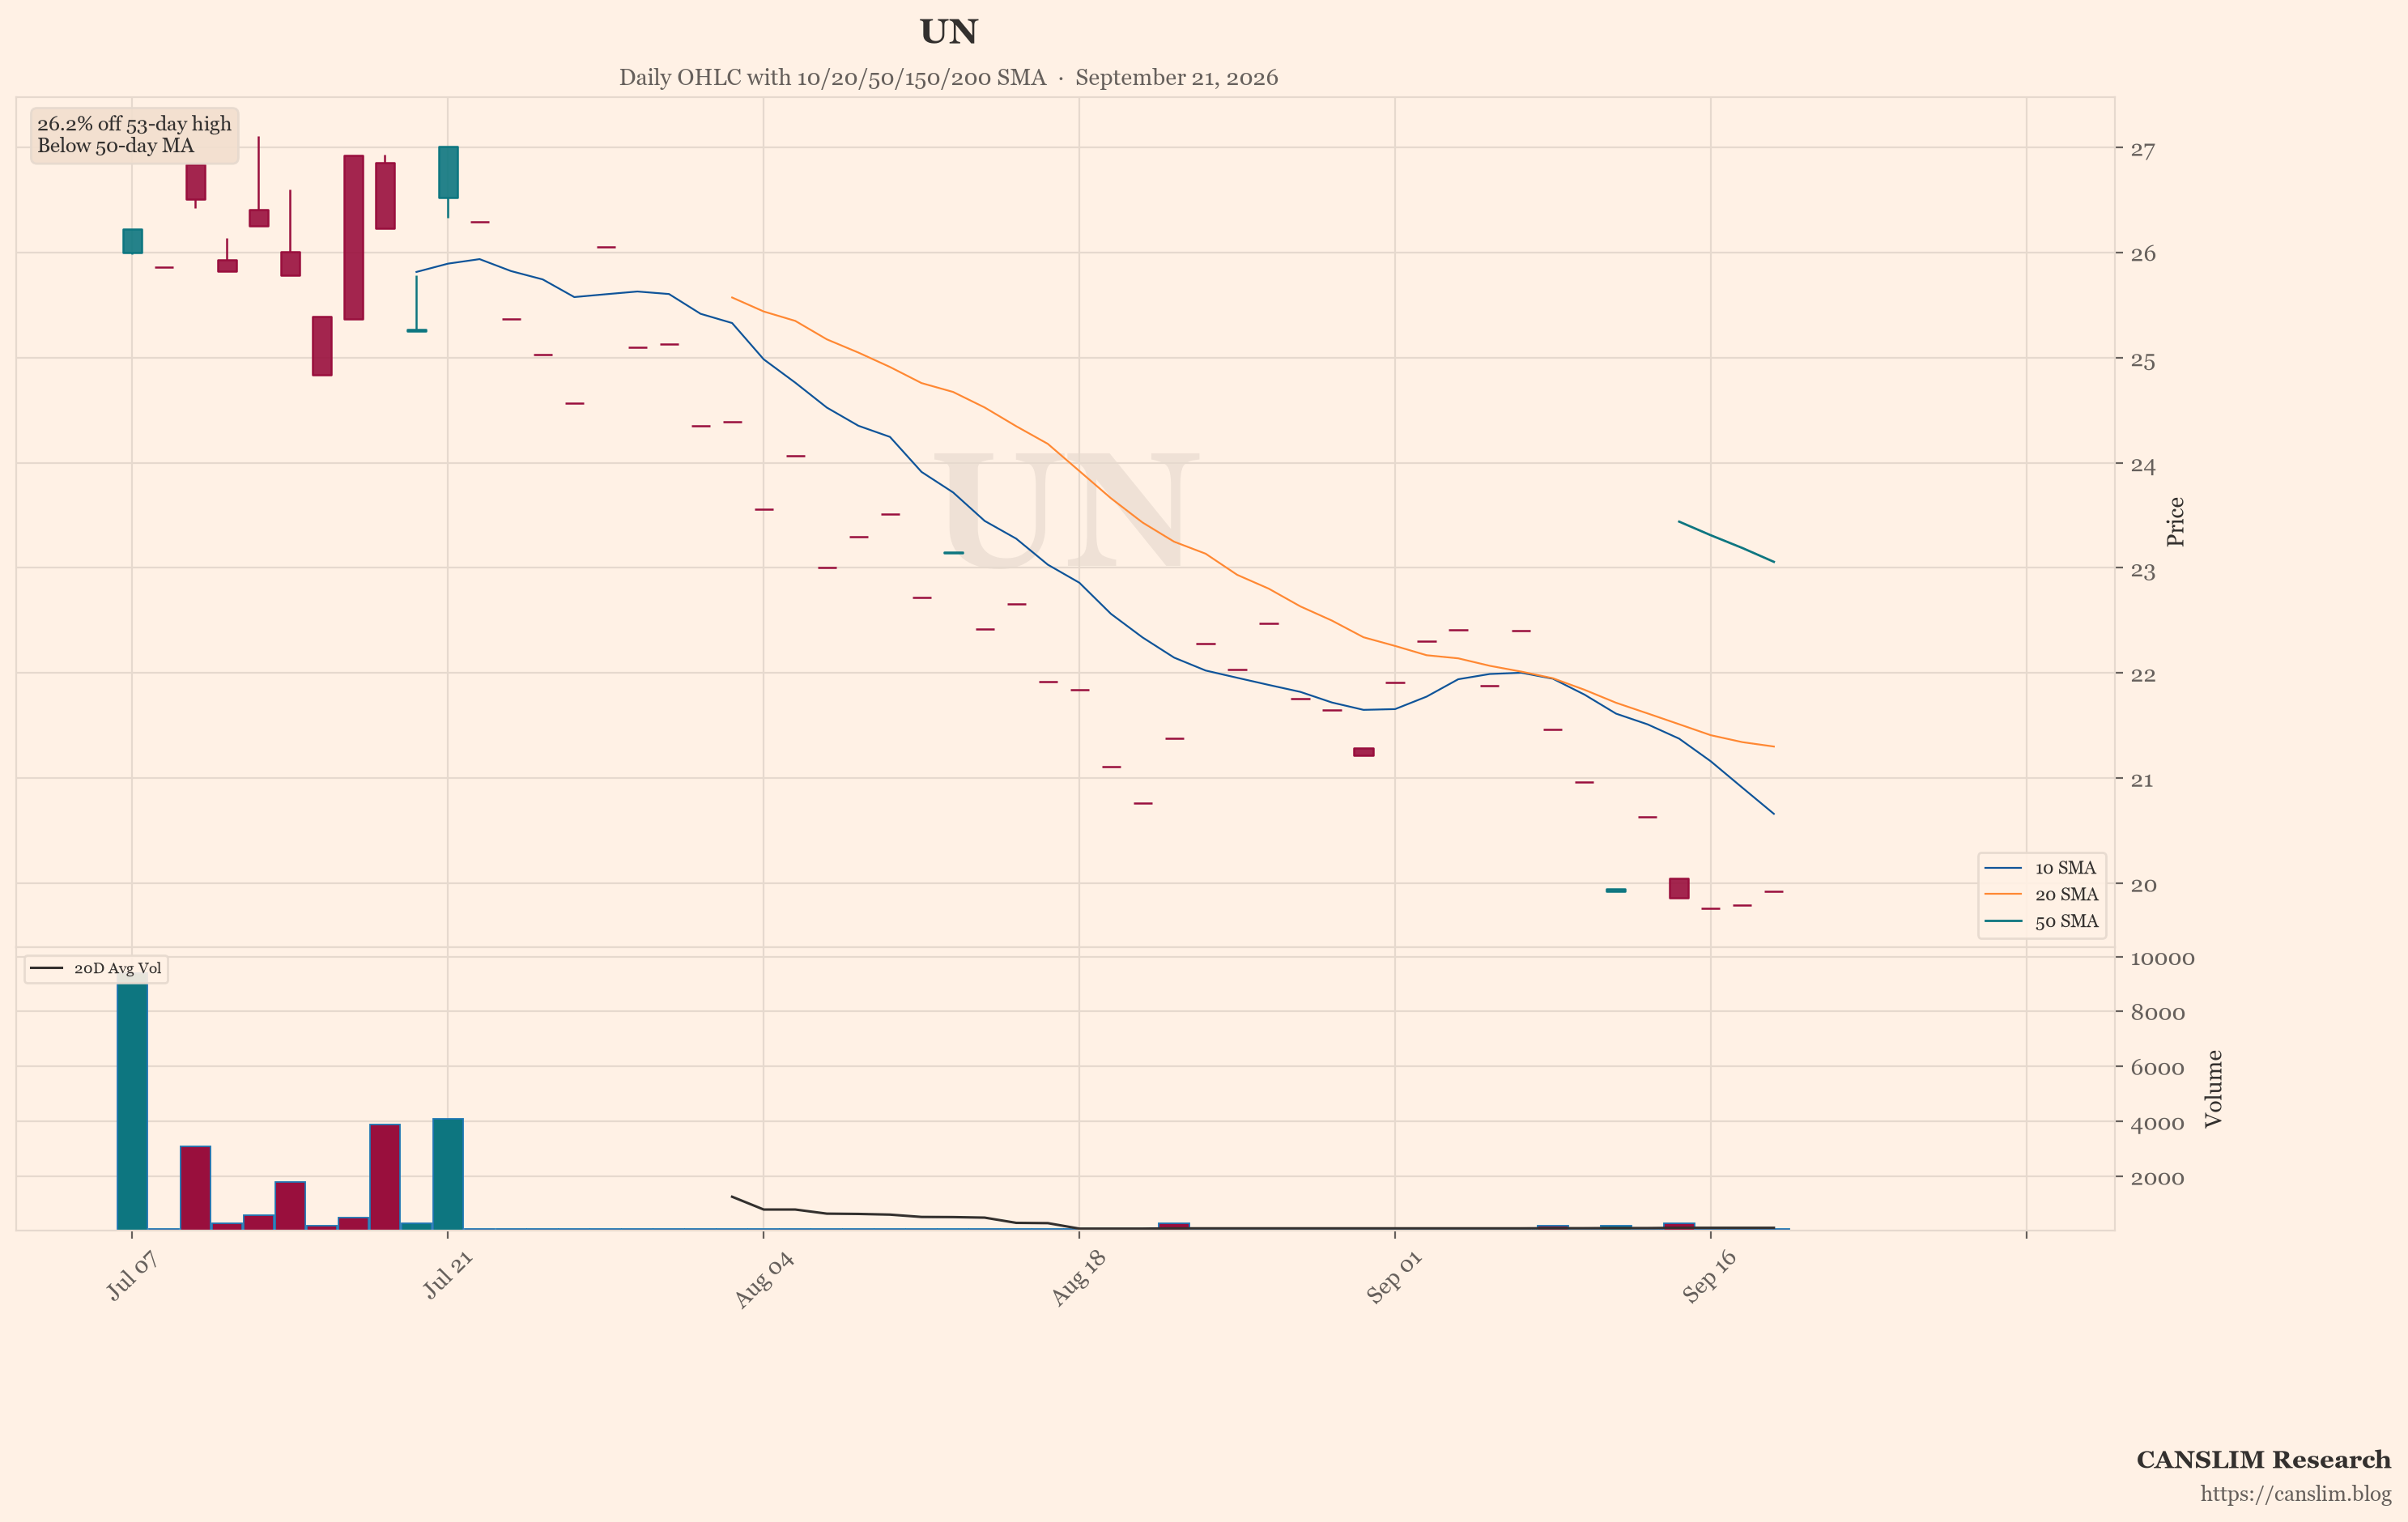
The featured chart is UN, and it shows the weakest technical pattern in the group. While memory chips and AI names break out, UN lags badly. That contrast matters. In a healthy market, leadership broadens. Here, it narrows to a handful of themes. Rising yields near 5% pressure high-growth and leveraged names. AI infrastructure costs are climbing. Negative free cash flow is common. Profitability now matters more than headline demand. South Korea's chip boom could free up big corporate cash, but only if it comes home.
Leaders Still Lead, but the Ice Is Thin
The AI theme is not dead. It is just getting pickier. MU, AMD and SNDK still act well. The S&P 500 still holds. But weak breadth, record fuel costs and 5% yields are real headwinds. The crowd is euphoric. That is often a warning, not a signal. Stay with true leaders. Demand strong volume and tight bases. Cut names that break support. The index may melt up from here. It may also crack. Either way, discipline beats conviction right now.
Sources: market news brief & global social sentiment data. Updated 2026-09-21 14:00 HKT. For educational purposes only — not investment advice.
Discover more from CANSLIM Research
Subscribe to get the latest posts sent to your email.