 Andrew
General educational commentary only, generated automatically with AI. Not investment advice or a recommendation to buy, sell or hold any security. Capital is at risk.
Nasdaq Sets Record While Treasury Yields Reach Multi-Year Highs
U.S. stocks rose to fresh highs on Monday, according to the news brief. Megacap technology and AI shares led the move. The Nasdaq set another record. The S&P 500 moved closer to its own peak. This happened even as Treasury yields climbed to their highest levels since 2002.
The 30-year Treasury yield reached 5.70% on Monday, per the social sentiment report. The 10-year yield reached 5.34%. The news brief notes the 10-year hit a level not seen since 2002. Higher yields can raise borrowing costs and pressure stock valuations.
Weak Jobs Data and Cooler Inflation Briefly Ease Bond Pressure
The news brief reports that September hiring was much weaker than expected. Payrolls rose by 29,000 versus a 84,000 forecast. Unemployment edged up to 4.2%. Earlier job counts were revised down by 60,000. Core inflation came in cooler than expected.
These figures briefly eased pressure on bonds. But they did not end the broader bond-market selloff. The news brief describes this as a contrast: a narrow group of large technology stocks is carrying indexes, while higher borrowing costs weigh on much of the market.
Energy and Technology Lead as Other Sectors Lag
Only two S&P 500 sectors are beating the index's 12.8% year-to-date gain, according to the news brief. Energy is up 40.4%. Technology is up 30.2%. This highlights how concentrated leadership remains.
The social sentiment report, which comes from unverified posts by anonymous retail users online and may include rumour or speculation, describes a different mood. It says online sentiment was almost uniformly bullish after hours. Posts mocked bears and called QQQ a safe-haven asset. Some circulated price targets for SPY. A few bearish voices noted that equal-weight indexes and small caps remained below their highs. One reading is that the gap between headline index gains and broader participation is a theme in both the news and the online discussion.
Corporate Bond Volatility Rises as Credit Risk Is Reassessed
The news brief reports that corporate bond volatility has jumped sharply from recent lows. This may suggest investors are reassessing credit risk even as stocks hold up. The social sentiment report notes that TLT closed down 0.48%, with the stock-bond divergence continuing to widen.
The news brief lists several near-term tests. These include Treasury yields, upcoming U.S. trade data, the Fed's meeting minutes, and the start of third-quarter earnings season. The social sentiment report mentions that August trade data is due Tuesday at 8:30, and the September FOMC meeting minutes are due Wednesday at 14:00.
Chart Screen Flags Dow Jones Weakness on Several Measures
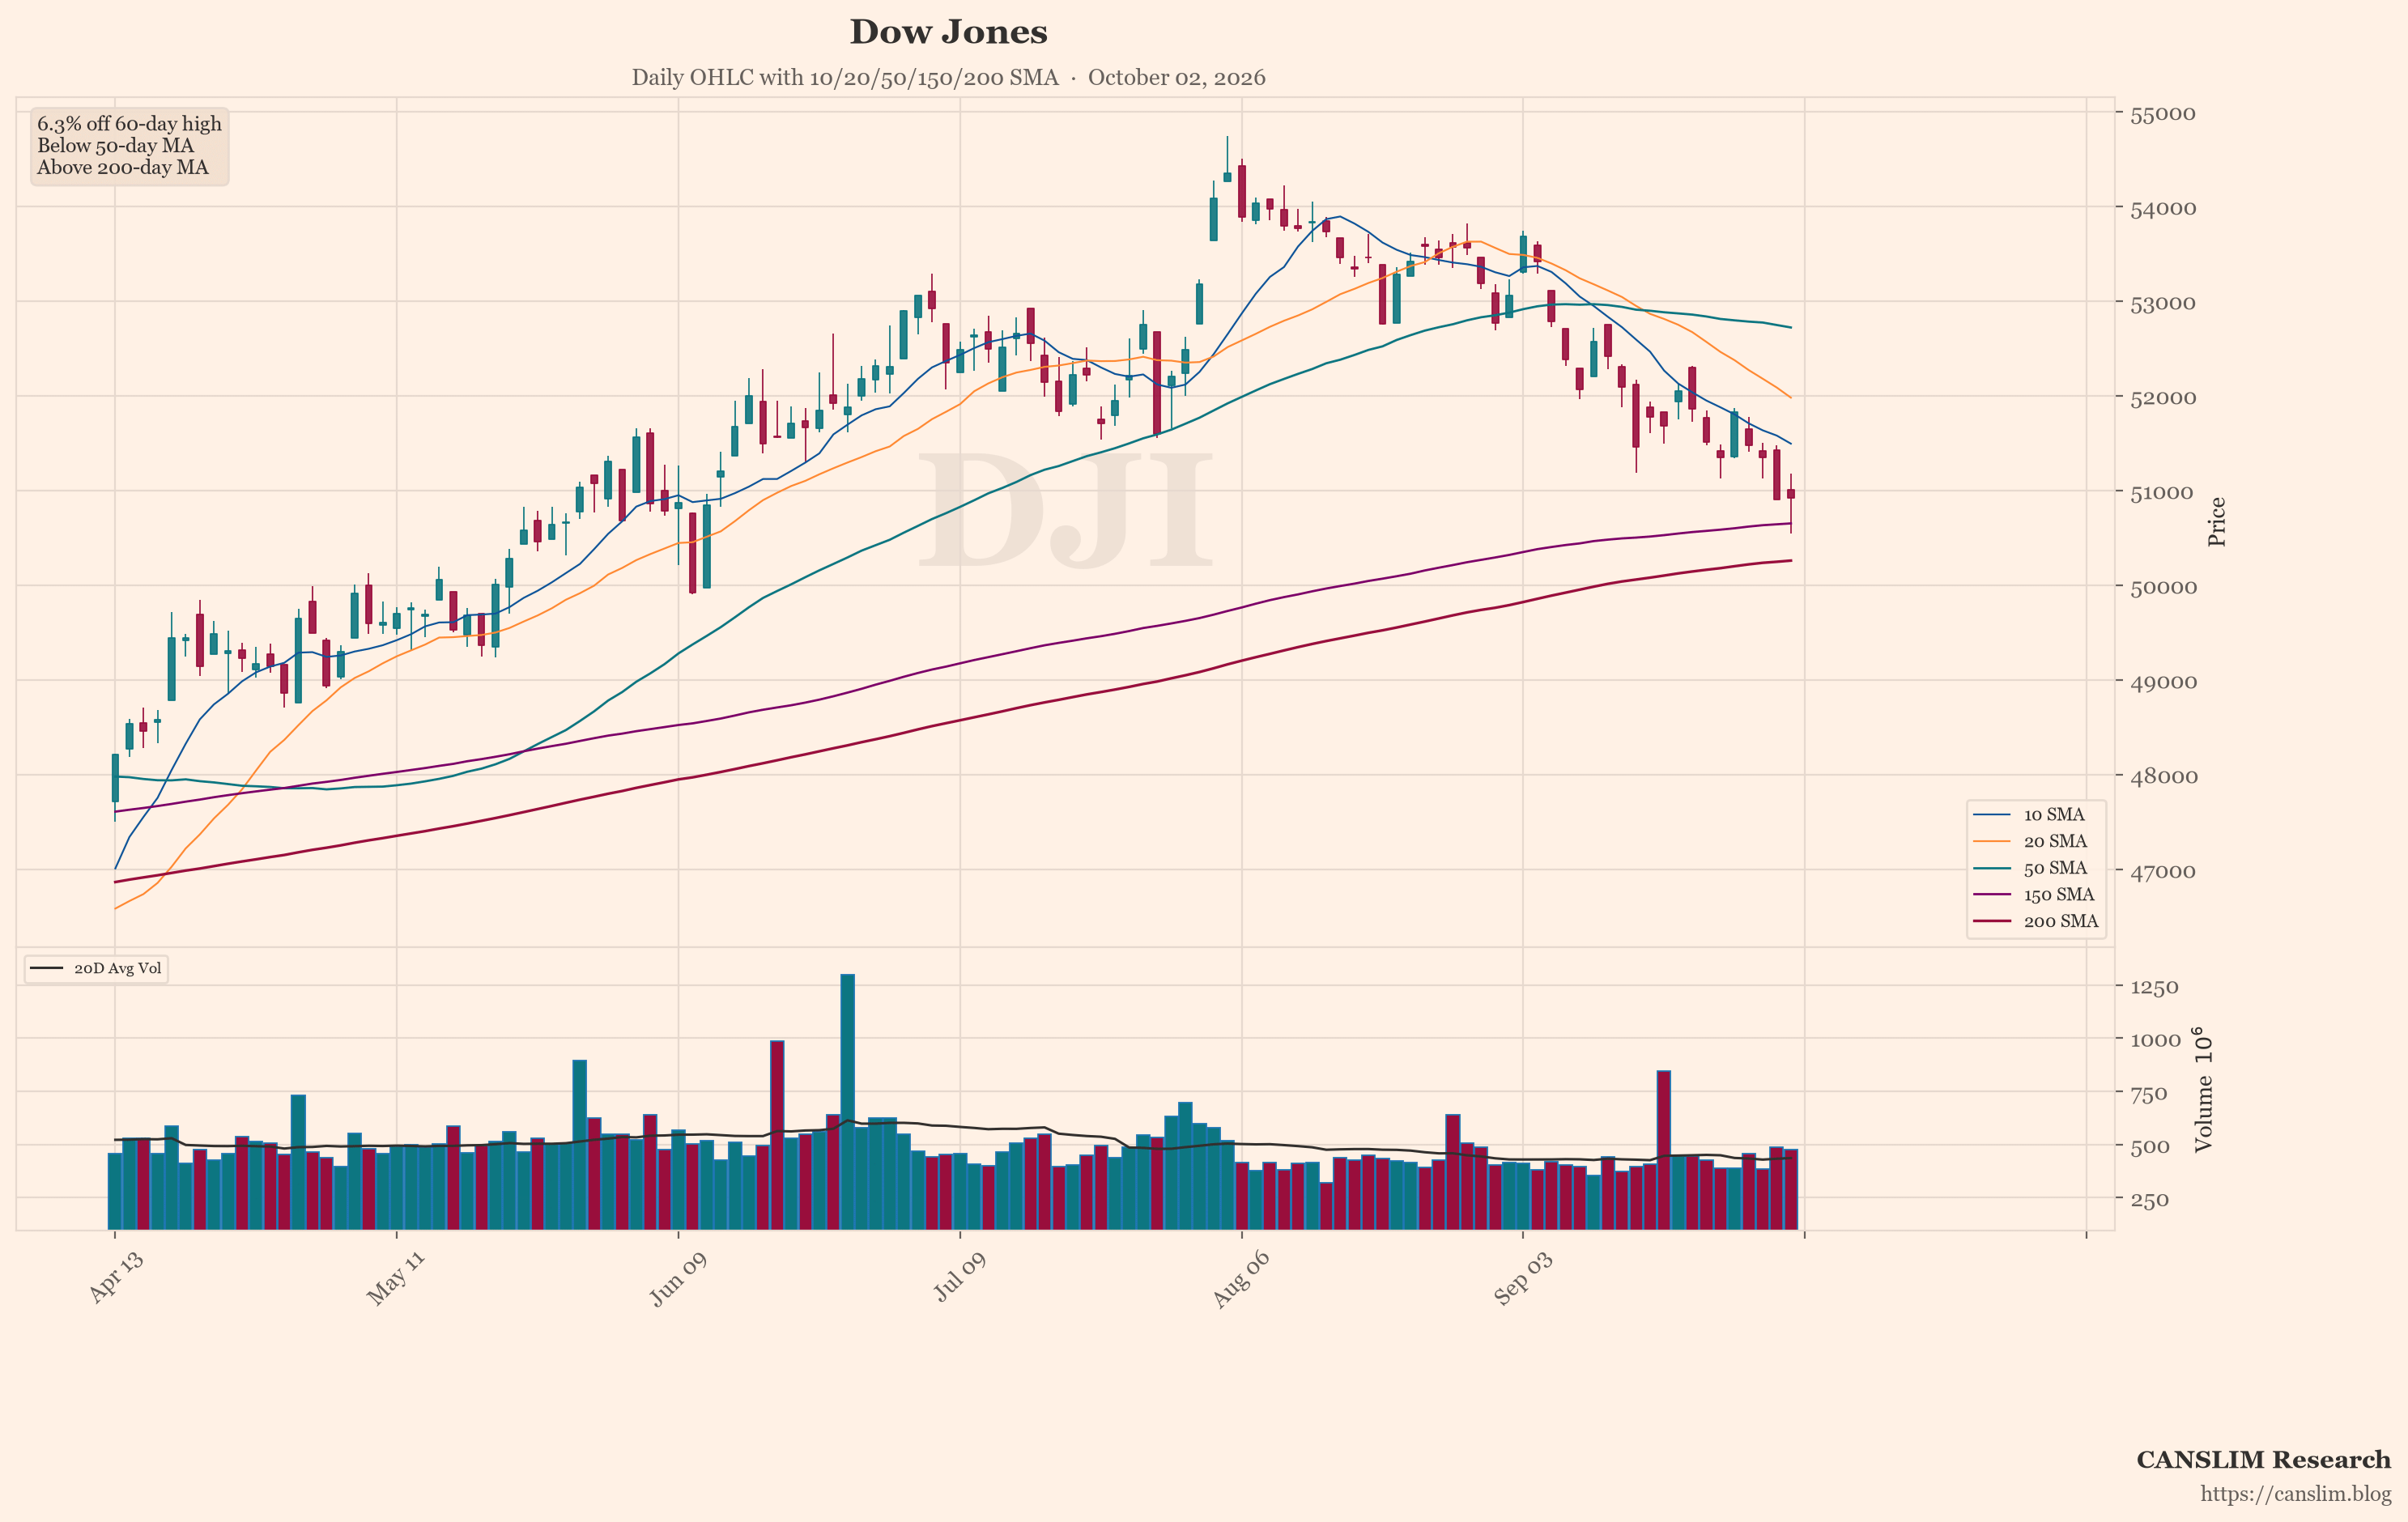
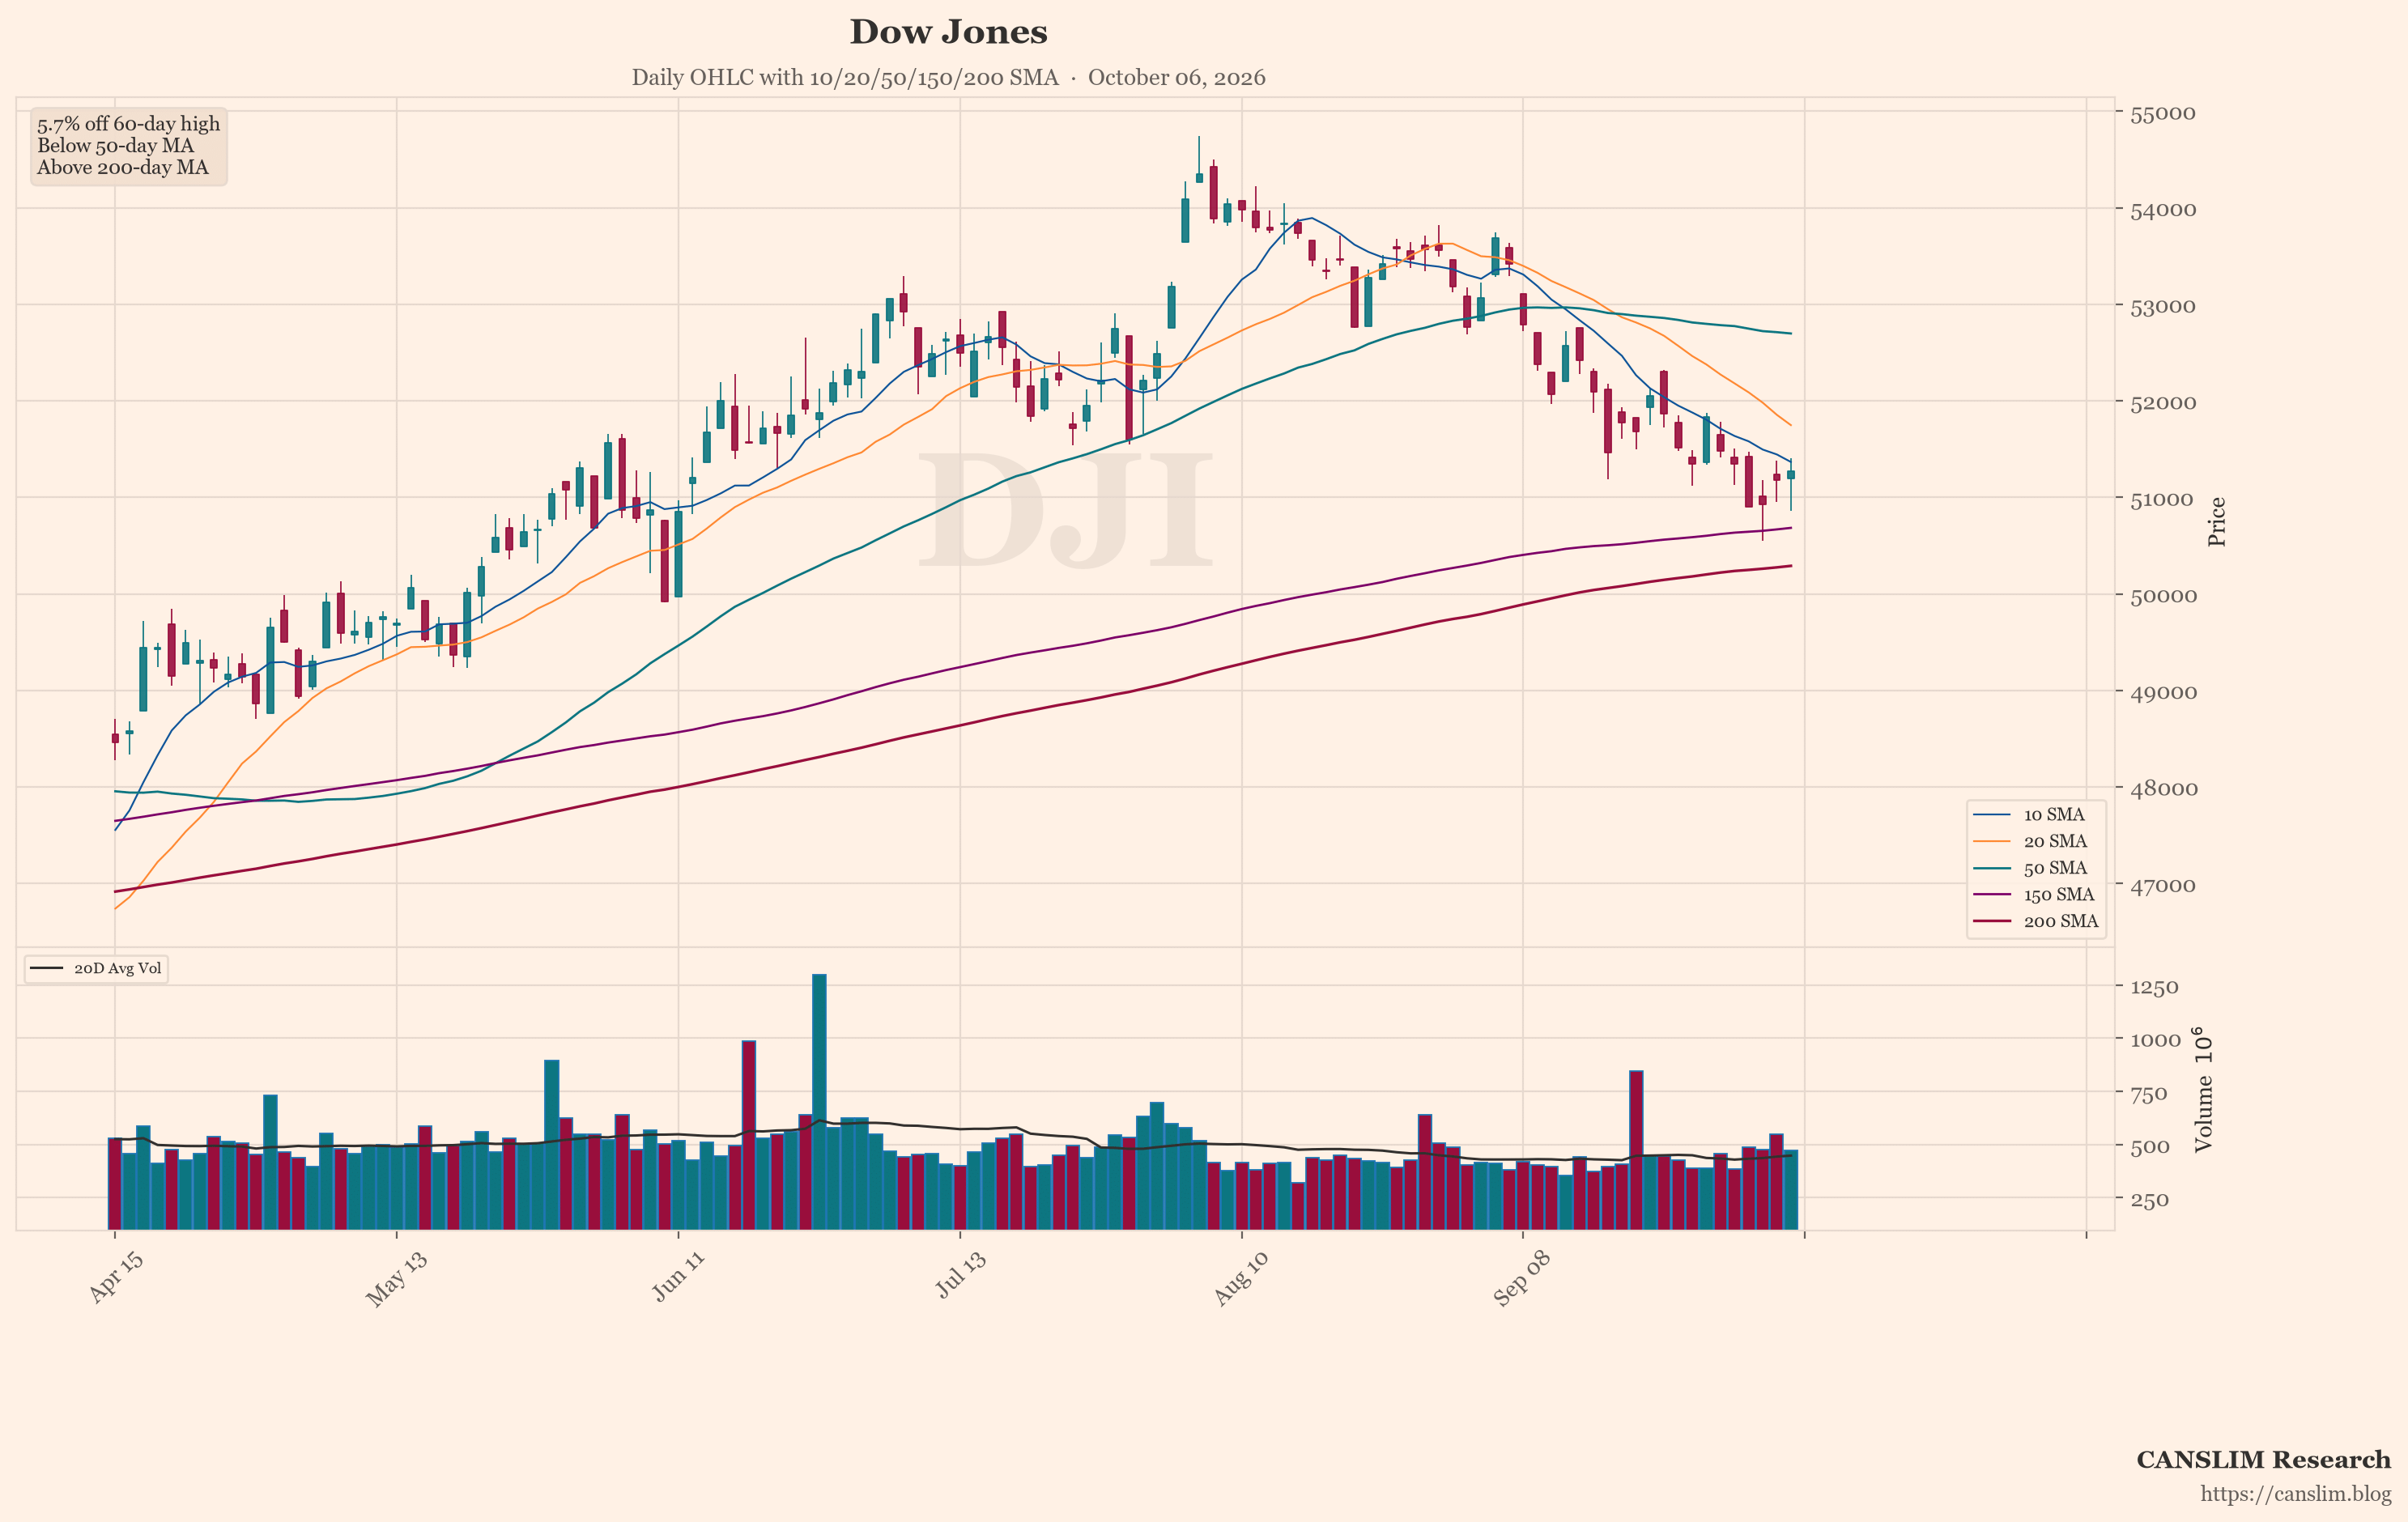
The featured chart shows the Dow Jones (^DJI). An automated technical screen picked it because, among the indices and stocks it checked, it showed the most weakness on a few measures. These include distance from its recent high, position versus its 50-day and 200-day moving averages, and down days on higher volume. One screen is not a full view. Past price patterns do not predict future results.
Narrow Leadership and Rising Yields Remain the Central Tension
The news brief describes a resilient rally with warning signs beneath the headline gains. Weak participation leaves the market more exposed if yields keep rising or AI leaders lose momentum. The social sentiment report, based on unverified anonymous posts, shows a fear/greed level near 78/100, leaning toward greed. It also notes that few genuine bearish views were offered.
The main uncertainty is whether earnings can support stock prices and whether leadership can broaden. Higher borrowing costs, concentrated gains, and rising credit volatility are all factors that could change the current picture. The sources do not agree on how long the divergence between stocks and bonds can last.
Sources: a third-party AI-generated market news summary, and an AI summary of unverified posts by anonymous retail users online. This article was written by an AI language model from those summaries and published automatically without human review. Updated 2026-10-06 14:00 HKT.
CANSLIM Research (canslim.blog) is an independent educational publisher. It is not licensed or registered as a broker, investment adviser, research analyst or asset manager in any jurisdiction. This article is general information for education only. It is not investment advice, a research report, an investment recommendation, or an offer or solicitation to buy or sell any security, and it does not consider any reader's objectives, financial situation or needs. No ticker, chart, heading or technical comment is a suggestion to buy, sell, hold or short. Figures come from third-party sources, are not independently verified, and may be incomplete, out of date or wrong. Online sentiment may include rumour, speculation or coordinated posting. Past performance and past price patterns do not predict future results. Investing involves risk, including the loss of capital. This article is not updated after publication. Laws differ by country; seek advice from a licensed professional in your jurisdiction before making any investment decision.
Discover more from CANSLIM Research
Subscribe to get the latest posts sent to your email.