 Andrew
General educational commentary only, generated automatically with AI. Not investment advice or a recommendation to buy, sell or hold any security. Capital is at risk.
Megacap Tech Lifts Indexes to New Highs
U.S. stocks rose on Monday. Demand for AI and other megacap technology shares outweighed pressure from rising bond yields. The Nasdaq set a record, and the S&P 500 moved closer to one, according to the news brief. A megacap gauge rose 1.3%. The Wall Street Journal described the session as stocks rising while AI bets offset bond yield fears. Bloomberg framed it as a tech lift despite renewed bond losses.
Breadth Stays Thin beneath the Headline Indexes
The advance remains narrow. Many stocks are weaker, and the Dow has struggled. Several market analyses flag poor breadth. More than half of S&P 500 constituents sit below their 200-day moving averages, per the brief. Barron's called it a tale of two markets: mega-caps keep climbing while rate fears hit many other stocks. One reading is that index strength looks less reassuring than the headline numbers suggest. This may indicate participation is concentrated rather than broad.
Yields and Credit Strain Draw Attention
Global yields are rising amid inflation concerns and expectations for tighter Fed policy. The 30-year municipal yield topped 5%, its highest level since at least 2011, per Bloomberg. The brief also notes multifamily commercial mortgage delinquencies above 8%. Seeking Alpha described credit markets as signaling a reckoning ahead. Rising yields make bonds more competitive and raise financing costs. The main risk cited is that higher borrowing costs keep spreading beyond bonds. Whether that pressure reaches equities more heavily is uncertain.
Services Expand While Oil Prices Fall
September services activity continued to expand. The ISM index eased to 54.9 from 55.4, according to the Wall Street Journal. Oil prices fell on signs that supply is moving through the Strait of Hormuz. FXEmpire linked the drop to Saudi Aramco cutting prices for Asian buyers. The brief calls this a potential relief for inflation if the decline holds. Investors now await Wednesday's Fed minutes and upcoming inflation data. Those events could shift rate expectations and test the rally.
Online Sentiment Splits after a Late Selloff
Online sentiment comes from unverified posts by anonymous retail users. It may include rumour or speculation and has not been checked. At the theme level, community greed ran near 7.5/10, per the social report. Bulls dominated daytime discussion around megacap technology and AI themes. A late-session, heavy-volume retreat in the S&P 500 proxy erased some gains and split after-hours talk into two camps. One camp expected another gap higher; another warned of a sharp down day. Some users argued the rally can continue because a fear gauge still showed Fear despite record highs. Others said breadth was worse than it looked. The report notes breadth was not as poor as claimed, since equal-weight and small-cap proxies gained about as much as the S&P 500 proxy. Still, many users reported green indexes and red portfolios. This is unverified and may reflect rumour.
Chart Screen Flags Weakness in CMBS
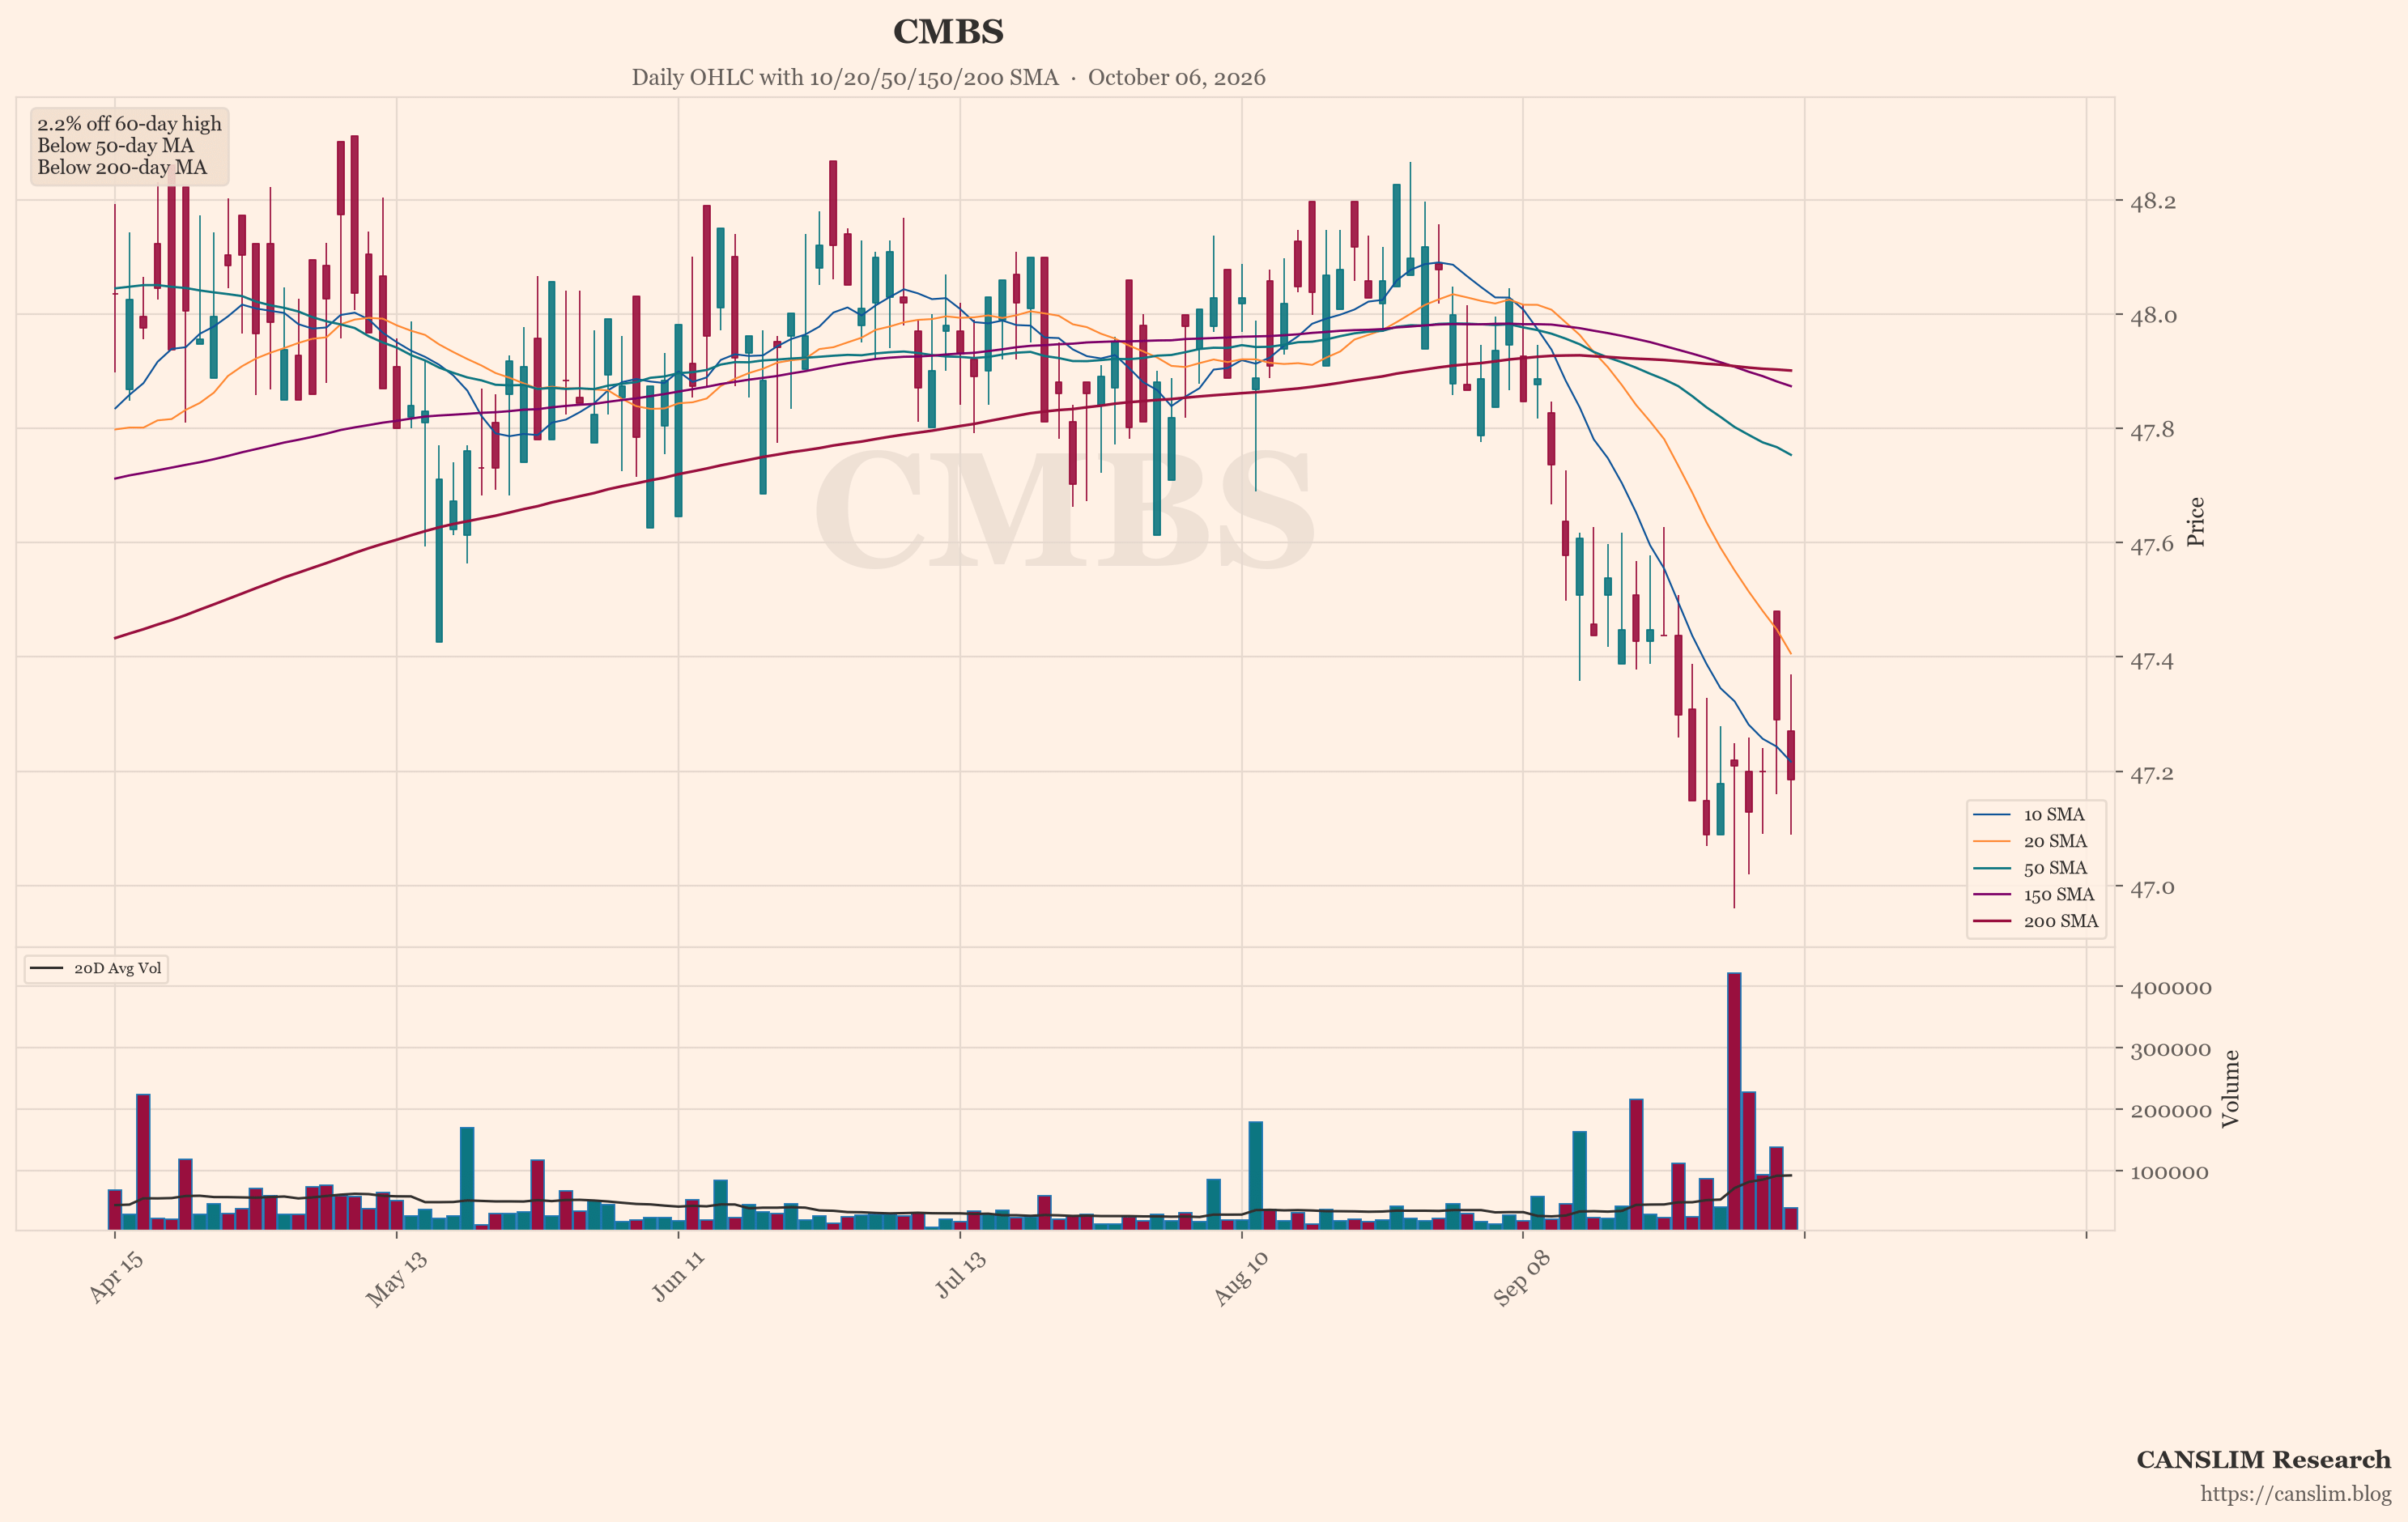
The featured chart shows CMBS. An automated technical screen picked it because, among the indices and stocks it checked, it showed the most weakness on a few measures: distance from its recent high, position versus its 50-day and 200-day moving averages, and down days on higher volume. One screen is not a full view. Past price patterns do not predict future results.
Concentrated Gains Face Rate and Credit Tests
Conditions are mixed. Megacap technology and AI themes carry the indexes, while breadth stays thin and the Dow lags. Yields are elevated, credit warnings persist, and the services sector is expanding more slowly. Oil's decline may ease inflation pressure if it holds. The next test is whether AI-led gains broaden out, or whether rising yields and credit pressure weigh more heavily on equities. That outcome is uncertain.
Sources: a third-party AI-generated market news summary, and an AI summary of unverified posts by anonymous retail users online. This article was written by an AI language model from those summaries and published automatically without human review. Updated 2026-10-06 06:00 HKT.
CANSLIM Research (canslim.blog) is an independent educational publisher. It is not licensed or registered as a broker, investment adviser, research analyst or asset manager in any jurisdiction. This article is general information for education only. It is not investment advice, a research report, an investment recommendation, or an offer or solicitation to buy or sell any security, and it does not consider any reader's objectives, financial situation or needs. No ticker, chart, heading or technical comment is a suggestion to buy, sell, hold or short. Figures come from third-party sources, are not independently verified, and may be incomplete, out of date or wrong. Online sentiment may include rumour, speculation or coordinated posting. Past performance and past price patterns do not predict future results. Investing involves risk, including the loss of capital. This article is not updated after publication. Laws differ by country; seek advice from a licensed professional in your jurisdiction before making any investment decision.
Discover more from CANSLIM Research
Subscribe to get the latest posts sent to your email.