Andrew
Key Takeaways
- Automated systems use predefined mathematical parameters to turn raw market data into plain-English research outputs.
- Frameworks include CANSLIM criteria, trend templates, stage analysis and risk and volatility flags.
- My Radar Beta is provided for research and educational purposes only and is not investment advice.
Growth investors analyzing the US market often spend significant time manually evaluating stock charts, calculating moving averages, and attempting to identify structural formations such as Volatility Contraction Patterns (VCP) or Cups with Handles. To reduce emotional bias and fatigue, automated systems like My Radar (Beta) utilize predefined mathematical parameters to process raw market data into plain-English research outputs. These platforms function as market intelligence dashboards, operating on established technical and fundamental rules.
Visualizing Systematic Screen Outputs
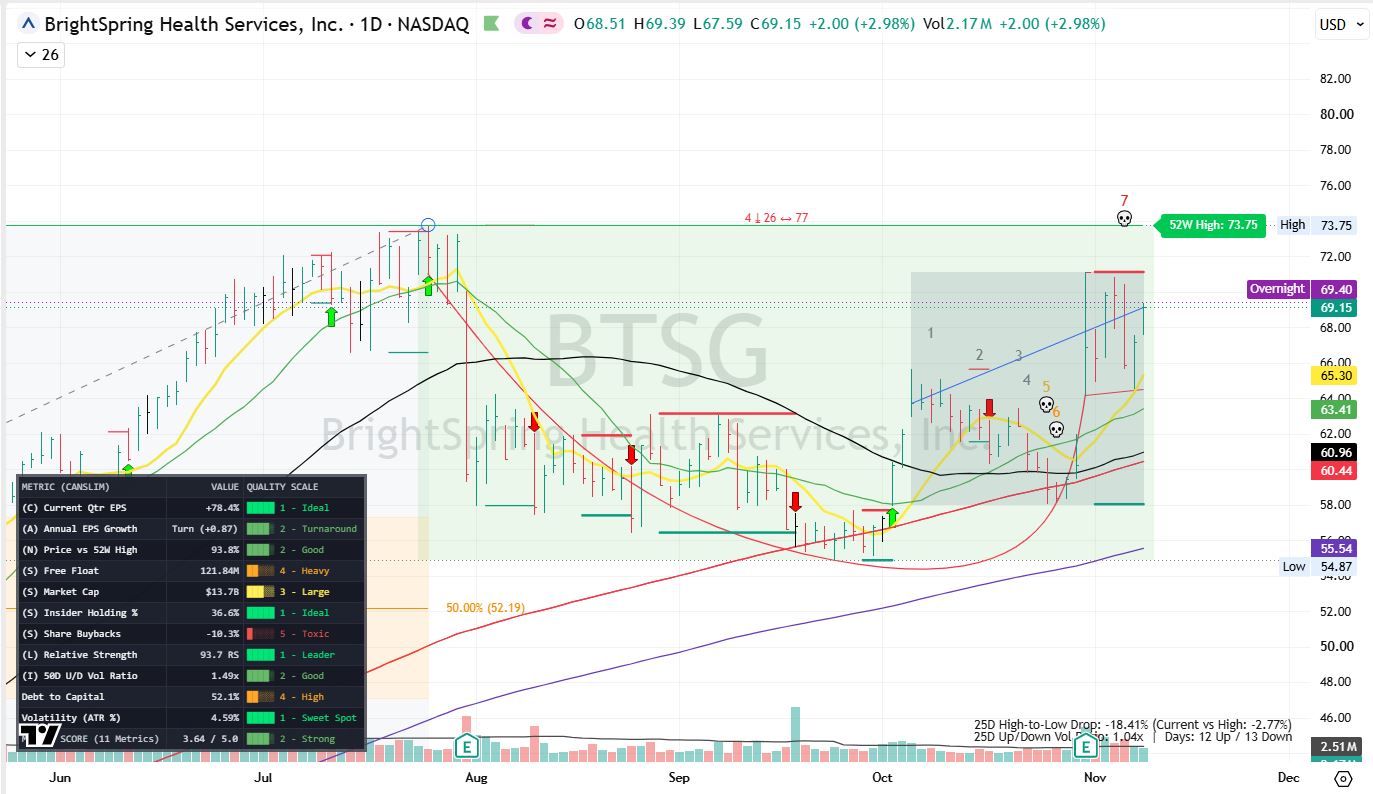
Below is an illustrative example of how automated algorithms categorize and display structural price action, specifically demonstrating a “Flat Base” consolidation pattern:
Quantitative Technical Frameworks
Automated screening replaces subjective chart reading with explicit, rule-based criteria derived from recognized US market methodologies. Systems typically evaluate equities using the following frameworks:
- CANSLIM Criteria: Evaluates stocks based on high quarterly EPS and sales growth, alongside a Relative Strength (RS) score between 80 and 99.

- Trend Templates: Screens for strict moving average alignments (MA20 > MA50 > MA200) and specific volume dry-ups.
- Stage Analysis: Utilizes 150-day and 200-day moving average slopes to mathematically categorize stocks into specific cycle phases.

- Risk & Volatility: Algorithms apply Average True Range (ATR) percentage flags and focus on US mid-cap market segmentation to filter out illiquidity.

Explore Systematic Screening with My Radar
If you are a student of the market looking to understand how algorithmic detection categorizes classic growth structures, CANSLIM Research provides a comprehensive educational testing ground. My Radar (Beta) demonstrates how explicit mathematical rules process raw market data into organized market breadth insights and pattern watchlists.
To interactively explore these systematic screening concepts, evaluate market breadth metrics, and study developing pattern structures in real-time, click below:
Explore Educational Dashboard on My RadarPlease note: My Radar Beta is provided for research and educational purposes only. Results are calculated by impersonal, rule-based algorithms and do not constitute financial advice or trade recommendations.
Frequently Asked Questions
What Frameworks Do Automated Screening Systems Use?
The page lists CANSLIM criteria, trend templates, stage analysis and risk and volatility measures such as ATR percentage flags.
What Does the Illustrative Example Show?
It shows how automated algorithms categorize and display a Flat Base consolidation pattern, marked as an illustrative example and not a live result.