 Andrew
Momentum trading relies on identifying stocks with explosive fundamentals breaking out of technical bases. William O’Neil’s CANSLIM methodology is the gold standard for this approach, but manually tracking earnings growth, float, and relative strength across hundreds of tickers is tedious.
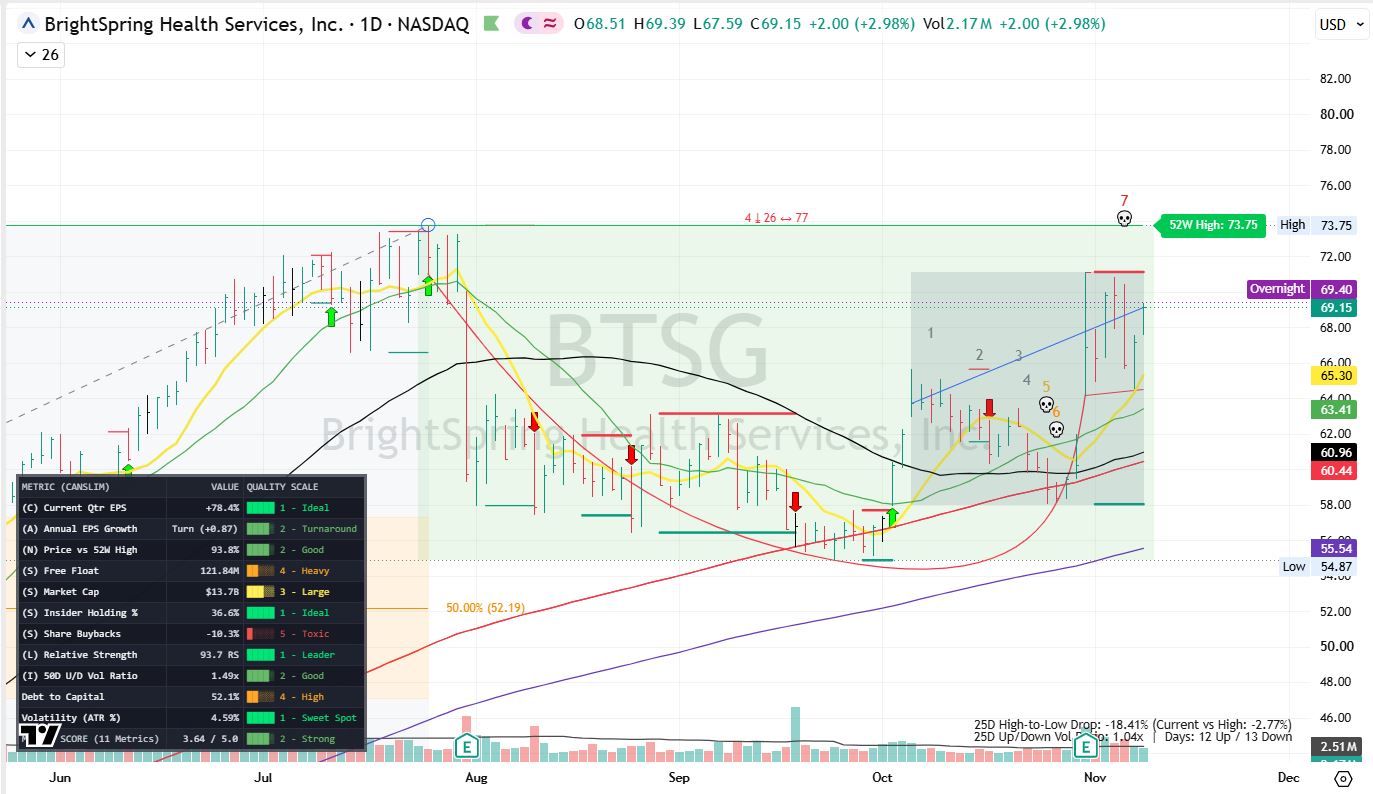
The CANSLIM Master Dashboard script automates this process directly on your TradingView charts. It acts as an objective, daily research checklist that scores a stock’s fundamental and technical health, allowing you to instantly qualify or disqualify a setup before risking capital.
The dashboard projects a visual table onto your chart, evaluating up to 11 key metrics. It does not spit out “Buy” or “Sell” labels; instead, it ranks data into strict buckets.
The 1-To-5 Quality Scale
Each row displays the raw metric (e.g., “+65% EPS”) alongside a visual bar representing its rank.
- 1 (Best): Prime momentum criteria (Green)
- 2 (Good): Strong, but slightly below ideal thresholds
- 3 (Neutral): Average or inline performance (Yellow)
- 4 (Warning): Laggard behavior (Orange)
- 5 (Weak/Failing): Actively contracting or avoiding (Red)
- N/A: Missing history, or a figure the script cannot confidently calculate (Grey).
The Master Score
The footer summarizes the stock with a composite Master Score out of 5.00.
- A score of 5.00 means every active row registered a perfect Rank 1.
- The score is an equal-weight average of only the rows that have valid data. If a row is N/A or manually hidden in the settings, it is excluded from the math so it doesn’t drag down the average.
Spotting CANSLIM Fundamentals
As a momentum trader, you can use the dashboard’s specific thresholds to quickly filter for the traits of historical super-performers.
1. Earnings Power (C &Amp; a)
Momentum requires fundamental fuel. The script strictly grades (C) Current Quarter EPS and (A) Annual EPS Growth.
- The Target: Rank 1 requires EPS growth of 50% or more.
- Turnarounds: If a company moves from a loss to a profit, the script flags it as a “Turnaround” and awards a Rank 2, capturing stocks exiting a fundamental trough.
- Red Flags: Negative EPS automatically earns a Rank 5, even if the loss is narrowing.
2. Supply, Demand, and Size (S &Amp; I)
Smaller supplies of shares move faster when institutional demand kicks in.
- Free Float & Market Cap: The script targets O’Neil’s preference for smaller, agile companies. A Rank 1 market cap sits between $1B and $10B, while a Rank 1 float is under 25 million shares. Mega-caps (over $100B) are ranked poorly due to sluggishness.
- Insider & Buybacks: A high insider holding (>30%) earns a Rank 1, showing management has skin in the game. Share buybacks of >5% also score top marks, as shrinking supply boosts per-share value.
- Institutional Sponsorship (I): By default, this uses a 50-day Up/Down volume ratio. A ratio of 1.5x or higher (Rank 1) shows heavy footprint accumulation by funds.
3. Trend and Volatility (N, L, &Amp; ATR)
- Price vs 52-Week High (N): Momentum stocks shouldn’t be bottom-fishing. A Rank 1 requires the stock to be trading within 5% of its 52-week high (>=95%).
- Relative Strength (L): Instead of a broad market percentile, the script uses a weighted 4-quarter price factor against a benchmark (like SPY). A score of 90+ marks a true market leader.
- Volatility (ATR%): The script tracks the 14-day ATR as a percentage of the 50-day SMA. The “Sweet Spot” (Rank 1) is 3% to 6%. Too low means the stock is dead; too high (>12%) means the base is too loose and whippy to risk trading.
Limitations and Caveats
To trade effectively with this script, you must understand its blind spots.
- Data Availability & N/A States: Relative strength and YoY earnings require about one year of daily history to calculate. Newly listed IPOs will show “N/A” for these fields until they mature.
- Corporate Actions: Share counts can be distorted by complex corporate actions (like mergers or irregular splits) that the TradingView fundamental data feed does not seamlessly adjust for. Market cap and buyback metrics rely on these share counts.
- Not a Percentile Rank: The Relative Strength (RS) score is compressed to a 1-to-99 scale based on its raw performance against the benchmark (SPY). It is not a market-wide percentile rank like IBD’s proprietary RS rating.
- Timeframe Locking: Fundamentals and volume ratios are calculated strictly on daily bars. While you can load the dashboard on a 5-minute intraday chart for precise entries, the script will intentionally pull daily figures to keep the macro perspective intact.
- Earnings Date Edges: Because the script looks back roughly 240 daily bars to find the prior year’s quarter, shifting earnings release dates can cause a print to briefly compare against the wrong neighboring quarter.