 Andrew@CANSLIM RESEARCH
Yields Ease, Stocks Breathe, But the Bond Market Isn't Buying It
Stocks closed a wild week higher. Treasury yields pulled back from recent highs. Oil prices fell on hopes that the U.S. and Iran could reopen the Strait of Hormuz. That relief trade lifted the major indexes after two weak sessions. Microsoft led the Dow. AI infrastructure names supported the Nasdaq. The move was encouraging. But it did not fix the market's core problem. Yields are still high. They keep pressure on valuations and rate-sensitive sectors.
The 10-year Treasury yield hit its highest intraday level since 2007. The 30-year reached its highest since 2004. Stocks and bonds moved in opposite directions. SPY rose 0.48% to 770.99. QQQ gained 0.48% to 744.64. DIA added 0.84%. But IWM rose just 0.15%. That narrow gap tells a story. The online crowd noticed too. Many said the bond market "isn't buying this lie." Yields did not fall with oil. That worries them.
The Junk Bond Chart Nobody Wants to Talk About
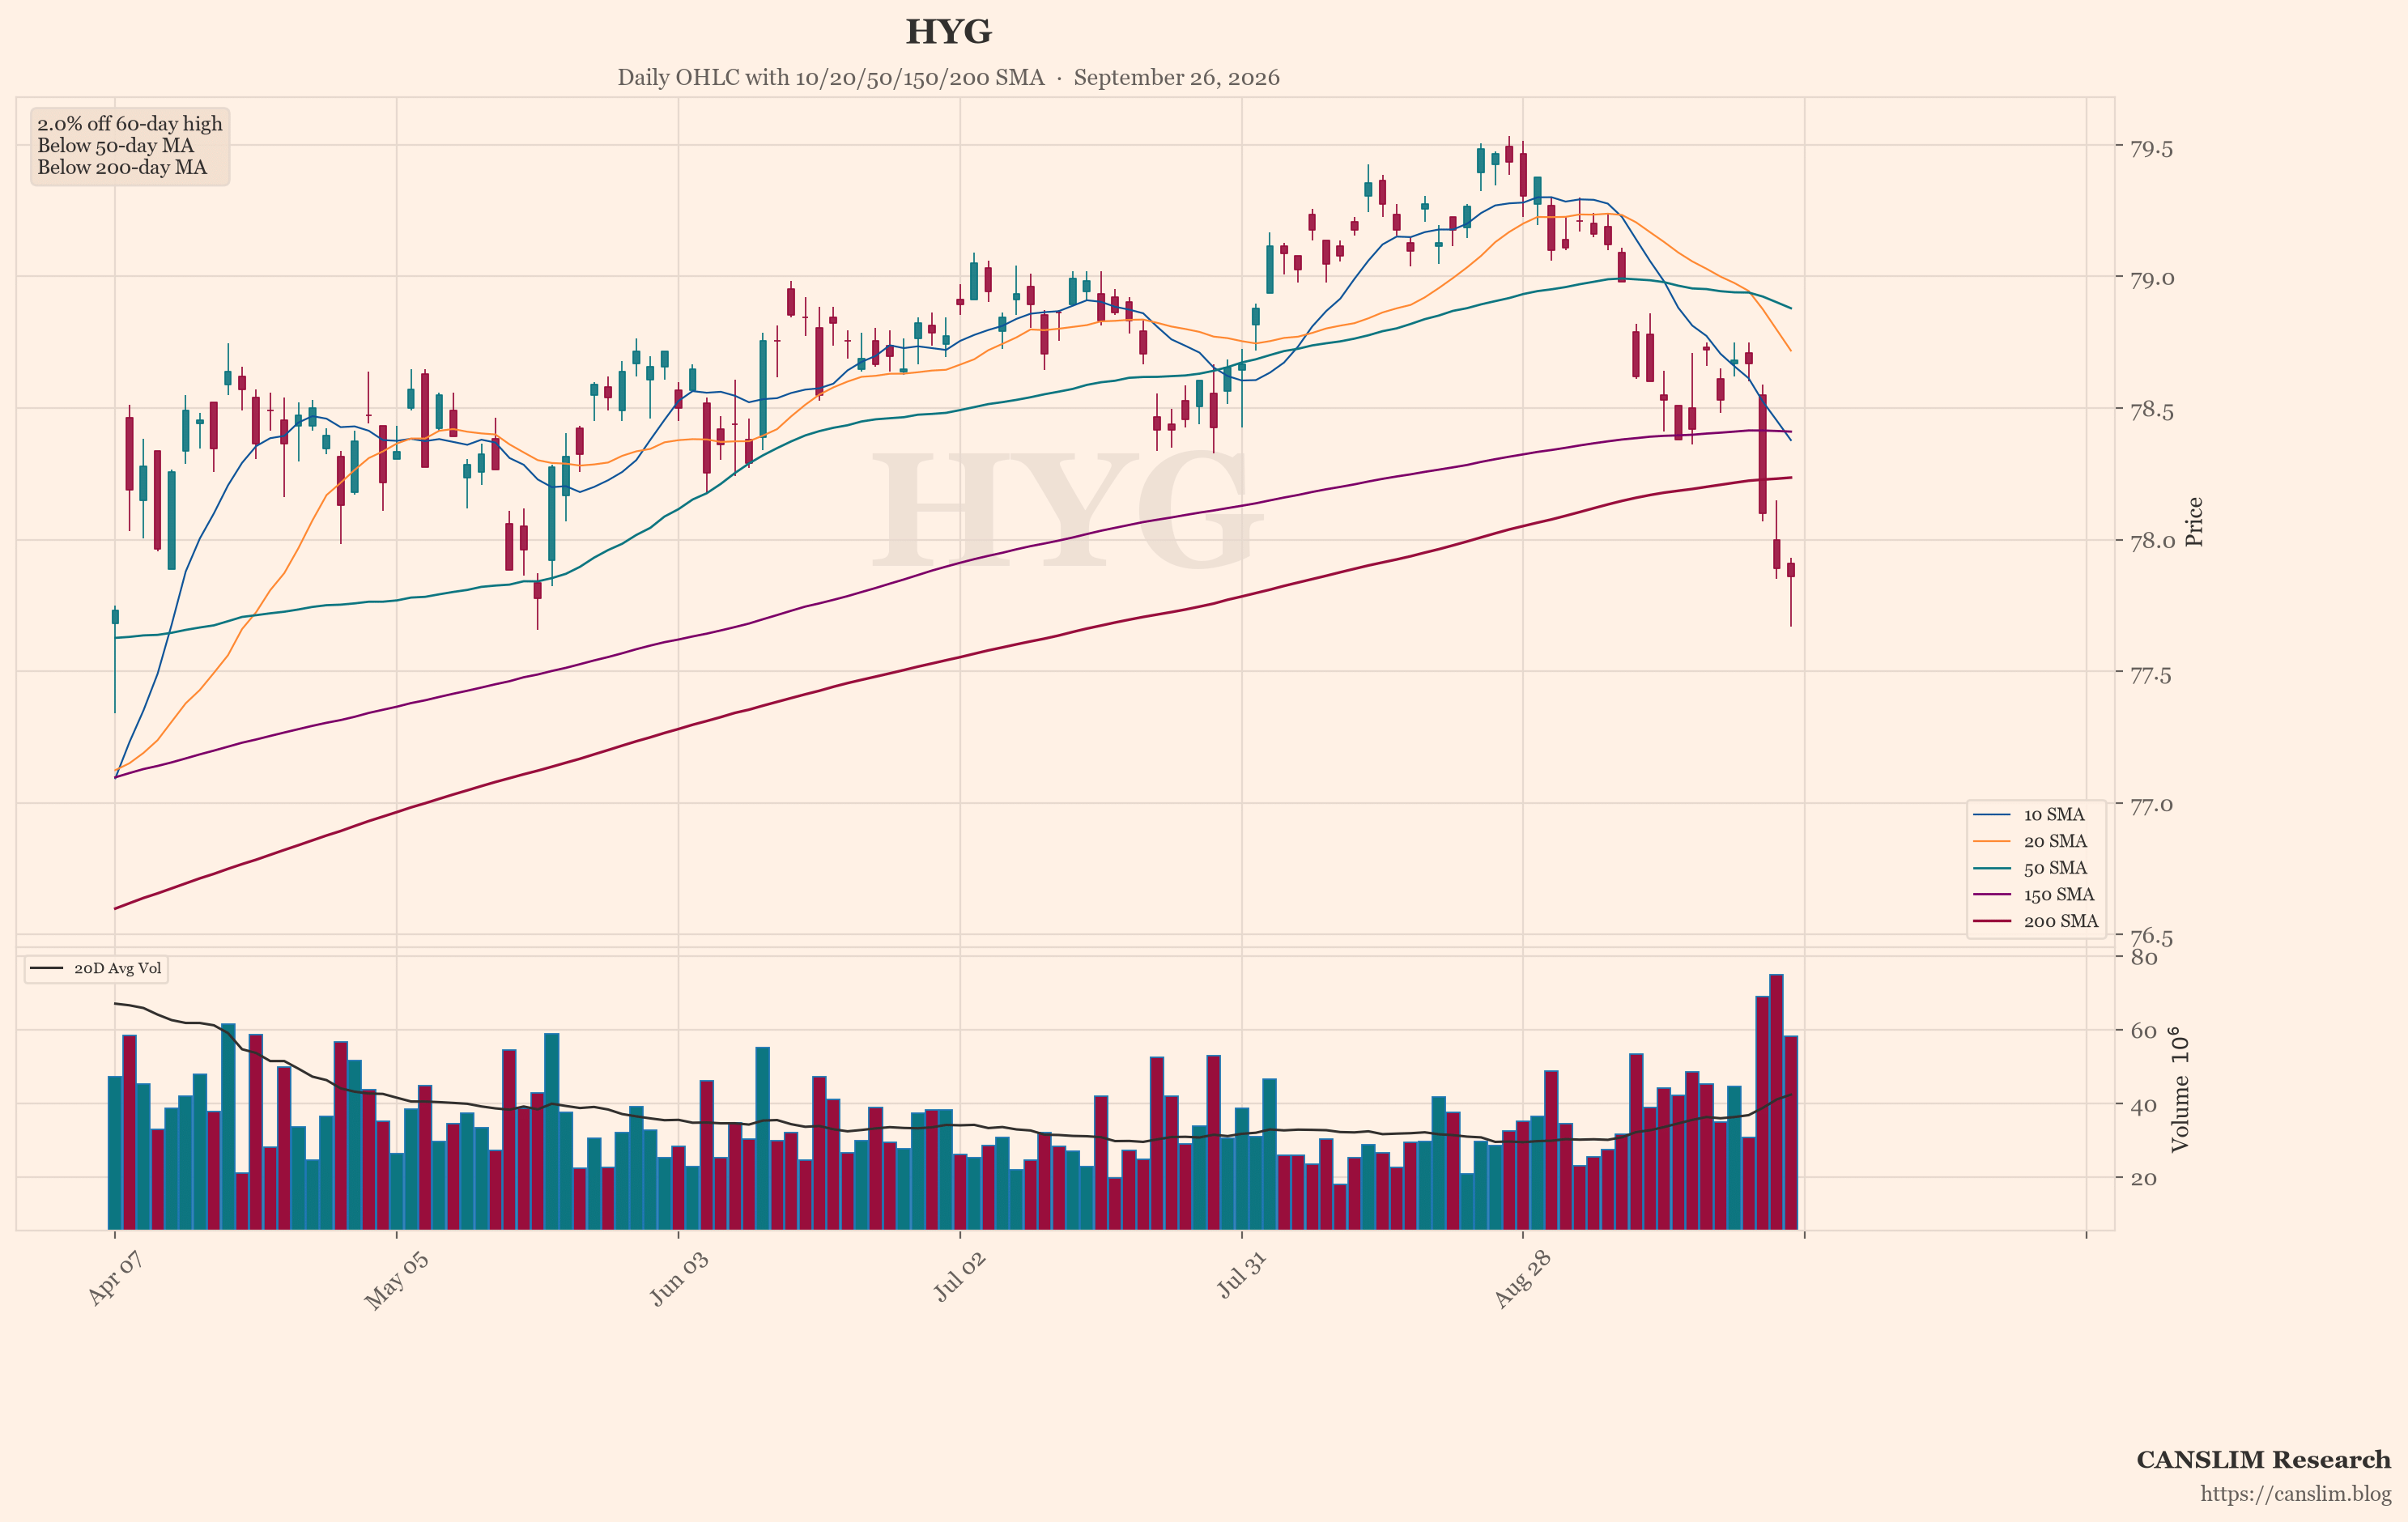
Our featured chart is HYG, the high-yield corporate bond ETF. Right now it shows the weakest technical pattern in our watchlist. HYG slipped 0.14% to 79.13. That small drop matters. Junk bonds are a risk gauge. When credit leads lower, stocks often follow. Growth investors should watch this closely. A weak HYG means credit markets are nervous. That is a yellow flag for every breakout candidate.
Microsoft Steals the Show as Meta Gives Back Gains
MSFT jumped 4.05% to 517.76. The company overhauled Copilot into three parts: Home, Code, and Autopilot. Autopilot can run tasks on its own. Oppenheimer raised its price target to 570. The online crowd loved it. Some traders saw their calls quadruple. Others bought contrarian puts. META fell 3.24% to 752.54. It had gained about 14% in five days. Some users said its new Muse product was "nothing special." Bulls and bears fought over the 750 level. A break below could open 720. This rotation shows leadership is shifting inside the AI group.
Consumer Sentiment Sours While Durable Goods Hold Firm
The data was mixed but not recessionary. Durable-goods orders were flat in August. That beat expectations for a 0.3% decline. Business demand has not rolled over. But consumer sentiment fell to 48.1 from 51.7. Higher fuel costs and borrowing rates are squeezing households. Diesel prices remain elevated. That feeds into transportation, retail, and inflation. Energy is still the biggest macro swing factor. Saudi exports held near 6 million barrels per day despite pipeline damage. Crude fell below $95 on diplomatic optimism. But supply risk is not gone.
AI Debt Worries Cast a Shadow Over Data Centers
Concerns about AI infrastructure debt grew louder. Oracle issued a force majeure notice for its Project Jupiter data center. Delayed or disrupted projects across the industry total as much as $200 billion. ORCL fell 0.82%. CRWV dropped 3.01%. Data center IPO hopefuls now face tougher scrutiny. This theme connects to HYG. If credit tightens, expensive buildouts get harder to fund. Growth names with heavy debt loads deserve extra caution.
Jobs Report and Trade Talks Set the Next Move
Next week brings the September jobs report. A strong print could raise odds of more Fed hikes. That would push yields higher again. It could restart the bond selloff. Investors also await details from U.S.-China trade talks on Monday. The Trump-Xi meeting extended the trade truce. That removes one near-term risk. But bigger issues remain unresolved. Concrete progress on Hormuz could ease oil and inflation fears. The online crowd remains bullish overall. Indexes sit less than 1% from all-time highs. Fear/Greed is near 55/100. But many retail accounts have taken a hit. The mood is numb, not excited.
Watch the Credit Tape Before You Chase the Breakout
The market recovered this week. That is good news. But the recovery rests on falling oil and a one-day yield pullback. Neither is guaranteed to last. HYG is the chart to watch. Weak junk bonds warn that credit is not confirming the stock rally. Breadth is narrow. Gains came from a handful of names like MSFT, DELL, CRDO, BE, and QCOM. Meanwhile, META, TSLA, CRWV, and NFLX fell. That is not the broad, healthy action CAN SLIM investors want. Stay selective. Demand strong volume and tight bases. Let the jobs report and the credit tape tell you when the coast is clear.
Sources: market news brief & global social sentiment data. Updated 2026-09-26 06:00 HKT. For educational purposes only — not investment advice.
Discover more from CANSLIM Research
Subscribe to get the latest posts sent to your email.