 Andrew@CANSLIM RESEARCH
The Labor Report Reshapes the Rate Debate
The August jobs report landed like a thunderclap. Employers added 162,000 positions. Unemployment held steady at 4.1%. This was more than double what many expected. Suddenly, traders priced in a real chance of a September rate hike. Stocks sold off. Treasury yields climbed higher. The data suggests the economy runs too hot for the Fed to ease anytime soon. Inflation remains sticky. The market must now reset its expectations. The old narrative of imminent cuts is dead. A new, tighter policy reality is taking shape.
Tech Leaders Stumble While Memory Stocks Surge
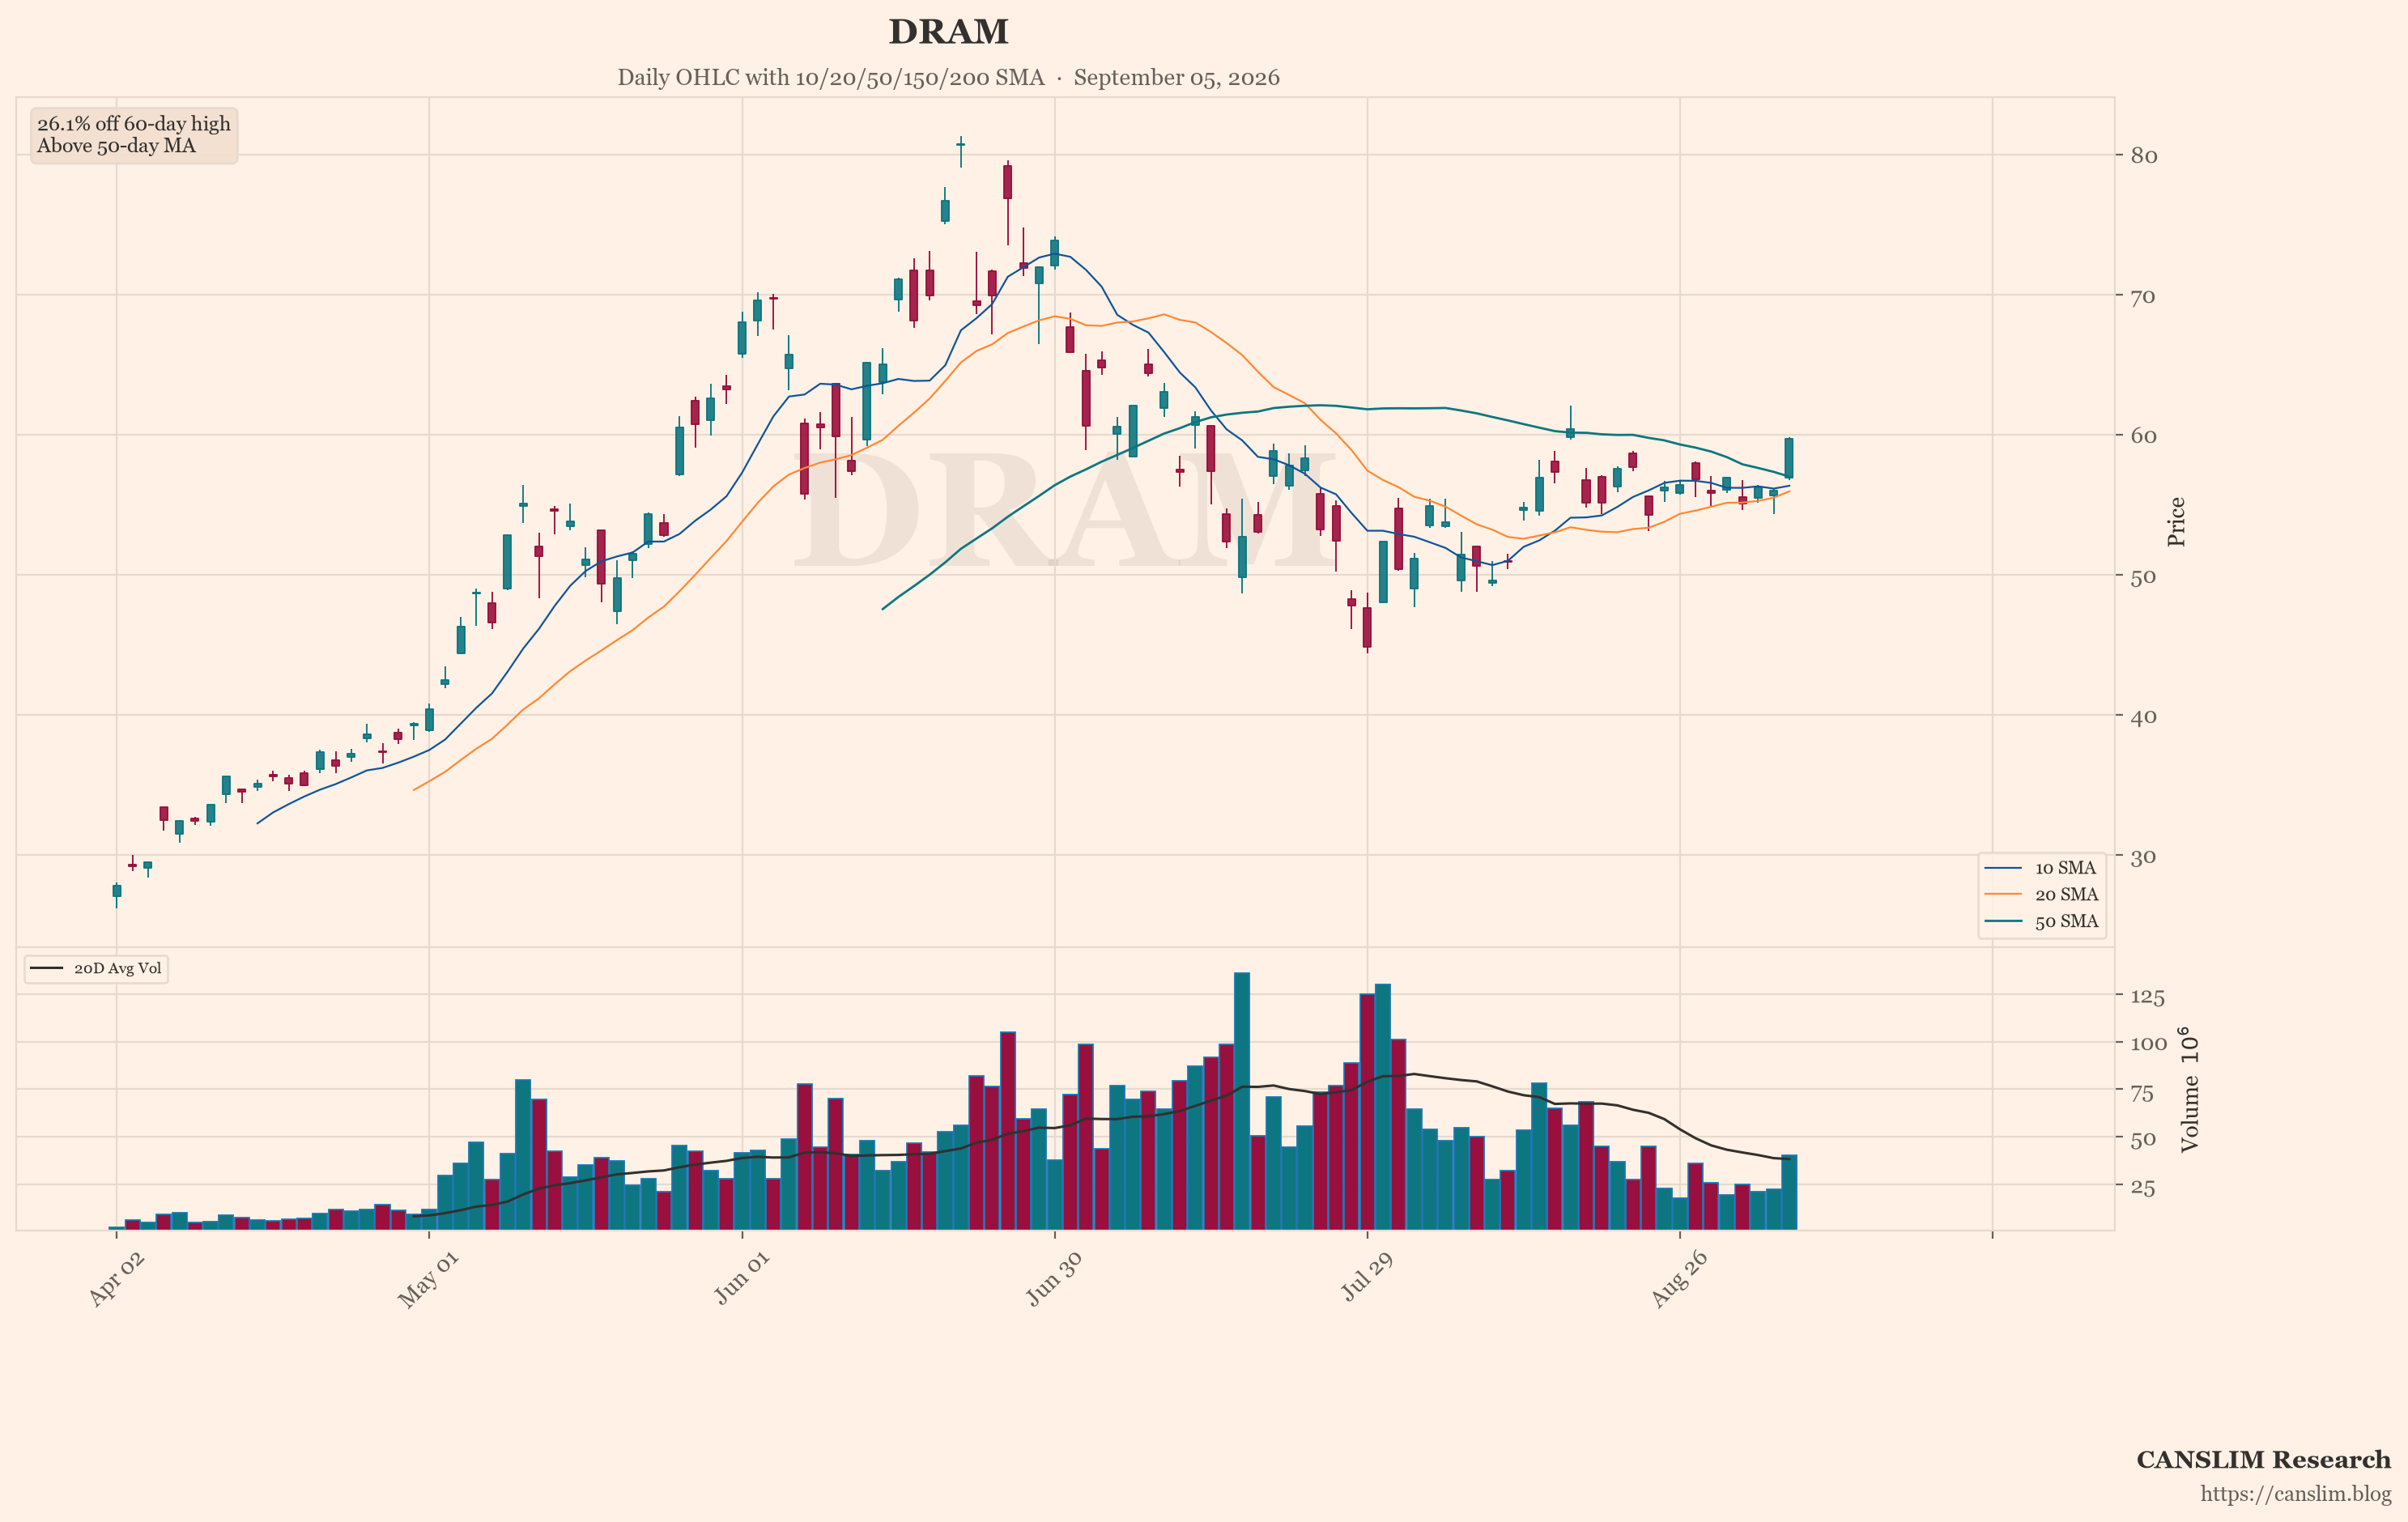
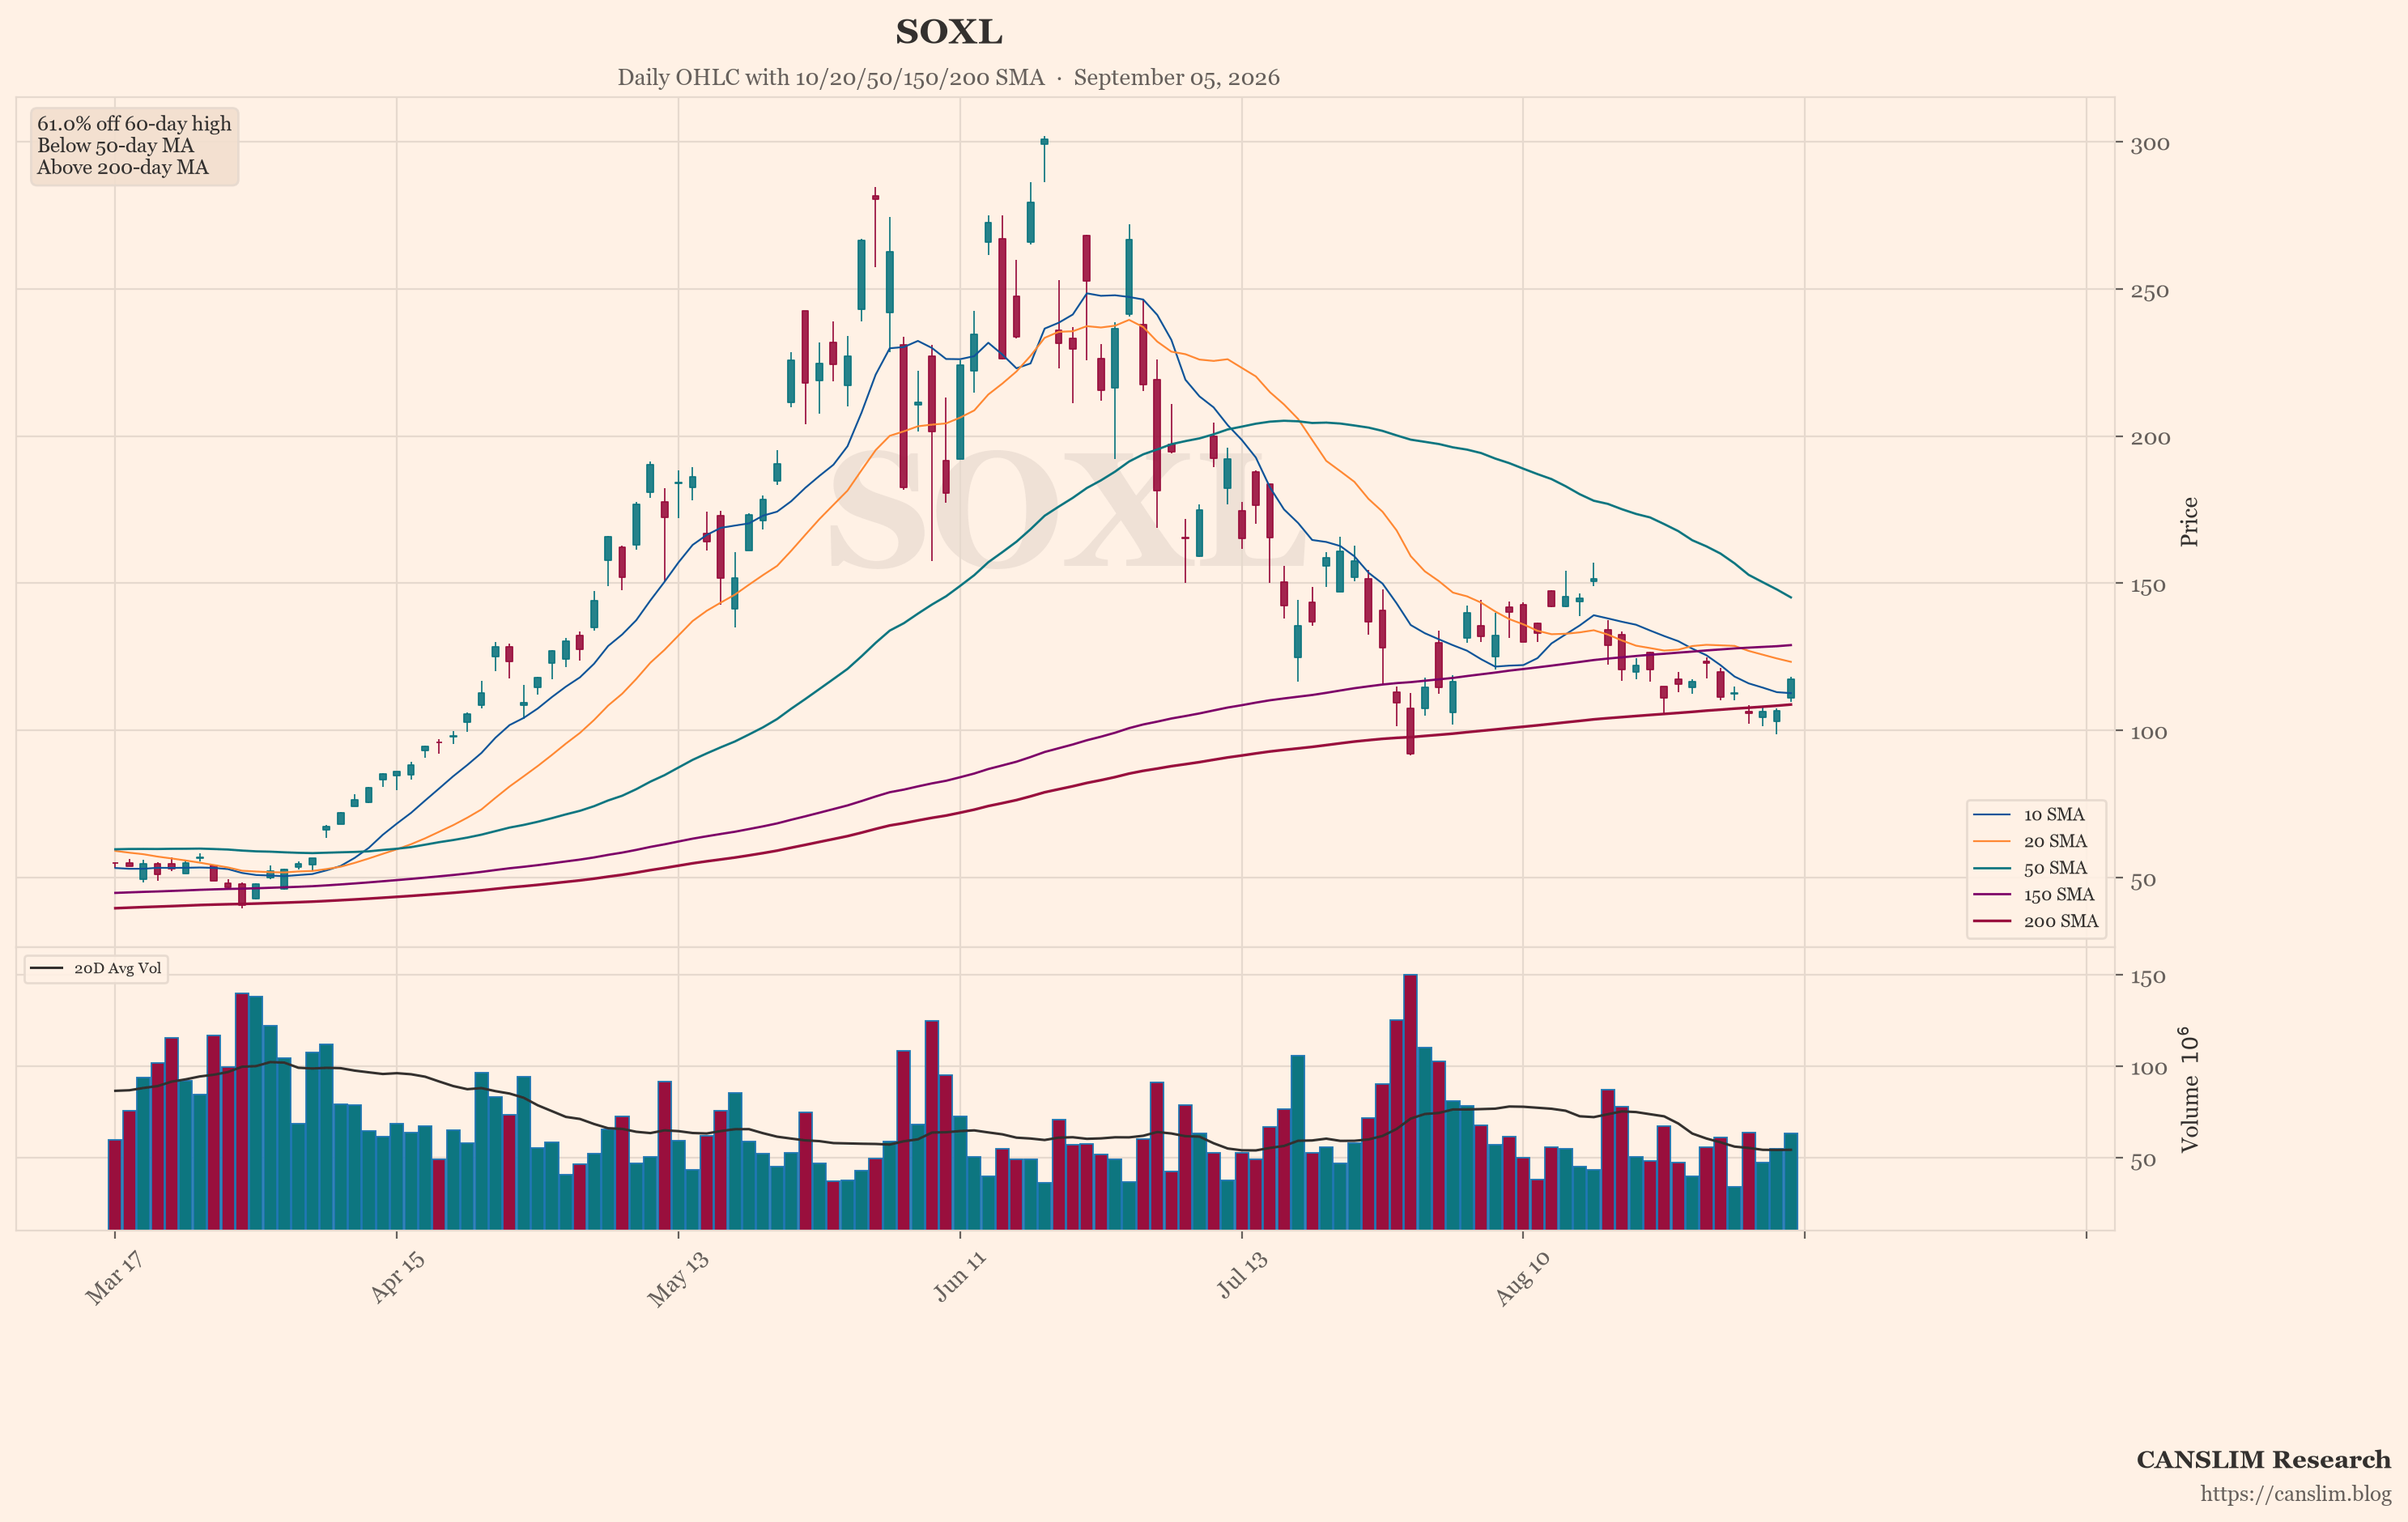
The selling hit long-duration names hardest. LULU plunged -17.39% to close near 100.61. NFLX fell -5.36% despite a price increase announcement. TSLA dropped -5.97% as its Cybercab faced scrutiny. AAPL slipped -2.52%. But a powerful divergence emerged. Memory and semiconductor stocks ripped higher against the weak tape. MU gained +5.91% to reclaim the 1000 level. SNDK surged +11.81% to close at its intraday high. SOXL jumped +10.04%. The catalyst? UBS raised its Q3 DRAM contract-price forecast from +17% to +32%. This is a fundamental repricing. The online crowd is deeply divided on whether this is a real breakout or just a short squeeze.
The Volume Tells a Different Story
The broader indices showed remarkable resilience. SPY closed Friday at 770.18, down only -0.38%. DIA fell -0.52%. But QQQ actually gained +0.20%. IWM rose +0.26%. This happened despite a hot jobs report and rate-hike odds jumping from 49.4% to 58.2%. The online crowd admits this should be bearish. Yet the market barely moved. Their verbal bearishness is disconnected from actual positioning. The narrative quickly shifted to "macro is useless; just trade price action." This is a classic sign of a market that refuses to go down. It suggests sellers are exhausted. The path of least resistance may be higher.
Political Heat Meets Policy Reality
A political showdown is brewing. The president publicly demanded rate cuts. He threatened a trade embargo if the Fed does not comply. He directed his comments at Fed Chair Warsh. The online crowd treated this as pure emotional venting. Most believe Warsh will not yield to threats. He has publicly focused on price stability. He sees the labor market as solid. A hike before midterms seems unlikely to some. Others fear a hike is exactly what happens. The crowd jokes that the president fired one hawk only to replace him with another. This political noise adds uncertainty. But the market seems to be ignoring the rhetoric for now.
The Weakest Link in the Rally
The featured chart is SOXL. It currently shows the weakest technical pattern in this semiconductor move. While MU reclaimed 1000 and SNDK closed at highs, SOXL lags. This is a warning sign. The leveraged ETF often leads on the upside. Its failure to confirm strength suggests caution. The online crowd notes that semiconductors peaked on June 22-23. One bear assigns a 55-65% likelihood that June was the cycle peak. He predicts this move runs out of steam within two weeks. Bulls argue the sector broke out after two months of consolidation. Shorting breakout day is dangerous. Watch whether MU can hold 1000. Watch if SNDK reaches 1800. The next few sessions will be critical.
Inflation Data Looms as the Next Catalyst
Next week brings the CPI report. This is the next major test. If inflation runs hot, a September hike becomes much more likely. The market could face another leg lower. Higher fuel prices add another layer of strain. Diesel hit a record high. Crude remains elevated on Middle East supply risks. Geopolitical tensions continue to escalate in the Strait of Hormuz. The U.S. escorted 40 commercial vessels carrying 18 million barrels of oil in one day. This is a wartime record. For investors, the setup is simple. Watch CPI. Watch Treasury yields. Watch if the market keeps repricing toward tighter policy. The near-term direction hinges on this data point.
A Market Split Between Macro Fear and Technical Strength
This market is a study in contradictions. The macro backdrop looks bearish. Hot jobs data. Rising yields. Political threats. Geopolitical tension. Yet the indices refuse to fall. Meanwhile, leadership is narrow but powerful. Memory stocks are breaking out. Consumer names are breaking down. The online crowd is accurate on individual stocks but confused on the macro picture. The key takeaway is to follow price action, not predictions. The weakest link is SOXL. If it fails, the rally may falter. If it catches up, the move has legs. Stay disciplined. Manage risk. Let the market tell you the story.
Sources: market news brief & global social sentiment data. Updated 2026-09-05 14:00 HKT. For educational purposes only — not investment advice.
Discover more from CANSLIM Research
Subscribe to get the latest posts sent to your email.