Andrew@CANSLIM RESEARCH
The Calm Before the CPI Storm
The S&P 500 sits near record highs, but the calm is deceptive. A holiday-shortened week masks a critical tension. Strong August payrolls have pushed odds of a September Fed hike to roughly 60%. The 10-year Treasury yield now approaches a dangerous 4.8% level. That line in the sand matters. A sustained break above it would raise discount rates across the entire market. Growth stocks with long-duration cash flows would feel the most pain. This week’s August CPI report is the key test. A hot number lifts yields further. A soft one reopens the door to a supportive rate outlook. The market is holding its breath.
The Online Crowd Cheers While Leaders Fade
Global social sentiment is loud and greedy, but not blindly so. The fear/greed gauge sits at 8/10. Many traders carried leveraged positions into the holiday. Yet the mood is self-aware. The crowd mocks the “AGI has arrived” slogan from Jensen Huang. They treat it as a top signal, not a fundamental breakthrough. Meanwhile, they are fully long the trade. Memory stocks exploded on Friday. MU closed at 1015, up 5.91%. INTC gained 4.52% to 95.80. AMD rose 4.65%. The Asian session added fuel. SK Hynix jumped 8.4% intraday. Samsung gained 4.9%. The divergence is stark. Indices barely moved while AI and memory names ripped higher. That is a warning sign for a narrow market.
Energy Risk Adds a Fresh Inflation Threat
Oil prices are climbing again. Brent closed above $95 last Friday, its best weekly gain since July. The trigger is geopolitical. The U.S. struck three Iranian oil tankers. Tehran responded by attacking U.S.-linked vessels. Iran now plans a “restricted zone” outside the Strait of Hormuz. European gas prices are also rising on supply concerns. This is a fresh inflation risk right before the Fed decision. Higher energy costs feed directly into CPI. They also pressure consumer spending. For growth investors, this is a double-edged sword. Energy stocks lead, but the broader market suffers from rising input costs. The online crowd is largely ignoring this risk, focused instead on the memory rally.
The Weakest Link in the Rally
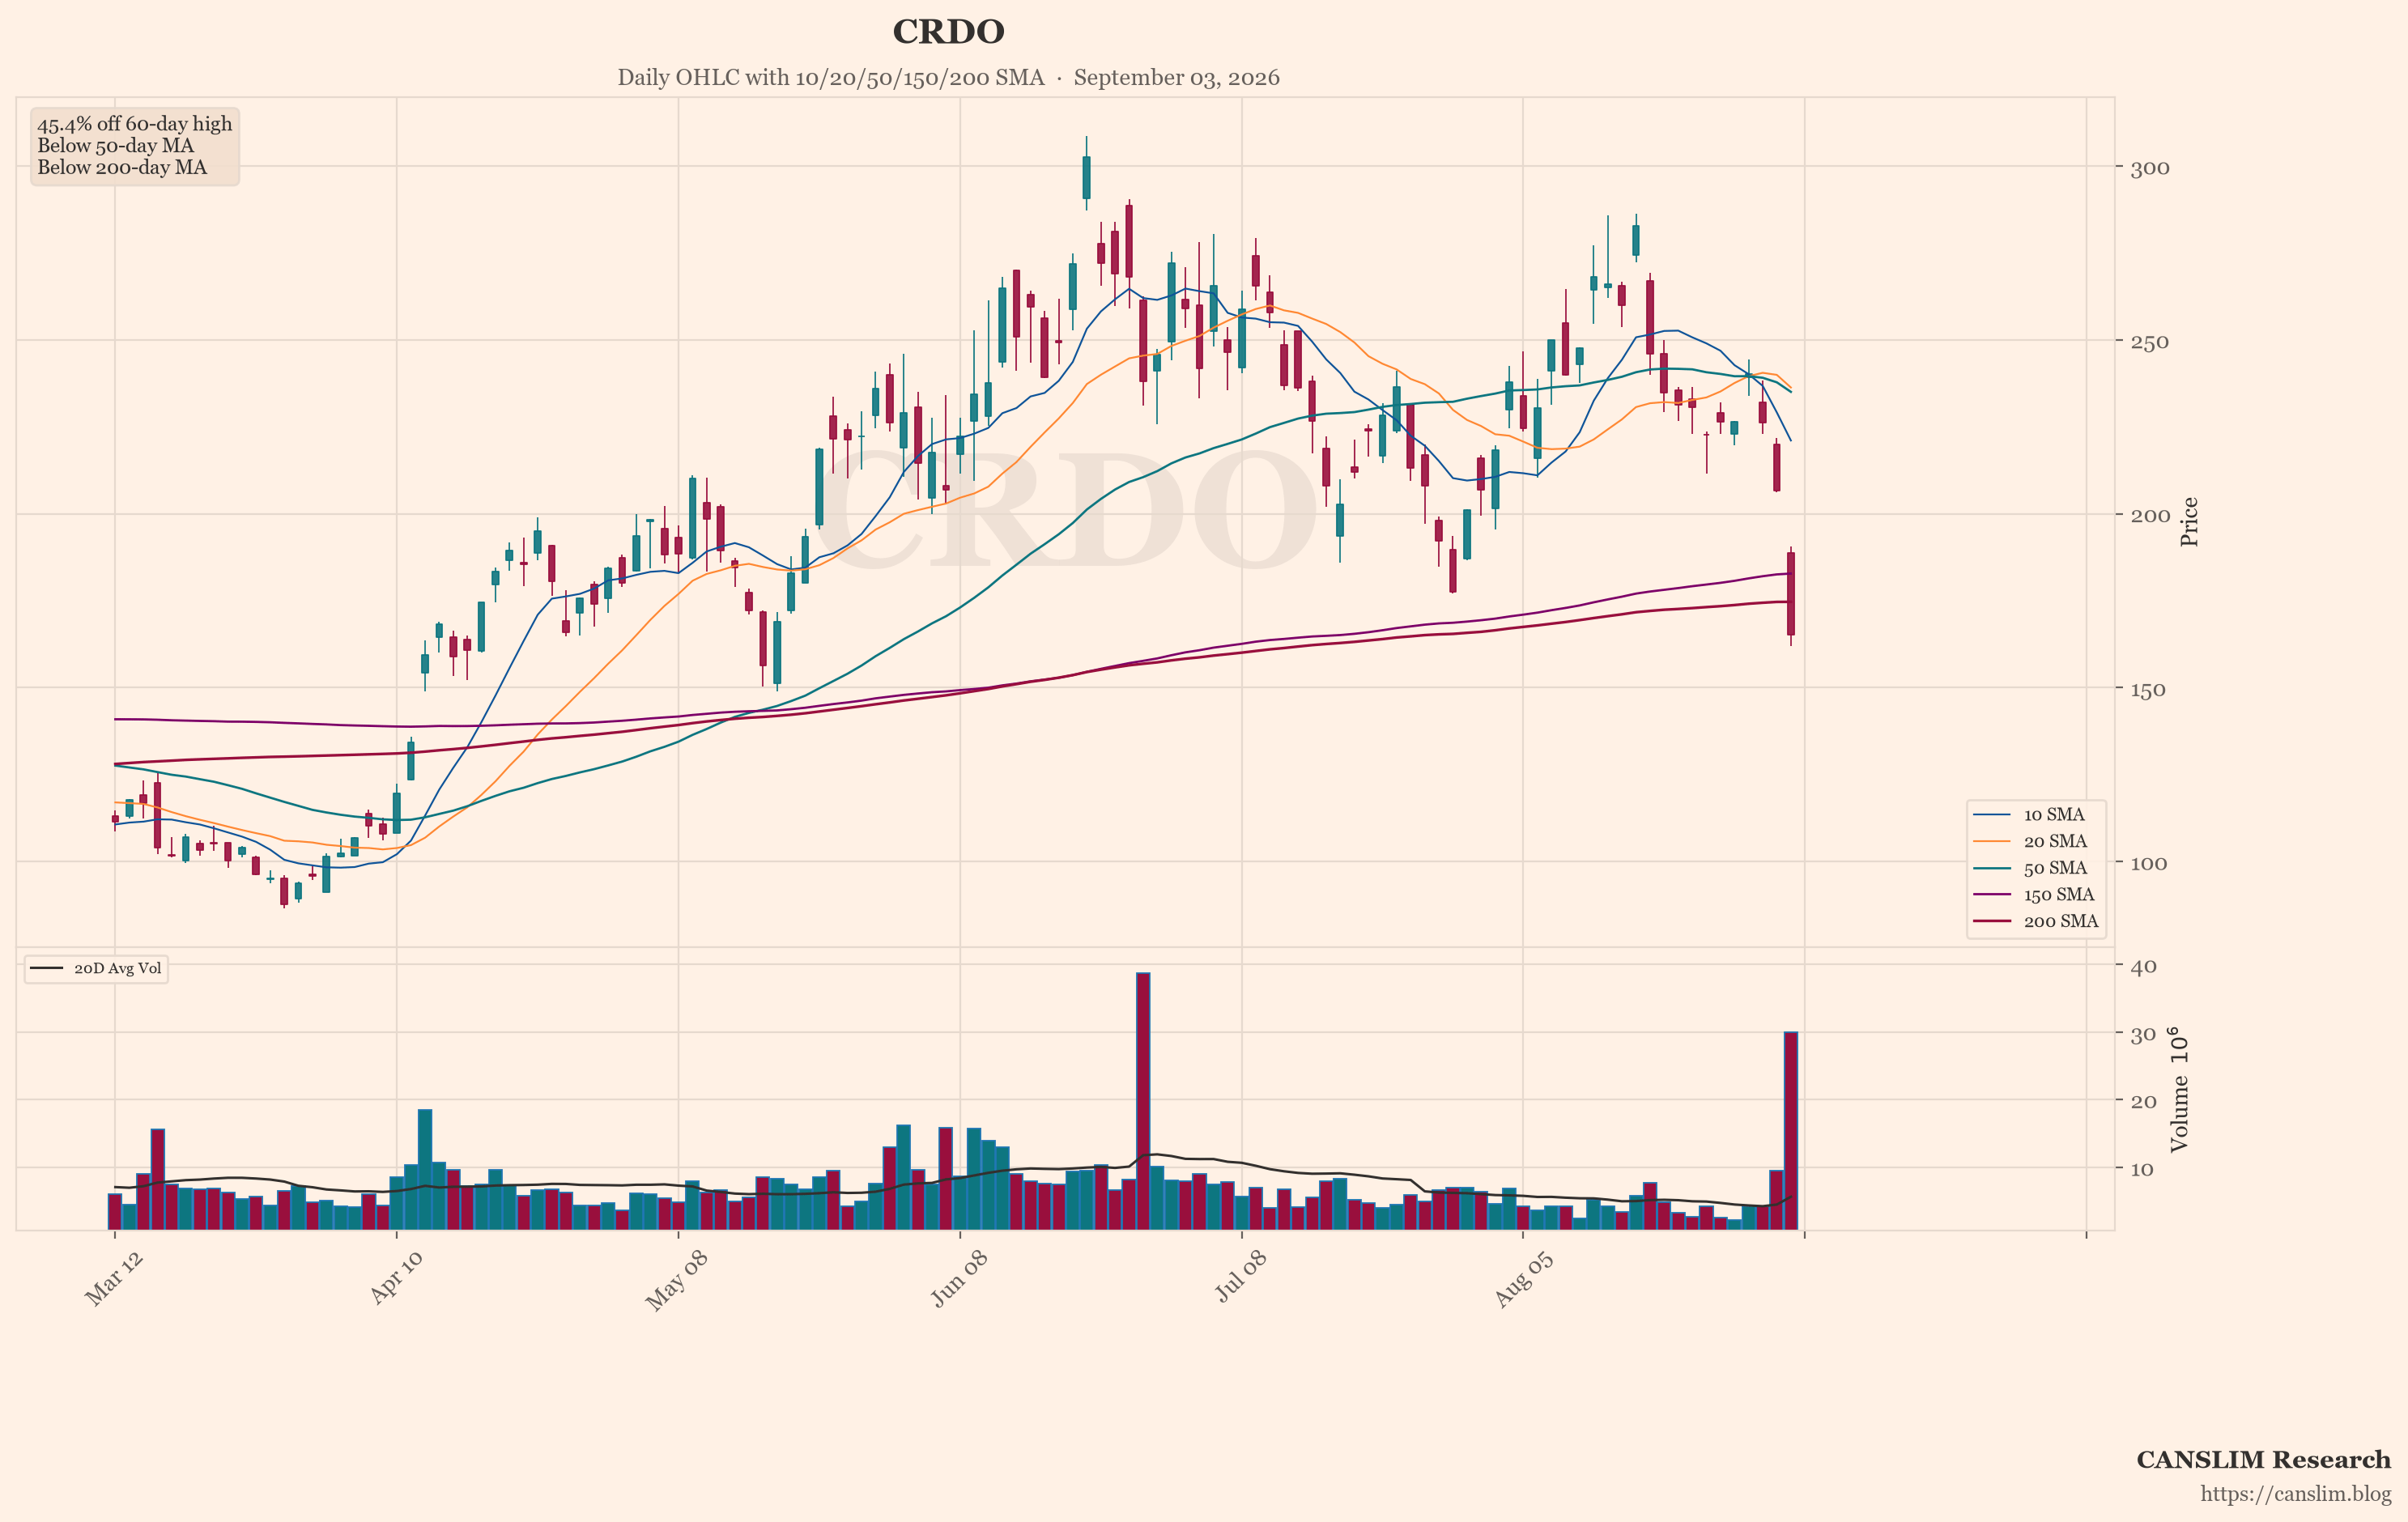
The featured chart is INTC, and it shows the weakest technical pattern in the group. While MU and AMD break out on volume, INTC lags badly. The stock closed Friday at 95.80, up 4.52%, but that move looks like a sympathy pop. Relative strength is poor. The 200-day moving average is far below the current price, but momentum is fading. Institutional money is not flowing into Intel the way it is into other memory names. The company’s fundamentals remain challenged. Foundry losses and execution issues persist. In a CAN SLIM framework, INTC fails on earnings and price strength. The online crowd is not discussing it as a leader. They are discussing it as a laggard. When the market corrects, weak hands sell the weakest names first. INTC is that name.
A Hot CPI Could Break the Back of This Rally
The macro calendar is heavy. CPI lands on September 11. The FOMC meets September 15-16. After a hawkish Jackson Hole speech from Warsh, the market prices a 66% chance of a hike. Norway’s sovereign wealth fund has proposed cutting U.S. Treasury holdings by $80 billion. That is roughly 40% of its government-bond portfolio. Japan intervened with a record 15.4 trillion yen. These are structural headwinds for yields. If CPI comes in hot, the 10-year breaks 4.8%. That would pressure every risk asset. The online crowd is not hedging. Only a few mention XSP puts as tail-risk insurance. That is a contrarian signal. When everyone is long and no one is hedged, the downside gap is wider. The memory rally on “zero news” must eventually be given back.
The Divergence That Demands Respect
The indices tell one story. The leaders tell another. SPY fell 0.38% on Friday. QQQ rose just 0.20%. Yet MU gained nearly 6%. That kind of divergence is unsustainable. Either the broad market catches up, or the leaders roll over. The online crowd chants about a “gap up on Tuesday.” But they also mock the AGI narrative as a CEO pump. That contradiction is telling. They are greedy, but they know it. The smart play is to respect the technicals. INTC is the weakest link. If the market corrects, it will lead the decline. The strongest names, like MU and ORCL, may hold up better. But no stock is immune to a 4.8% yield. Watch CPI. Watch the 10-year. The next 48 hours will set the tone for September.
Sources: market news brief & global social sentiment data. Updated 2026-09-07 22:00 HKT. For educational purposes only — not investment advice.
Discover more from CANSLIM Research
Subscribe to get the latest posts sent to your email.