 Andrew
General educational commentary only, generated automatically with AI. Not investment advice or a recommendation to buy, sell or hold any security. Capital is at risk.
Alphabet's Record Decline Weighs on Major Indexes
U.S. stocks fell on Thursday. A record drop in Alphabet put pressure on the major indexes, according to the news brief. The Nasdaq lost 1.38%. Reports cited by the brief said Alphabet slid after weaker-than-expected revenue in its core business. Investors also weighed rising investment plans at Amazon. The New York Times reported that Big Tech's data center spending is using large amounts of cash and worrying Wall Street. The brief said this renewed doubts about whether heavy AI spending will generate returns fast enough.
Breadth Holds Up despite the Headline Losses
The decline was concentrated in large tech. The brief noted that market breadth remained relatively strong, with many stocks advancing even as the indexes finished lower. Barron's framed the session with a piece titled "Don't Call It a Tech Wreck." One reading is that the losses were narrow rather than broad. This may suggest that selling was tied to specific earnings news, not to the whole market. Still, the brief noted that major indexes are exposed to a small group of large technology stocks. When those stocks move, the indexes tend to follow.
GDP Beats Expectations While Inflation Heats Up
The economic picture was mixed. Third-quarter GDP grew at a stronger-than-expected 3.4%, the brief said. Consumer spending supported the gain. Investment in computer equipment posted a record increase, according to Seeking Alpha. But September inflation rose to 3.6% from a year earlier. The New York Post linked part of the rise to high gas prices. This came one day after the Fed held rates steady. The brief said the inflation reading complicates the outlook and keeps rate expectations uncertain. Next week brings more inflation data and the U.S. midterm elections. The brief also said investors will watch whether earnings and guidance from technology and semiconductor companies can restore confidence in the AI trade.
Overseas Weakness and a Crypto Security Issue
Japanese stocks weakened ahead of a Bank of Japan decision. The Wall Street Journal reported that the Nikkei fell 1.3%, dragged by electronics and metals stocks. Crypto prices fell after Binance disclosed a potential security issue. Reuters reported that Binance froze assets during its investigation. The brief did not give figures for the crypto moves. These events added to a cautious tone outside the U.S. One interpretation is that global cues gave investors little reason to look past the tech earnings news.
Online Sentiment Turns Cautious on AI Spending Themes
Online sentiment around large-cap technology and AI themes turned more cautious, based on unverified posts by anonymous retail users. Such posts may include rumour or speculation and have not been checked. They are not a measure of institutional flow or confirmed positioning. Some commentary questioned whether the heavy spending described in the news brief can produce returns soon. Other posts pointed to the strong breadth reading and treated the index drop as narrow. Sentiment on rate-sensitive themes was mixed after the 3.6% inflation figure. Crypto-related chatter was unsettled after the Binance disclosure. These are theme-level observations only. They describe mood, not money movement, and should be treated with caution.
Chart Screen Flags Nasdaq Weakness on Several Measures
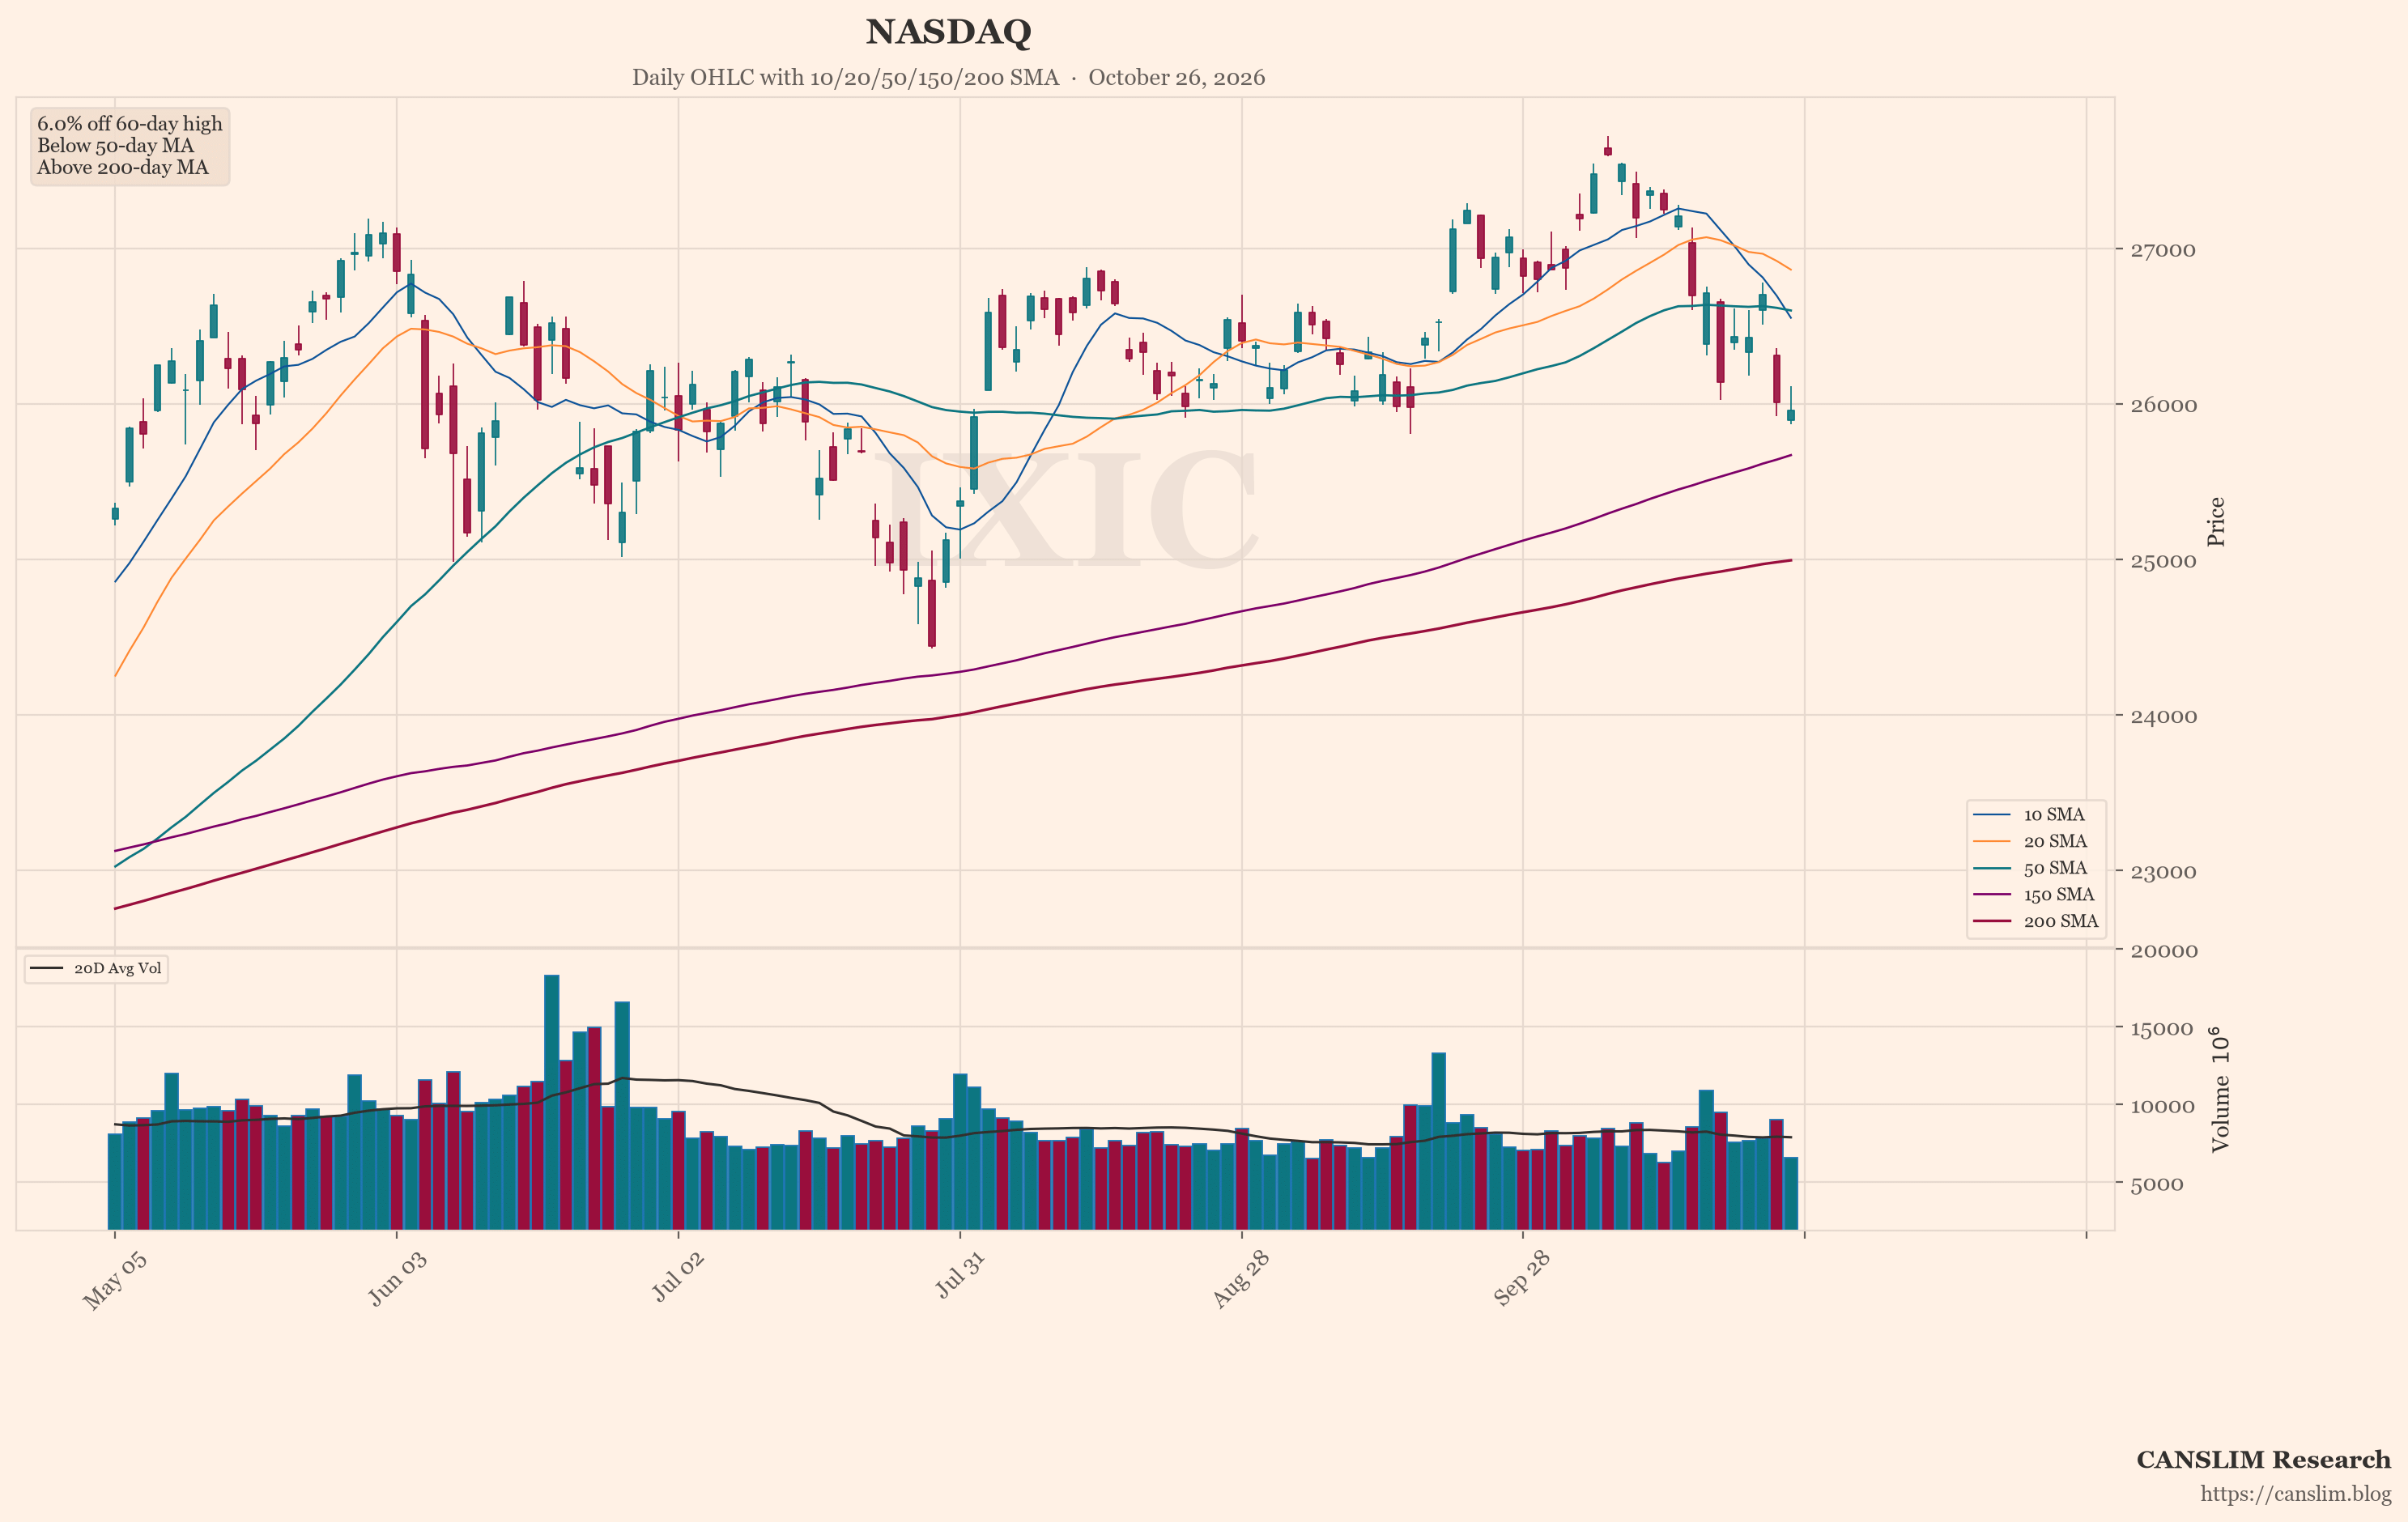
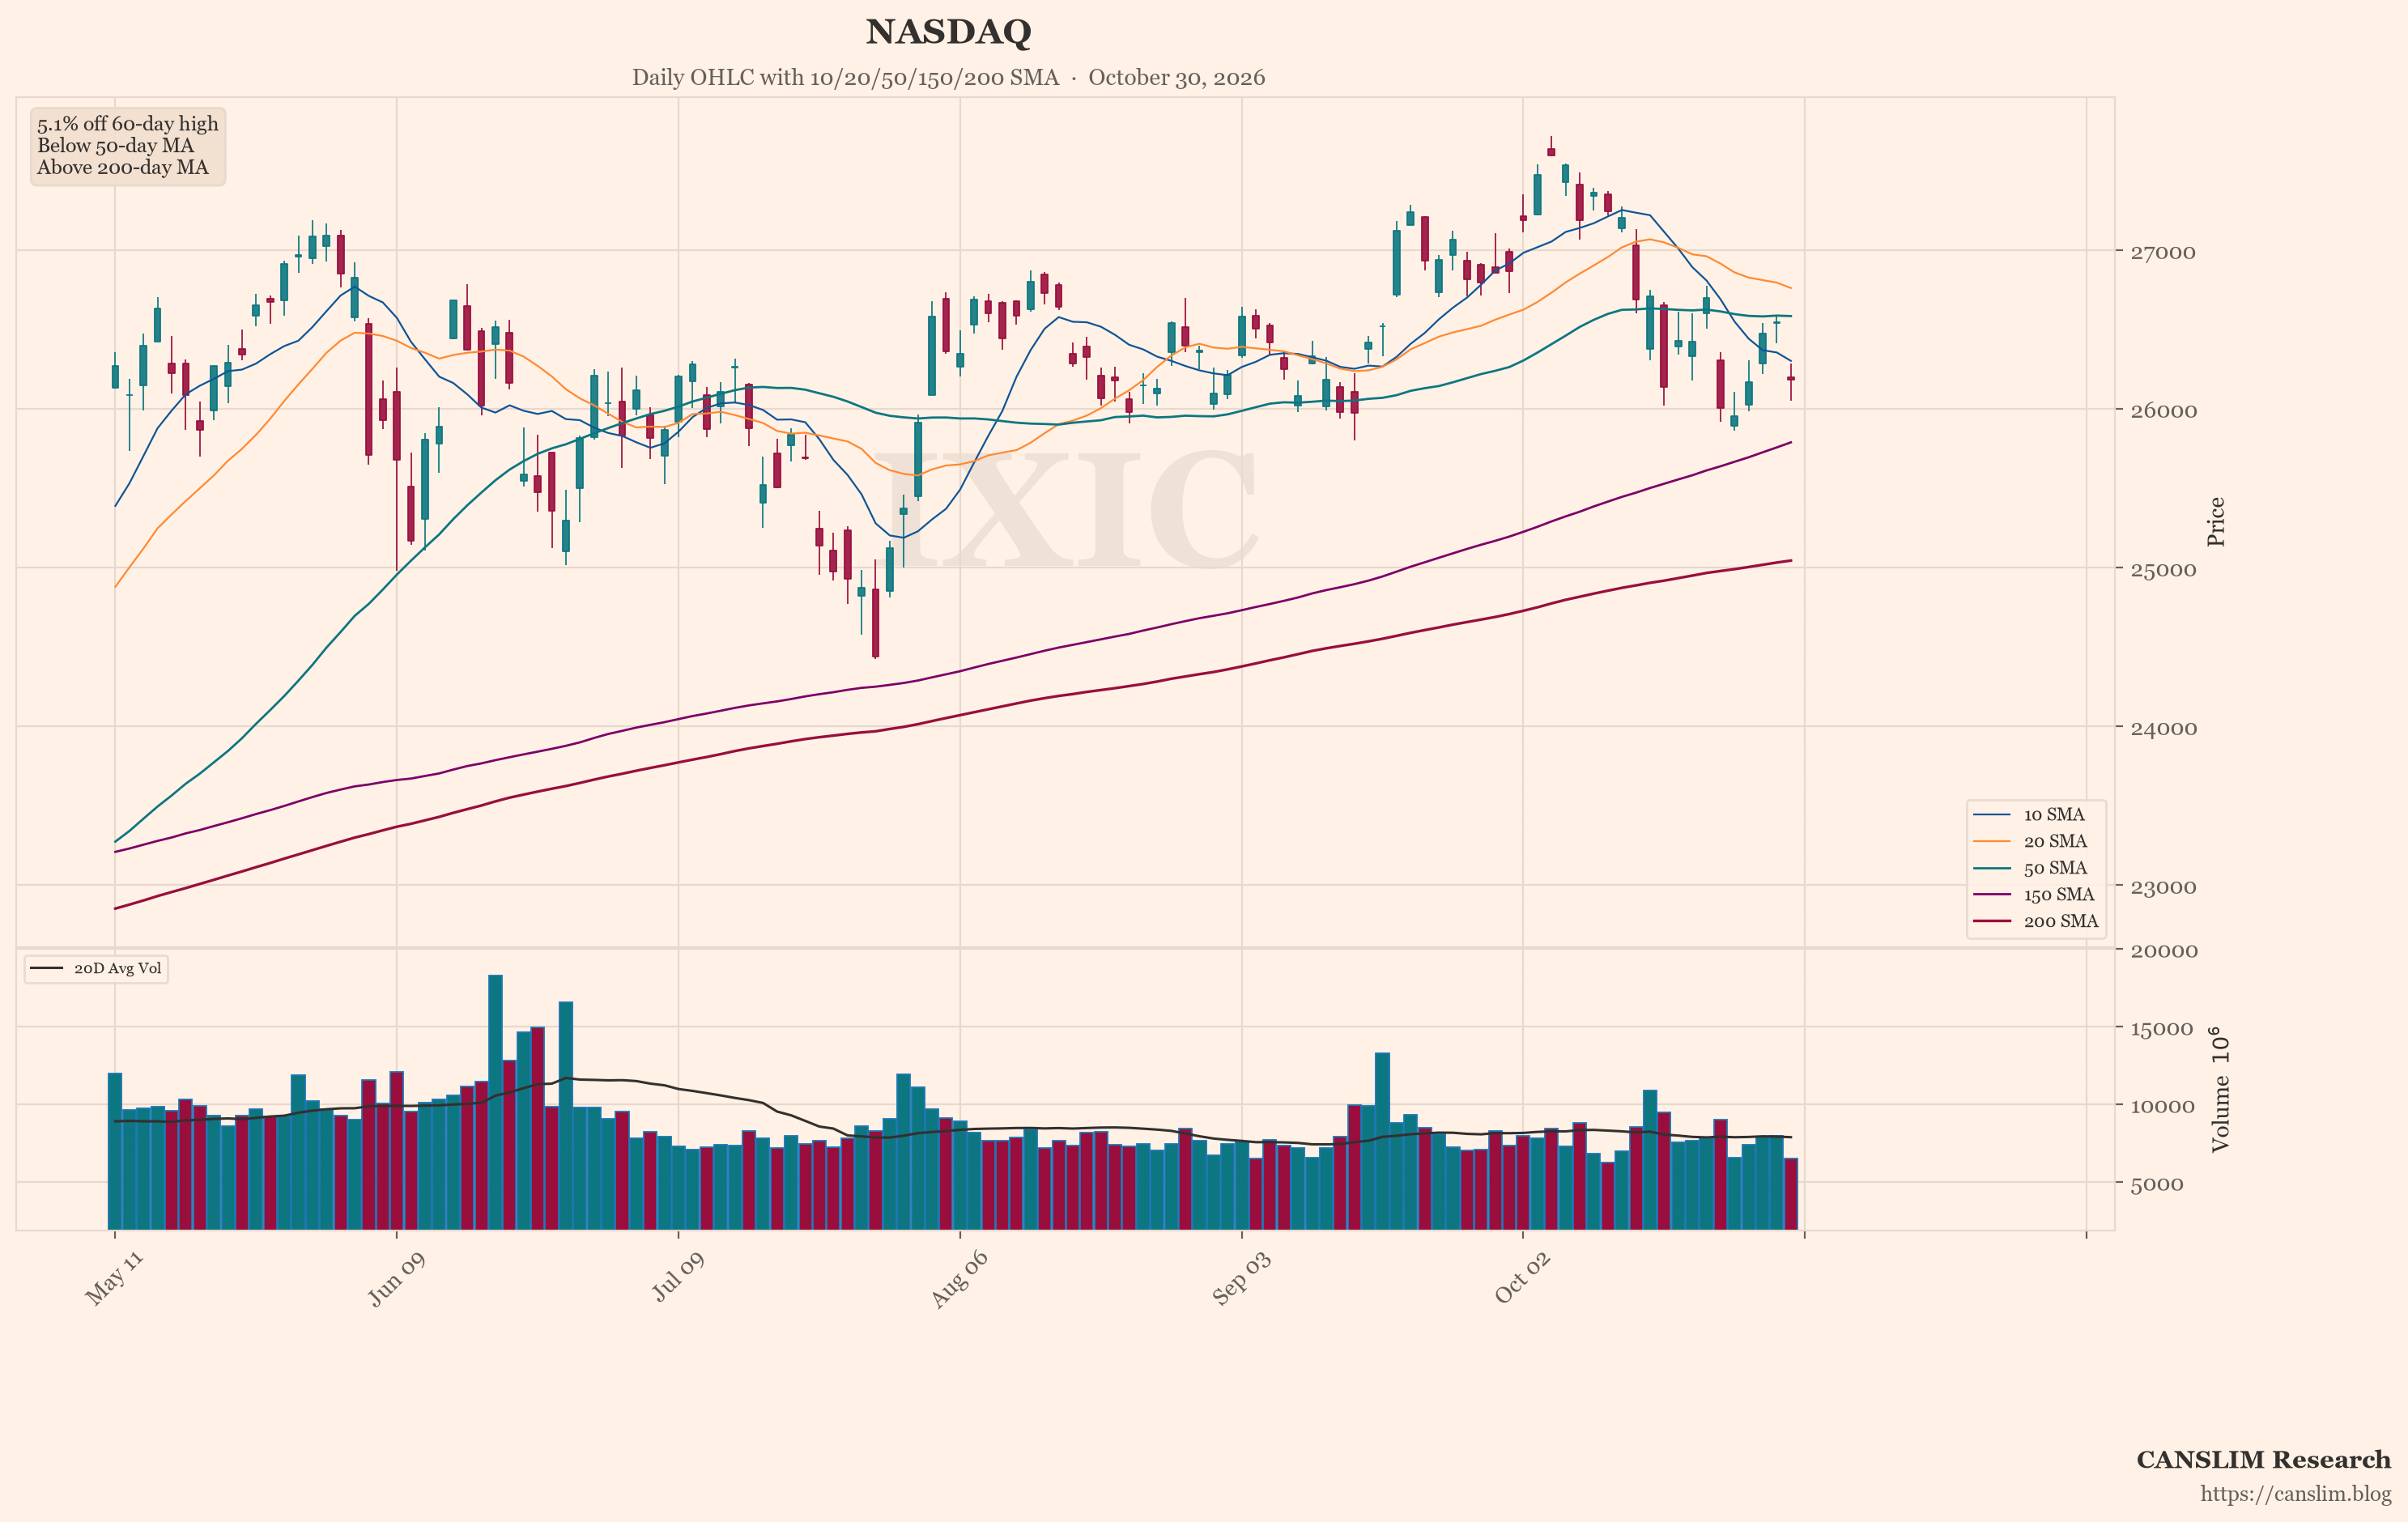
The featured chart shows the Nasdaq (^IXIC). An automated technical screen picked it because, among the indices and stocks it checked, it showed the most weakness on a few measures. These were distance from its recent high, position versus its 50-day and 200-day moving averages, and down days on higher volume. This is one screen, not a full view of the market. Past price patterns do not predict future results. The reading sits alongside the brief's note that breadth was relatively strong, so the signals point in different directions.
Mixed Signals Leave the Outlook Uncertain
Conditions are mixed. Large technology stocks carry the indexes, and one weak earnings report moved them lower. At the same time, many individual stocks advanced. Growth data was strong, but inflation moved up and rate expectations remain uncertain. Next week's inflation data, the midterm elections and tech earnings could shift the picture. Risks include more disappointment on AI spending returns, a further rise in inflation, and weakness from overseas markets or crypto. The screen's weakness reading adds another caution. None of these factors points clearly in one direction.
Sources: a third-party AI-generated market news summary, and an AI summary of unverified posts by anonymous retail users online. This article was written by an AI language model from those summaries and published automatically without human review. Updated 2026-10-30 10:56 HKT.
CANSLIM Research (canslim.blog) is an independent educational publisher. It is not licensed or registered as a broker, investment adviser, research analyst or asset manager in any jurisdiction. This article is general information for education only. It is not investment advice, a research report, an investment recommendation, or an offer or solicitation to buy or sell any security, and it does not consider any reader's objectives, financial situation or needs. No ticker, chart, heading or technical comment is a suggestion to buy, sell, hold or short. Figures come from third-party sources, are not independently verified, and may be incomplete, out of date or wrong. Online sentiment may include rumour, speculation or coordinated posting. Past performance and past price patterns do not predict future results. Investing involves risk, including the loss of capital. This article is not updated after publication. Laws differ by country; seek advice from a licensed professional in your jurisdiction before making any investment decision.
Discover more from CANSLIM Research
Subscribe to get the latest posts sent to your email.