 Andrew
General educational commentary only, generated automatically with AI. Not investment advice or a recommendation to buy, sell or hold any security. Capital is at risk.
AI-Linked Tech Slides While Broader Index Holds Mixed
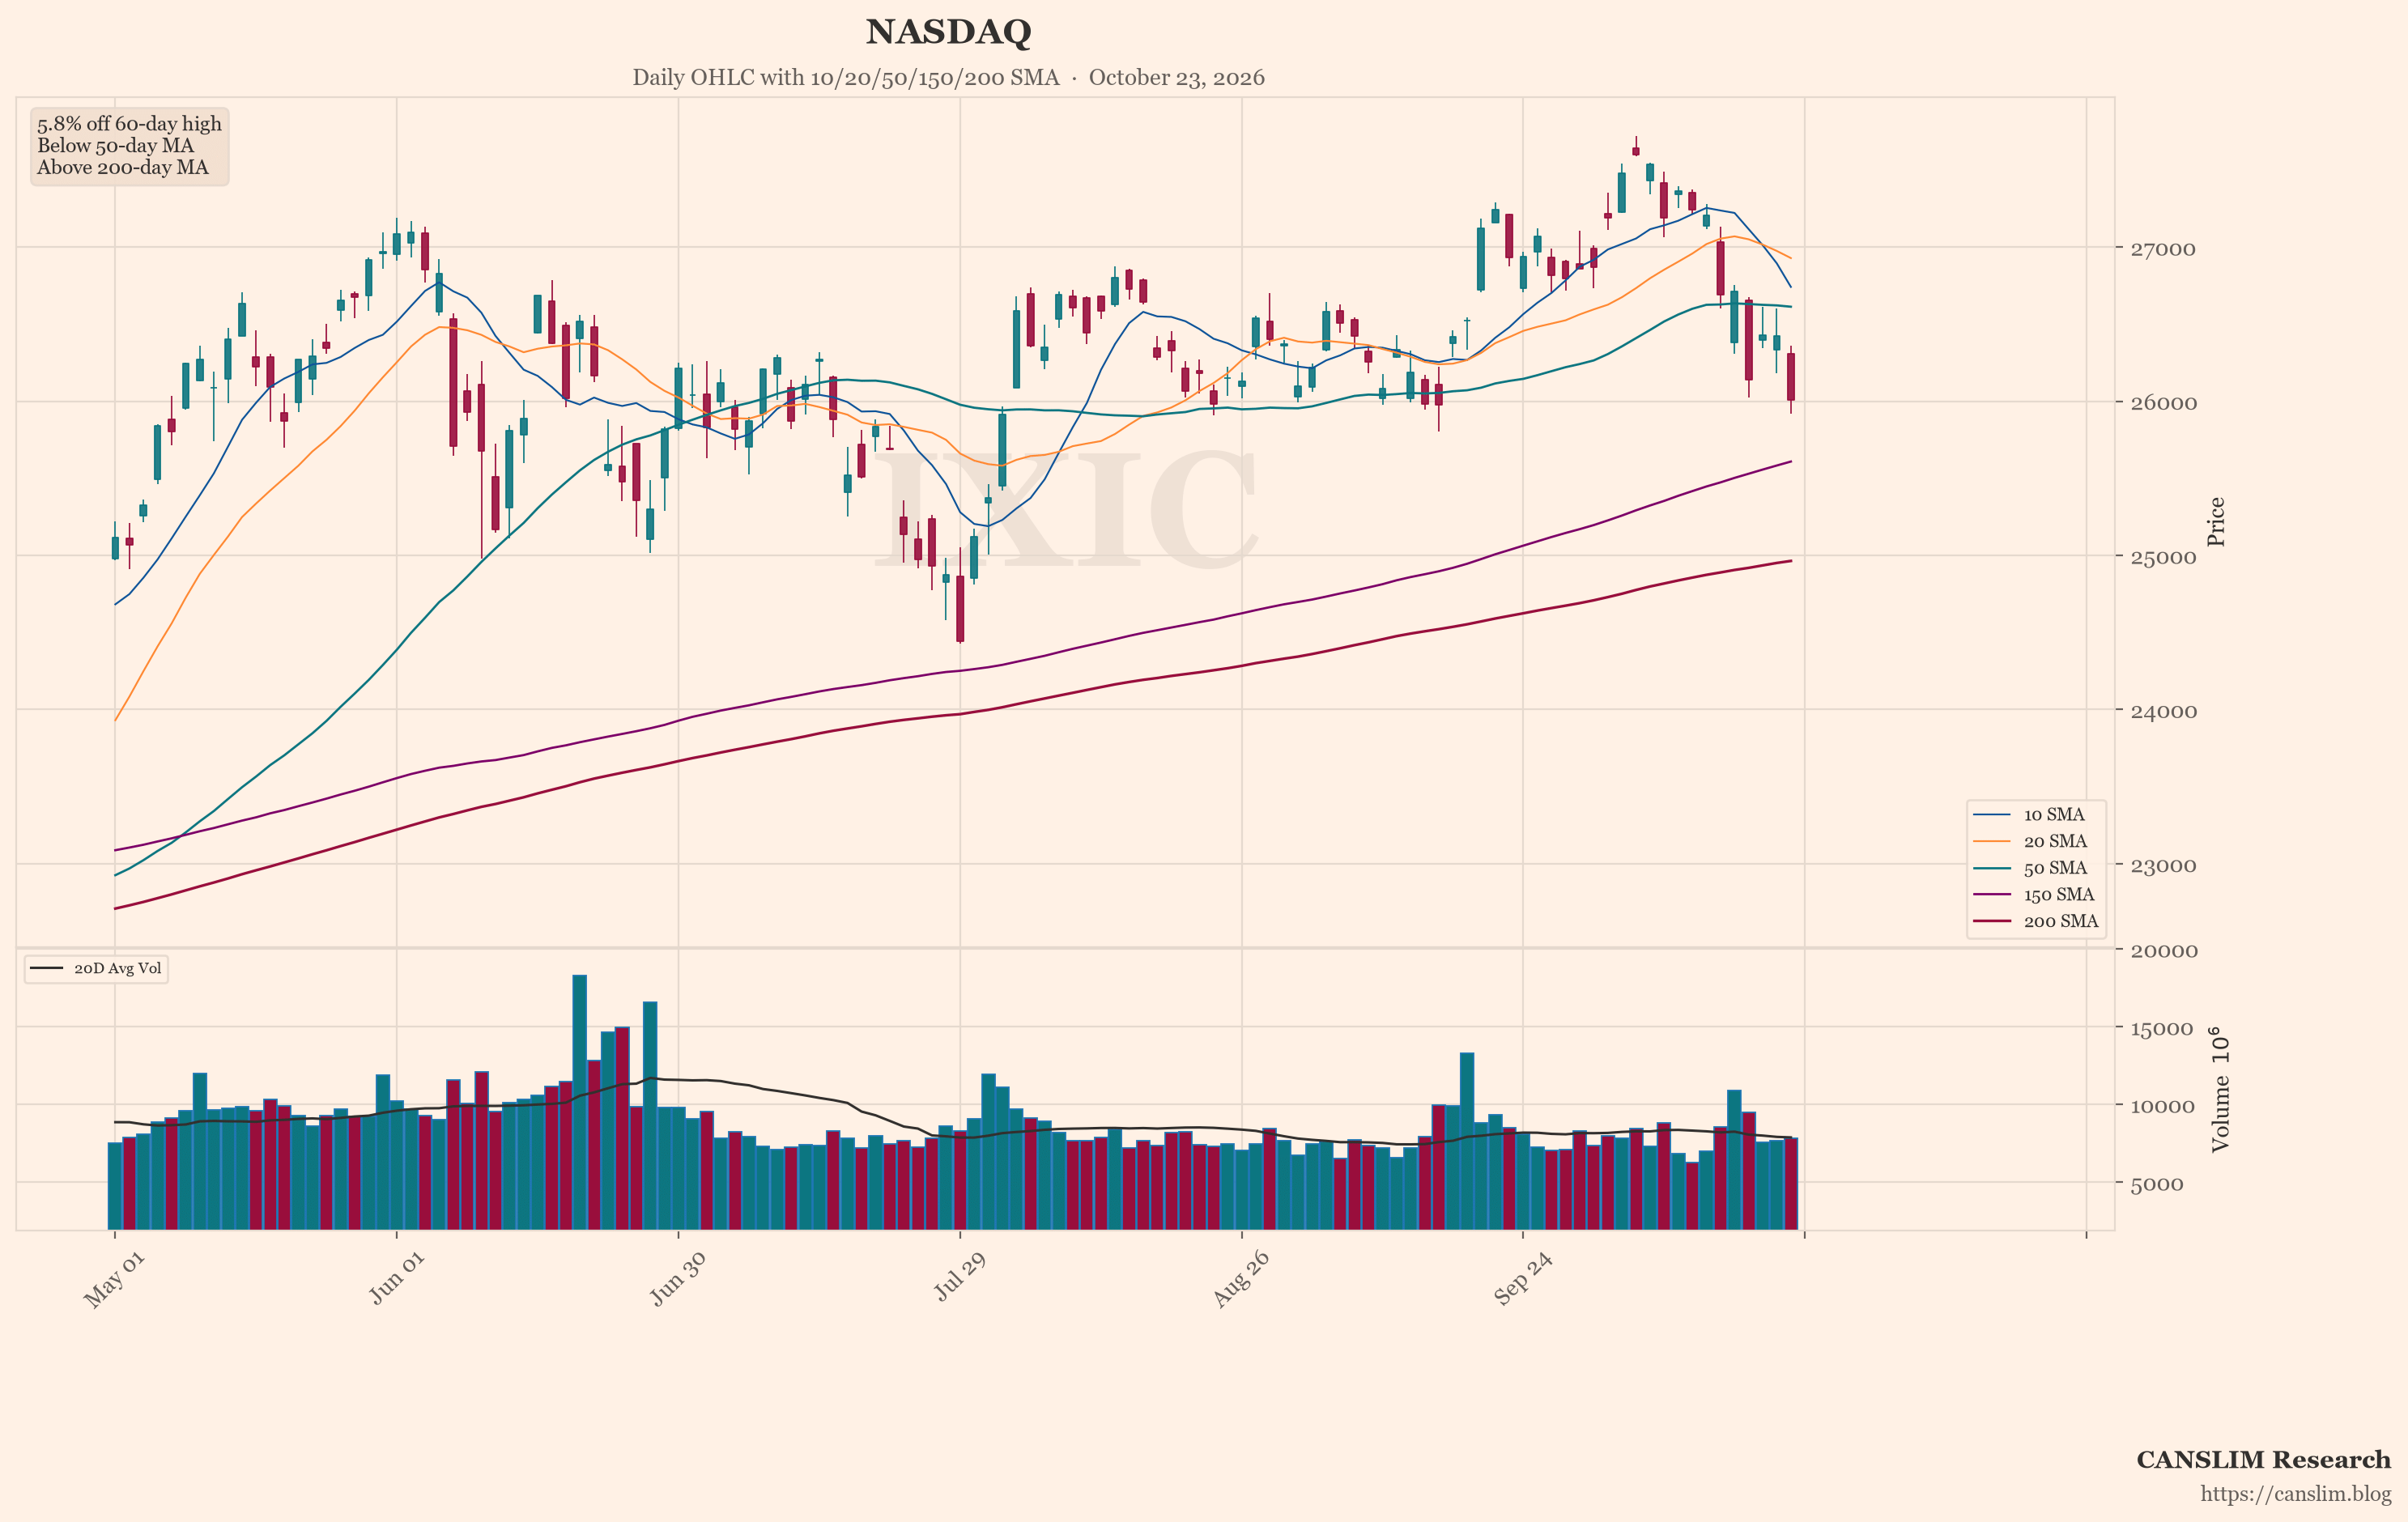
The news brief describes a sharp split in the US market. AI-linked technology stocks are under pressure. Investors are questioning whether heavy spending will deliver enough returns. At the same time, many other S&P 500 stocks have held up better. The Nasdaq fell 2.6% on Thursday. The brief, citing Reuters, calls this its steepest daily drop since June. The S&P 500 had its worst session since July. Reuters also reports that Wall Street futures dipped after the AI rout, with telecoms sliding.
Treasury Yields Dip and Edge Back as Investors Seek Cover
CNBC reports that the 10-year Treasury yield briefly fell below 5% as investors sought safety. It then edged back up on Friday. The brief describes this as caution, not a settled change in the rate outlook. The source does not give a precise closing yield level, so the size of the move is not stated here.
Hedge Fund Shorting Rises as Popular Trades Lose Ground
Reuters reports that hedge fund returns worsened this week as the tech selloff deepened. The brief adds that hedge funds have stepped up shorting as losses in popular trades mount. It frames this as strained positioning that could amplify market swings. The source gives no specific short-interest figures.
Oil above $100 and European Fiscal Strains Add Pressure
CNBC reports that US oil holds above $100 a barrel. Brent is at a five-month high after Iran said it is prepared for warfare. European gas prices have also surged ahead of winter. CNBC separately reports that France is flashing euro crisis signals, with a wider spread between French and German bond yields. The brief says investors are watching for spillover into broader markets. One reading is that energy costs and European fiscal risk could pressure consumers, businesses and inflation at the same time.
Earnings Wave and Fed Meeting Pose Tests for AI Spending Case
Reuters reports that next week brings a heavy run of corporate earnings and a Fed meeting. The brief calls these pivotal tests for what it describes as a rickety AI market rally. The question is whether AI investment can be supported by profits. CNBC Television reports that the iPhone Duo launch has put a fresh product catalyst in front of Apple. Munich Re raised its full-year profit guidance after a stronger-than-expected quarter, per Reuters. That is a positive company-specific counterpoint to the broader weakness.
Online Sentiment Turns Cautious on AI and Growth Themes
Separately, online sentiment around AI and growth themes has turned more cautious. This comes from unverified posts by anonymous retail users online. Such posts may include rumour or speculation and have not been checked. They are not a measure of institutional flow or confirmed positioning. At the theme level, the tone in these posts tracks the same worry the brief describes: whether large AI budgets will pay off. Some posts also discuss energy costs and rate uncertainty. This may suggest retail attention is shifting toward defensive themes, though the posts are too unreliable to treat as a signal.
Chart Screen Flags S&P 500 Weakness on Several Measures
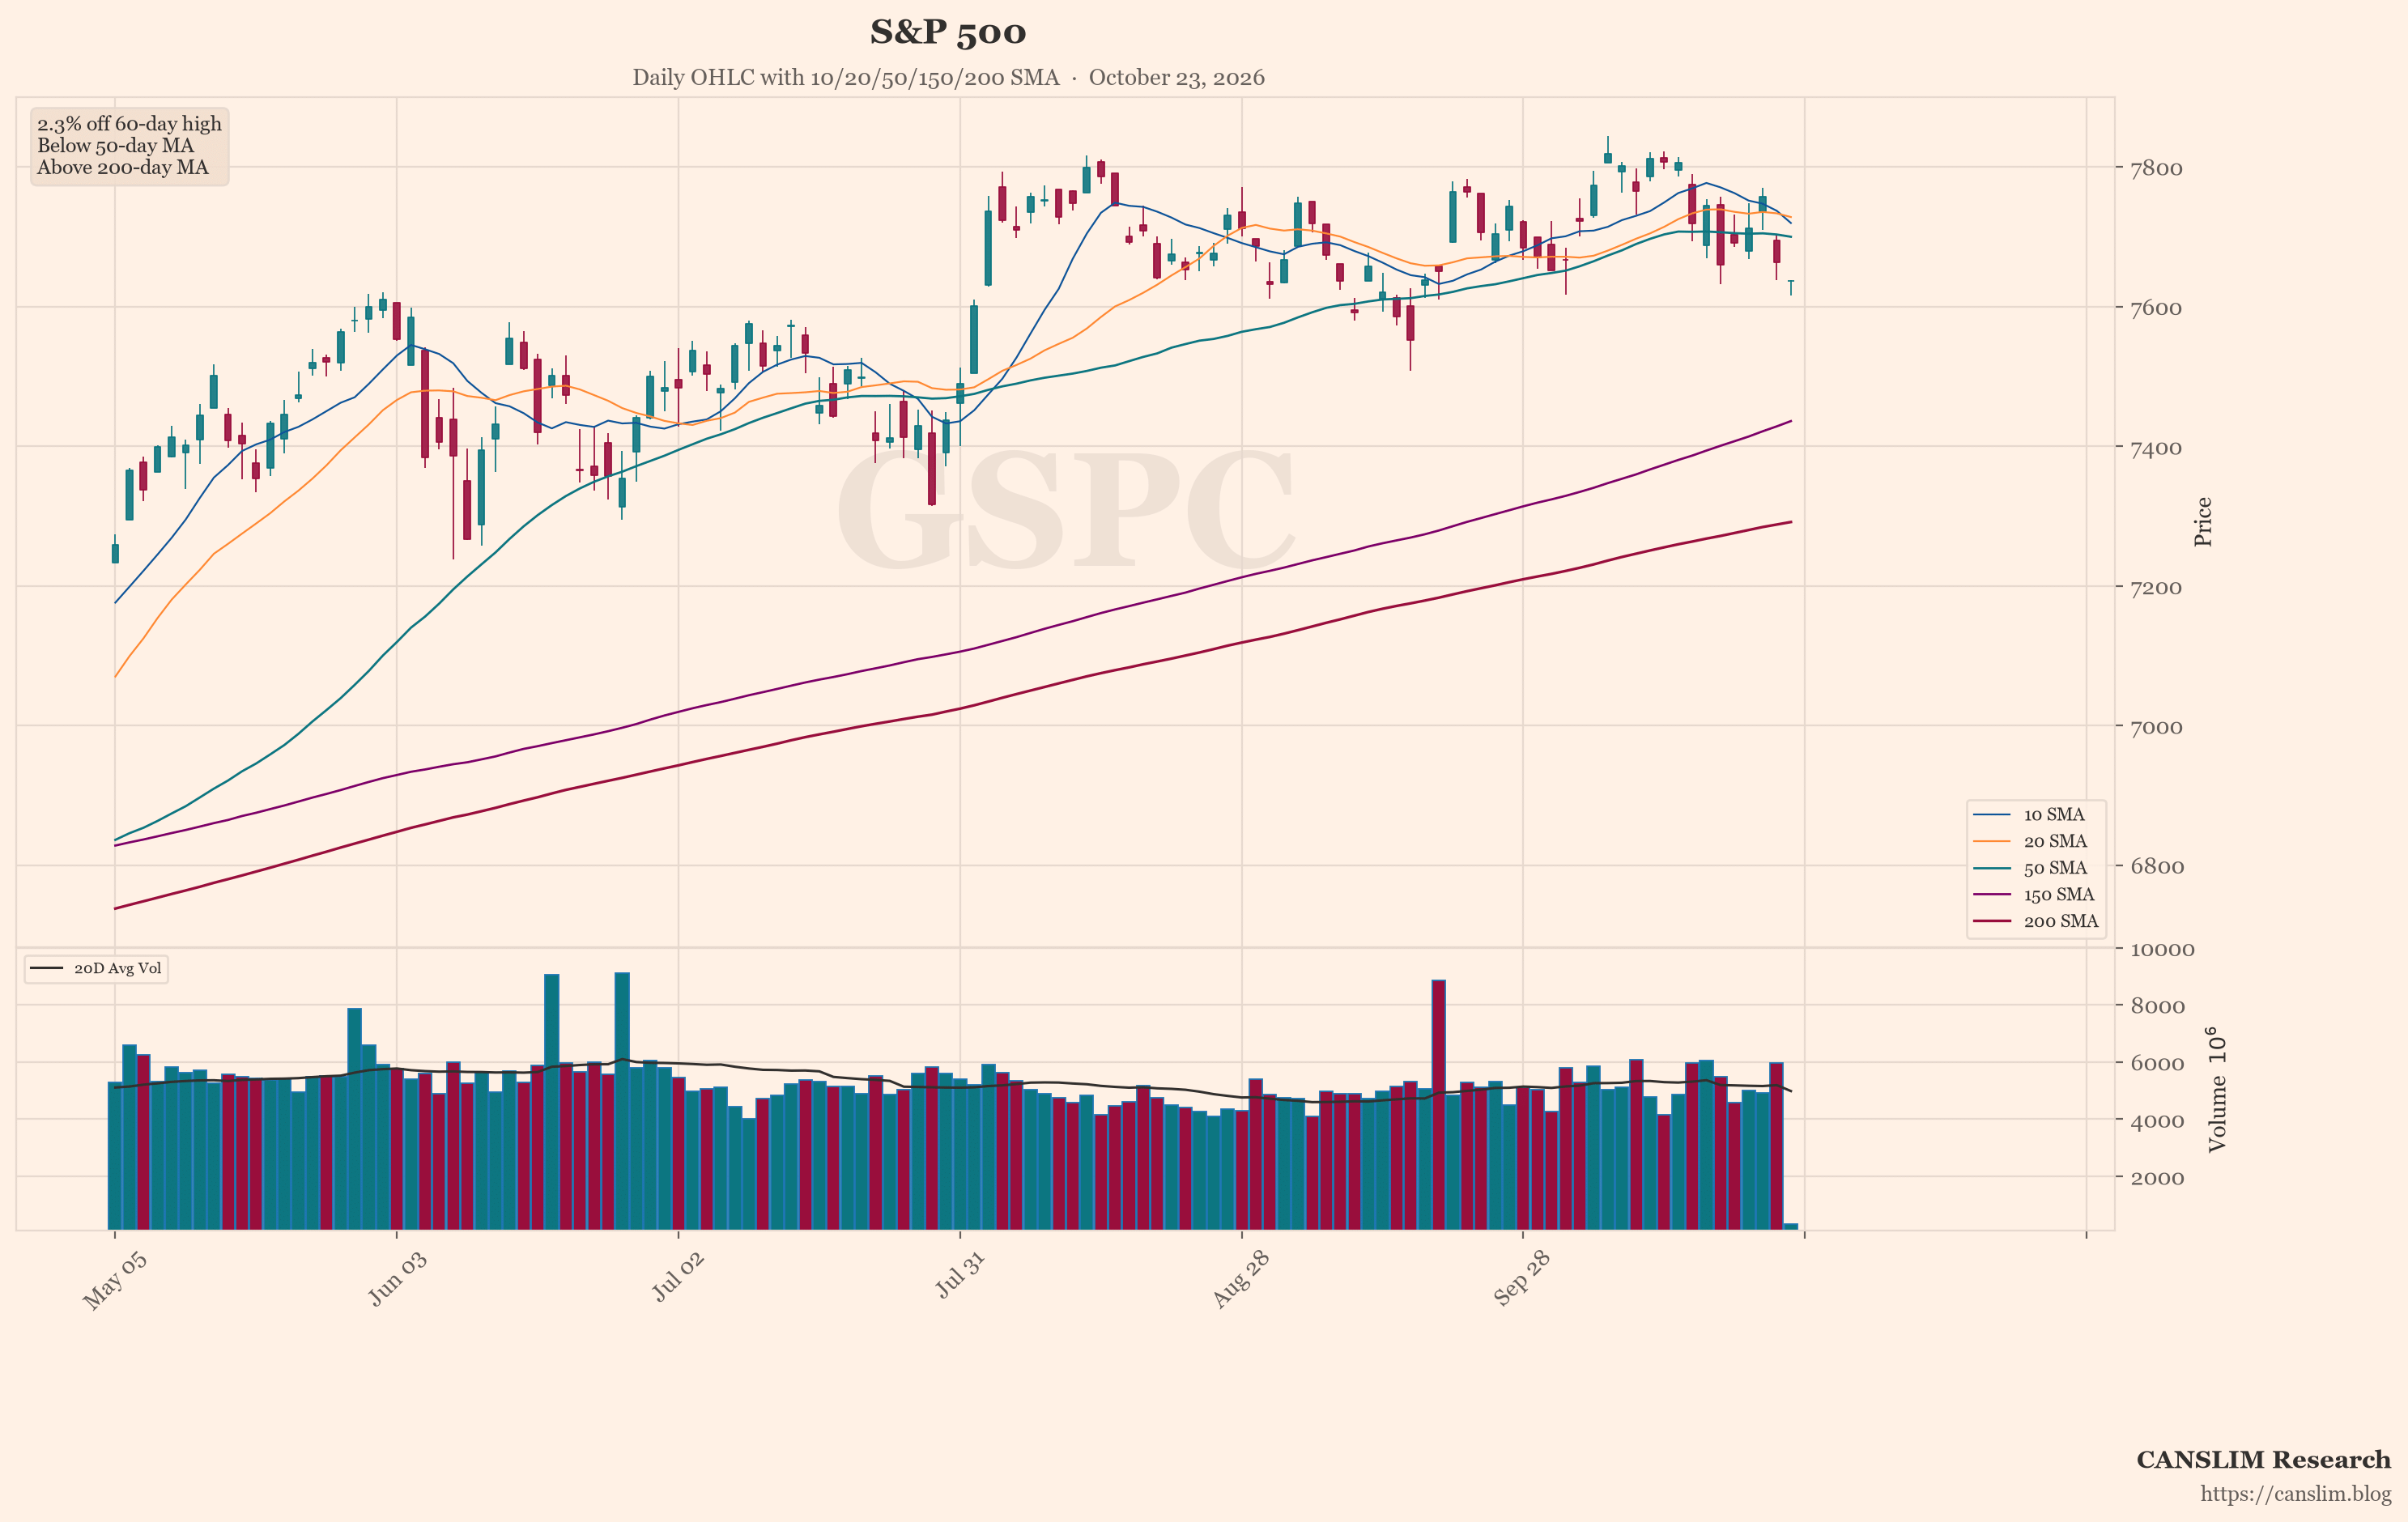
The featured chart shows the S&P 500 (^GSPC). An automated technical screen picked it because, among the indices and stocks it checked, it showed the most weakness on a few measures. These were distance from its recent high, position versus its 50-day and 200-day moving averages, and down days on higher volume. This is one screen, not a full view of the market. Past price patterns do not predict future results.
Mixed Company Results Sit against a Cautious Backdrop
The picture is not uniform. Munich Re's raised guidance shows that some companies are still beating expectations. The brief notes that many individual S&P 500 stocks advanced even on the down days for the major indexes. Breadth has therefore been uneven rather than uniformly weak. Still, the source material gives no breadth statistics, so the scale of that split is unclear.
Conditions Remain Split between Tech Weakness and Firm Energy Prices
Conditions described in the sources are mixed. AI-linked tech is under pressure. Oil above $100 and high European gas prices raise cost concerns. French bond strains keep European fiscal risk on the radar. Hedge fund shorting could amplify swings. Next week's earnings and the Fed meeting are open tests, and the outcome is uncertain. Against that, some company results have been strong and many individual stocks have held up. The main risks are a weaker payoff from AI spending, energy-driven inflation pressure and volatility from strained positioning.
Sources: a third-party AI-generated market news summary, and an AI summary of unverified posts by anonymous retail users online. This article was written by an AI language model from those summaries and published automatically without human review. Updated 2026-10-23 22:00 HKT.
CANSLIM Research (canslim.blog) is an independent educational publisher. It is not licensed or registered as a broker, investment adviser, research analyst or asset manager in any jurisdiction. This article is general information for education only. It is not investment advice, a research report, an investment recommendation, or an offer or solicitation to buy or sell any security, and it does not consider any reader's objectives, financial situation or needs. No ticker, chart, heading or technical comment is a suggestion to buy, sell, hold or short. Figures come from third-party sources, are not independently verified, and may be incomplete, out of date or wrong. Online sentiment may include rumour, speculation or coordinated posting. Past performance and past price patterns do not predict future results. Investing involves risk, including the loss of capital. This article is not updated after publication. Laws differ by country; seek advice from a licensed professional in your jurisdiction before making any investment decision.
Discover more from CANSLIM Research
Subscribe to get the latest posts sent to your email.