 Andrew
General educational commentary only, generated automatically with AI. Not investment advice or a recommendation to buy, sell or hold any security. Capital is at risk.
AI-Linked Shares Fall as Debt Concerns Build
A sharp reversal in AI-related shares is testing the market, according to the news brief. Nasdaq futures fell about 1% to 1.3% before the open. Weakness spread across global equities. Investors are asking whether the large, debt-funded buildout of AI data centers can deliver returns quickly enough. The brief cites Reuters reporting that credit-default swap spreads for AI-linked companies widened sharply. It also notes fresh focus on CoreWeave's debt. The Russell 2000 has entered correction territory. That suggests pressure has moved beyond the biggest technology names.
Producer Prices Jump and Complicate the Rate Outlook
Inflation is making the backdrop harder. The news brief reports that September producer prices rose 1.3% month over month and 6.3% year over year. Barron's called it the biggest jump in four years. CNBC said it was the largest annual gain since 2022. Both figures came in well above forecasts. Higher inflation can keep interest rates elevated. That can squeeze stock valuations and raise financing costs for data-center projects. The brief also cites CNBC on Treasury yields above 5% and a projected federal deficit near $2 trillion. Bonds strengthened in early trading as investors sought safety.
Banks Report Strong Loans While Earnings Stay Concentrated
Not all the news is weak. The brief notes that major banks report strong credit quality and double-digit business-loan growth. Seeking Alpha described banks as willing to lend. That supports parts of the earnings outlook despite high rates. S&P 500 earnings estimates are rising. But the brief says gains are concentrated in technology and energy. The broader market is less evenly supported. One reading is that index-level estimates may look better than the average company's experience.
Online Sentiment Turns Defensive on Growth Themes
Online sentiment comes from unverified posts by anonymous retail users. It may include rumour or speculation and has not been checked. In this material, the mood shifted from waiting for a rebound to broad pessimism. A fear-and-greed measure cited in the posts sat near 25/100. Some posters noted the VIX had not broken above 20. They argued panic was concentrated in high-beta individual stocks rather than at the index level. The posts described heavy losses across the AI supply chain and memory names. They also described safe-haven strength in defensive sectors and long-duration Treasuries. A KOSPI circuit breaker in South Korea added to the gloom. So did a muted reaction to strong TSMC results. The posts said good news could not lift the market. A few contrarian voices argued sentiment had reached an extreme. None of this is confirmed positioning or institutional flow.
A Screen Flags Index Weakness on Several Measures
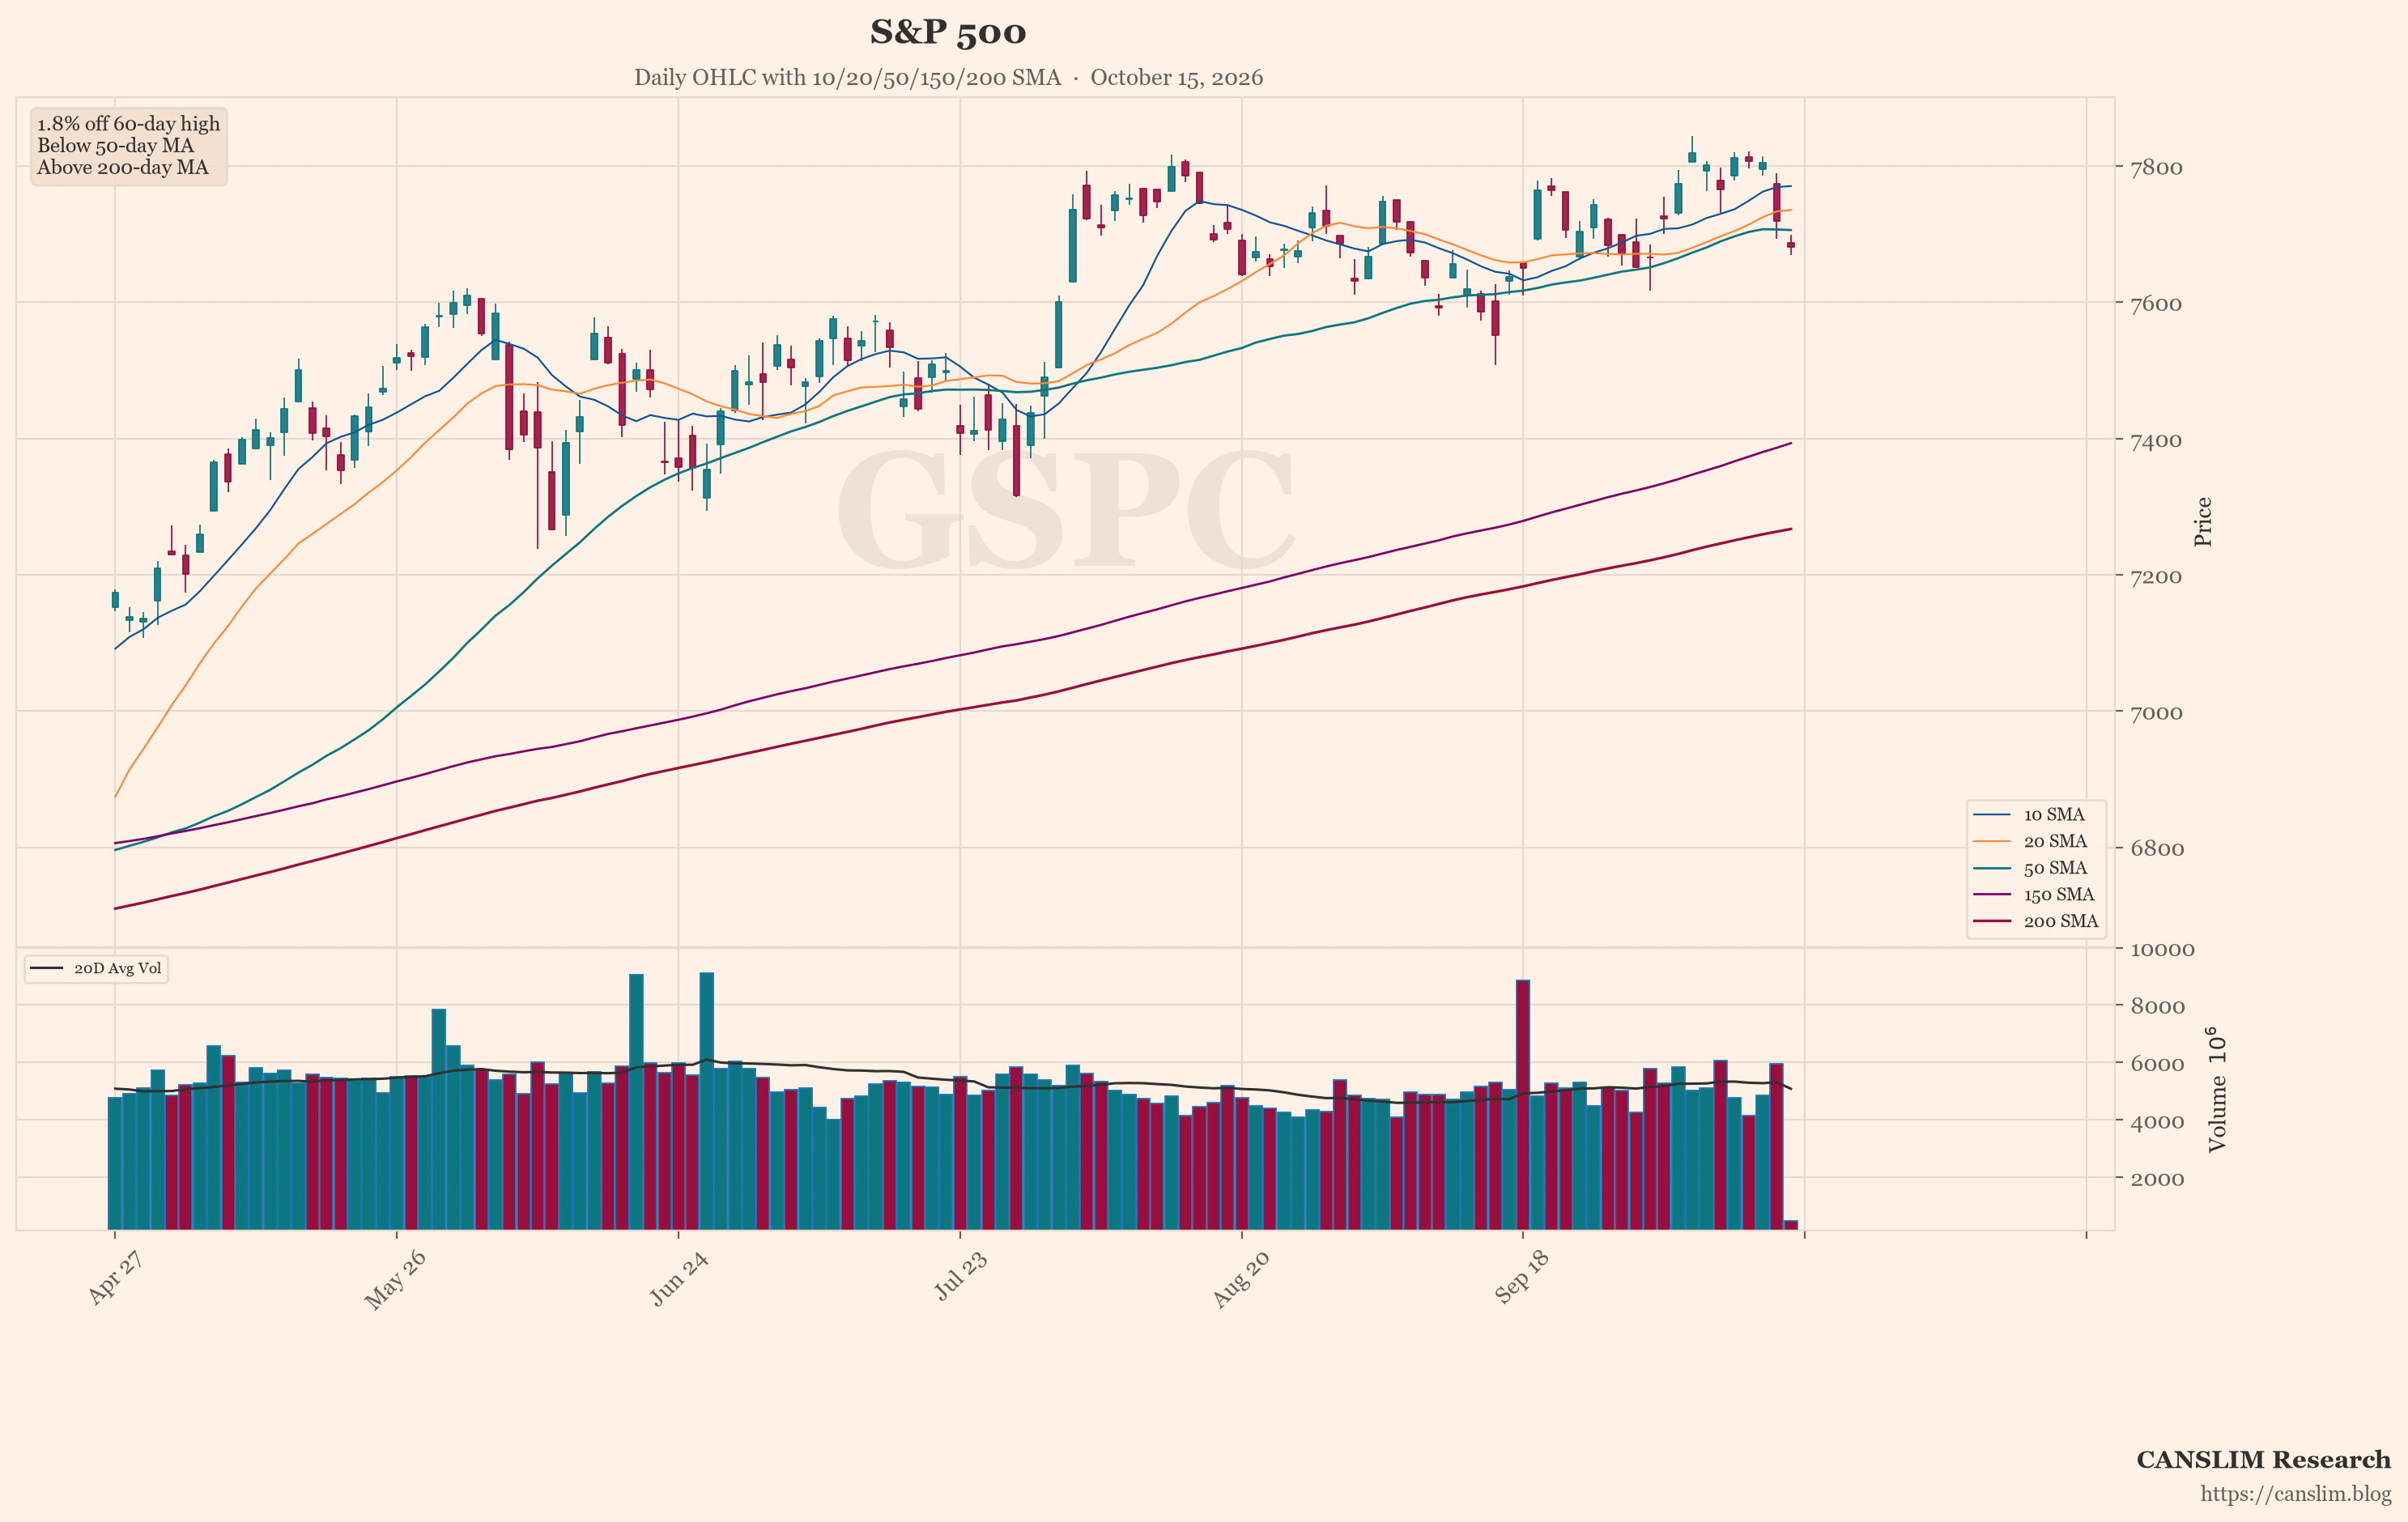
The featured chart shows the S&P 500 (^GSPC). An automated technical screen picked it because, among the indices and stocks it checked, it showed the most weakness on a few measures. Those measures include distance from its recent high, position versus its 50-day and 200-day moving averages, and down days on higher volume. This is one screen, not a full view of the market. Past price patterns do not predict future results. The reading is descriptive, not a signal.
Risks Include Rates, Credit and Narrow Earnings Support
Several risks stand out in the source material. Inflation data could keep rates elevated. Wider credit spreads for AI borrowers could raise funding costs. The brief says the market must digest the inflation data and see whether rates stabilize. Upcoming earnings must support the heavy investment behind the AI trade. If earnings momentum stays concentrated in technology and energy, the rest of the market may lack support. The Russell 2000 correction shows weakness is not limited to large caps. Online posts also flagged a space-sector setback after a rocket launch delay. One interpretation is that investors are demanding clearer proof of returns. Another is that sentiment itself has become a risk, because crowded pessimism can swing quickly in either direction.
Conditions Remain Mixed as Data and Earnings Diverge
The sources describe a market pulled in two directions. AI debt concerns, hot producer prices and rising yields weigh on valuations. Strong bank lending and rising index earnings estimates offer some balance. Online sentiment leans fearful, but that sentiment is unverified and may not reflect real positioning. The screen on the S&P 500 shows technical weakness on several measures, though one screen is not a full view. The path ahead depends on inflation data, rate stability and whether earnings broaden beyond a few sectors. Uncertainty remains high, and the sources do not agree on how long it will last.
Sources: a third-party AI-generated market news summary, and an AI summary of unverified posts by anonymous retail users online. This article was written by an AI language model from those summaries and published automatically without human review. Updated 2026-10-15 22:00 HKT.
CANSLIM Research (canslim.blog) is an independent educational publisher. It is not licensed or registered as a broker, investment adviser, research analyst or asset manager in any jurisdiction. This article is general information for education only. It is not investment advice, a research report, an investment recommendation, or an offer or solicitation to buy or sell any security, and it does not consider any reader's objectives, financial situation or needs. No ticker, chart, heading or technical comment is a suggestion to buy, sell, hold or short. Figures come from third-party sources, are not independently verified, and may be incomplete, out of date or wrong. Online sentiment may include rumour, speculation or coordinated posting. Past performance and past price patterns do not predict future results. Investing involves risk, including the loss of capital. This article is not updated after publication. Laws differ by country; seek advice from a licensed professional in your jurisdiction before making any investment decision.
Discover more from CANSLIM Research
Subscribe to get the latest posts sent to your email.