Andrew (Content Generated by AI)
General educational commentary only, generated automatically with AI. Not investment advice or a recommendation to buy, sell or hold any security. Capital is at risk.
Weaker Hiring Report Lifts Major Indexes
Stocks closed higher on Friday after the September hiring report came in below expectations. The news brief, citing Barron's and the Wall Street Journal, said the soft data eased concern that the Federal Reserve would raise rates again this month. The Nasdaq led the advance, helped by chip stocks and other technology shares. The S&P 500 and Dow also finished higher.
The report was not a clear positive. Unemployment rose and wage growth slowed. The brief said this points to a labor market losing momentum. Businesses still face higher costs. One reading is that slower hiring may reduce rate pressure, but it also signals softer demand.
Treasury Yields Keep Pressure on Valuations
Rising Treasury yields tempered the market's relief. The brief said yields added to their weekly gains and continued to weigh on stock valuations. This tension matters. Softer employment may lower the chance of more Fed tightening. But persistent inflation and higher borrowing costs remain risks.
The social sentiment report, based on unverified posts by anonymous retail users online, noted a split between stocks and bonds. It said the 10-year yield briefly fell in the morning, then climbed again in the afternoon. Posts described a gap where weak data helped stocks but not bonds. This chatter may include rumour or speculation and has not been checked.
Technology and Chip Shares Lead While Breadth Stays Narrow
Technology and semiconductor shares led the rally. The brief said AI-related gains have outpaced much of the market. This has raised questions about earnings growth and credit risk elsewhere. Investors are watching whether the advance spreads beyond tech.
Online sentiment echoed this concern. Anonymous retail posts said only a few stocks were holding up the indexes. Many users described a gap between index gains and weaker individual holdings. The sentiment report called this a "K-shaped" market. This is unverified commentary, not confirmed positioning. One interpretation is that narrow leadership can make broad index strength look better than the average stock.
Storage Shares Fall on Capacity News
The sentiment report said hard-drive stocks fell sharply. It cited a Nikkei report that Toshiba plans to double HDD capacity in fiscal 2027. The report said STX closed at 848.78, down 10.23%, and WDC closed at 415.37, down 10.17%. It said MU closed at 1074.71, down 2.13%. The report also said some banks considered the sell-off overdone. These figures come from the third-party summary and were not independently checked.
The same report said AI hardware and Musk-linked names gained. It listed AMD at 633.75, up 2.92%, and AVGO up 3.29%. It also mentioned TSLA up 4.64%. These are reported moves, not signals. The brief separately noted that AI investment and strong chip-sector results are supporting optimism ahead of earnings season, though expectations are high.
Oil, Geopolitics and the Week Ahead
The brief said G7 plans to release emergency fuel reserves pushed oil prices lower. This eased some near-term energy-cost pressure. A MarketWatch headline said European leaders are rushing to release diesel from stockpiles. The sentiment report mentioned Middle East tensions and said some claims about troop movements and a tanker explosion were community rumours. Those claims are unverified and may be false.
Next week, the Fed's September meeting minutes should offer clues on how policymakers weigh inflation against a cooling labor market. Earnings season is also approaching. The brief said investors are looking for results to support elevated expectations, especially in AI and semiconductors. Oil prices, bond yields and the response to the jobs data will help determine whether Friday's advance can hold.
Chart Screen Shows One Index with More Weakness
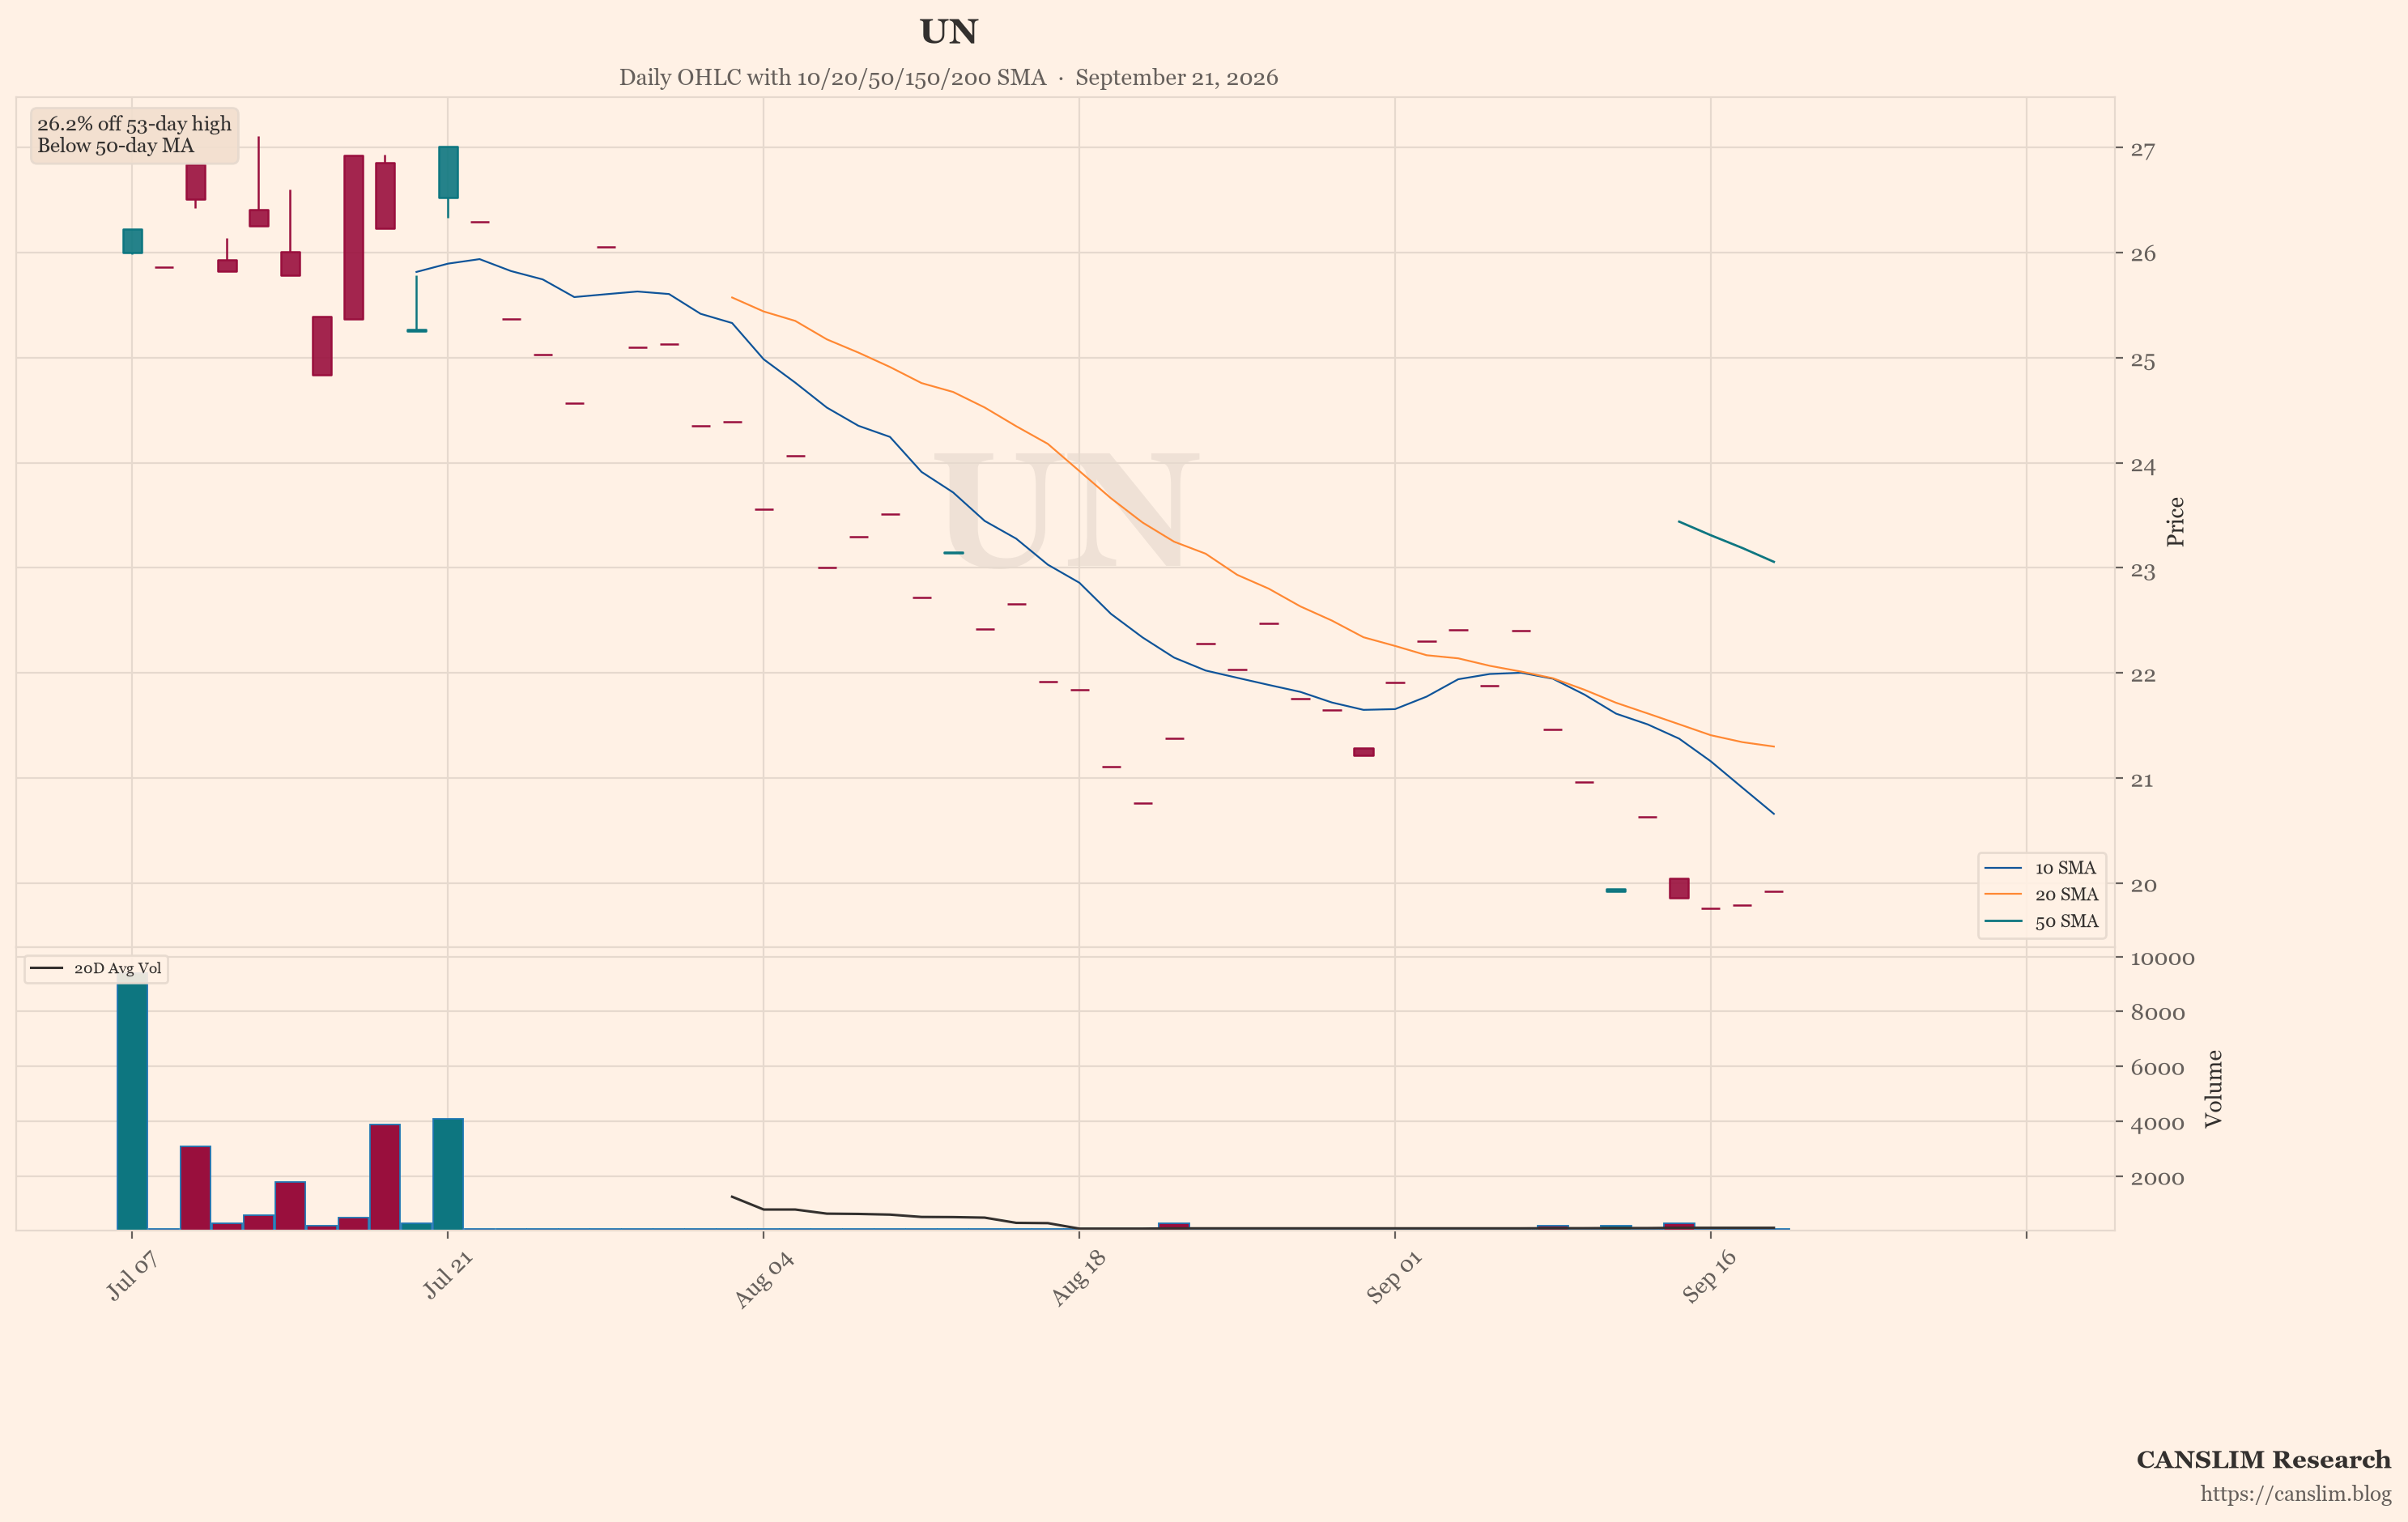
The featured chart shows the Dow Jones Industrial Average (^DJI). An automated technical screen picked it because, among the indices and stocks it checked, it showed the most weakness on a few measures. These included distance from its recent high, position versus its 50-day and 200-day moving averages, and down days on higher volume. This is a factual description of one screen. One screen is not a full view. Past price patterns do not predict future results.
Mixed Signals Leave Direction Uncertain
Conditions remain mixed. Softer hiring data helped stocks, but rising yields and high expectations for AI earnings are unresolved. Breadth is narrow, and online sentiment suggests many retail users see weakness under the surface. That sentiment is unverified and may include rumour. Risks include persistent inflation, higher borrowing costs, geopolitical tension and earnings that fail to meet lofty forecasts. The Fed minutes and the coming earnings season may clarify the picture. For now, the sources describe a market lifted by a few groups while other areas lag.
Sources: a third-party AI-generated market news summary, and an AI summary of unverified posts by anonymous retail users online. This article was written by an AI language model from those summaries and published automatically without human review. Updated 2026-10-03 10:03 HKT.
CANSLIM Research (canslim.blog) is an independent educational publisher. It is not licensed or registered as a broker, investment adviser, research analyst or asset manager in any jurisdiction. This article is general information for education only. It is not investment advice, a research report, an investment recommendation, or an offer or solicitation to buy or sell any security, and it does not consider any reader's objectives, financial situation or needs. No ticker, chart, heading or technical comment is a suggestion to buy, sell, hold or short. Figures come from third-party sources, are not independently verified, and may be incomplete, out of date or wrong. Online sentiment may include rumour, speculation or coordinated posting. Past performance and past price patterns do not predict future results. Investing involves risk, including the loss of capital. This article is not updated after publication. Laws differ by country; seek advice from a licensed professional in your jurisdiction before making any investment decision.
Discover more from CANSLIM Research
Subscribe to get the latest posts sent to your email.