
 Andrew
General educational commentary only, generated automatically with AI. Not investment advice or a recommendation to buy, sell or hold any security. Capital is at risk.
September CPI Comes in above Forecast
The September consumer price report was hotter than expected. According to CNBC and The Wall Street Journal, consumer prices rose 0.6% for the month. The annual rate reached 3.7%, up from 3.4% in August. That topped the 3.6% forecast.
Energy costs linked to the Iran war are a major driver. CNBC also reported on a diesel supply squeeze. The IEA said supply fell 1.7 million barrels a day in the third quarter. It warned the squeeze could last well into 2027.
Reuters reported that a Fed rate hike looks more likely after the data. Fed Vice Chair Michelle Bowman said officials have time to wait and see before any more action, according to Reuters. The news brief notes this raises the risk that rate cuts are delayed.
Index Calm Hides Weak Breadth and Small-Cap Lag
Major benchmarks remain near highs. But the news brief points to strain under the surface. Small caps have lagged. Market breadth is weak. Seeking Alpha described dismal breadth, stretched valuations and semiconductors turning over. Schaeffers Research focused on small-cap weakness and market history.
This may suggest the gains in major indexes are not shared widely. One reading is that index-level calm can mask weakness in smaller shares. The news brief treats this as a sign of strain, not a forecast.
Chip Shares Pull Back as AI Spending Questions Remain
Chip stocks have pulled back. The news brief cites valuation concerns and worries about the scale of AI investment. This is a neutral-to-negative theme in the source material.
ASML said demand for chipmaking equipment is surging. It raised full-year guidance for the third time this year, per the social sentiment report. Its CEO said customers were asking about orders for 2029 to 2030. Still, the report notes its US ADR closed Tuesday at 1716.64, down 1.94%.
Fastenal beat quarterly earnings expectations. Barron's framed this as a positive signal about industrial demand. The news brief lists this as a bullish item amid broader concerns.
Online Sentiment Turns Fearful after the Inflation Print
Online sentiment comes from unverified posts by anonymous retail users. It may include rumour or speculation and has not been checked. It is not institutional flow or confirmed positioning.
The social sentiment report describes the mood as bearish and chaotic. A fear/greed reading leaned toward fear at about 35/100. Posts flipped from betting on cool pre-election data to self-mockery after the CPI release. Some users called the selloff an overreaction. Others pointed to margin calls and losses in high-beta areas.
The report says holders of memory names, neocloud providers and small caps were close to capitulation. VIX-related instruments barely moved, so there was no real panic at the index level. At the theme level, online discussion centred on CPI, Treasury yields and the memory/AI narrative. These posts are unverified and should not be treated as fact.
Chart Screen Flags Dow Weakness on Several Measures
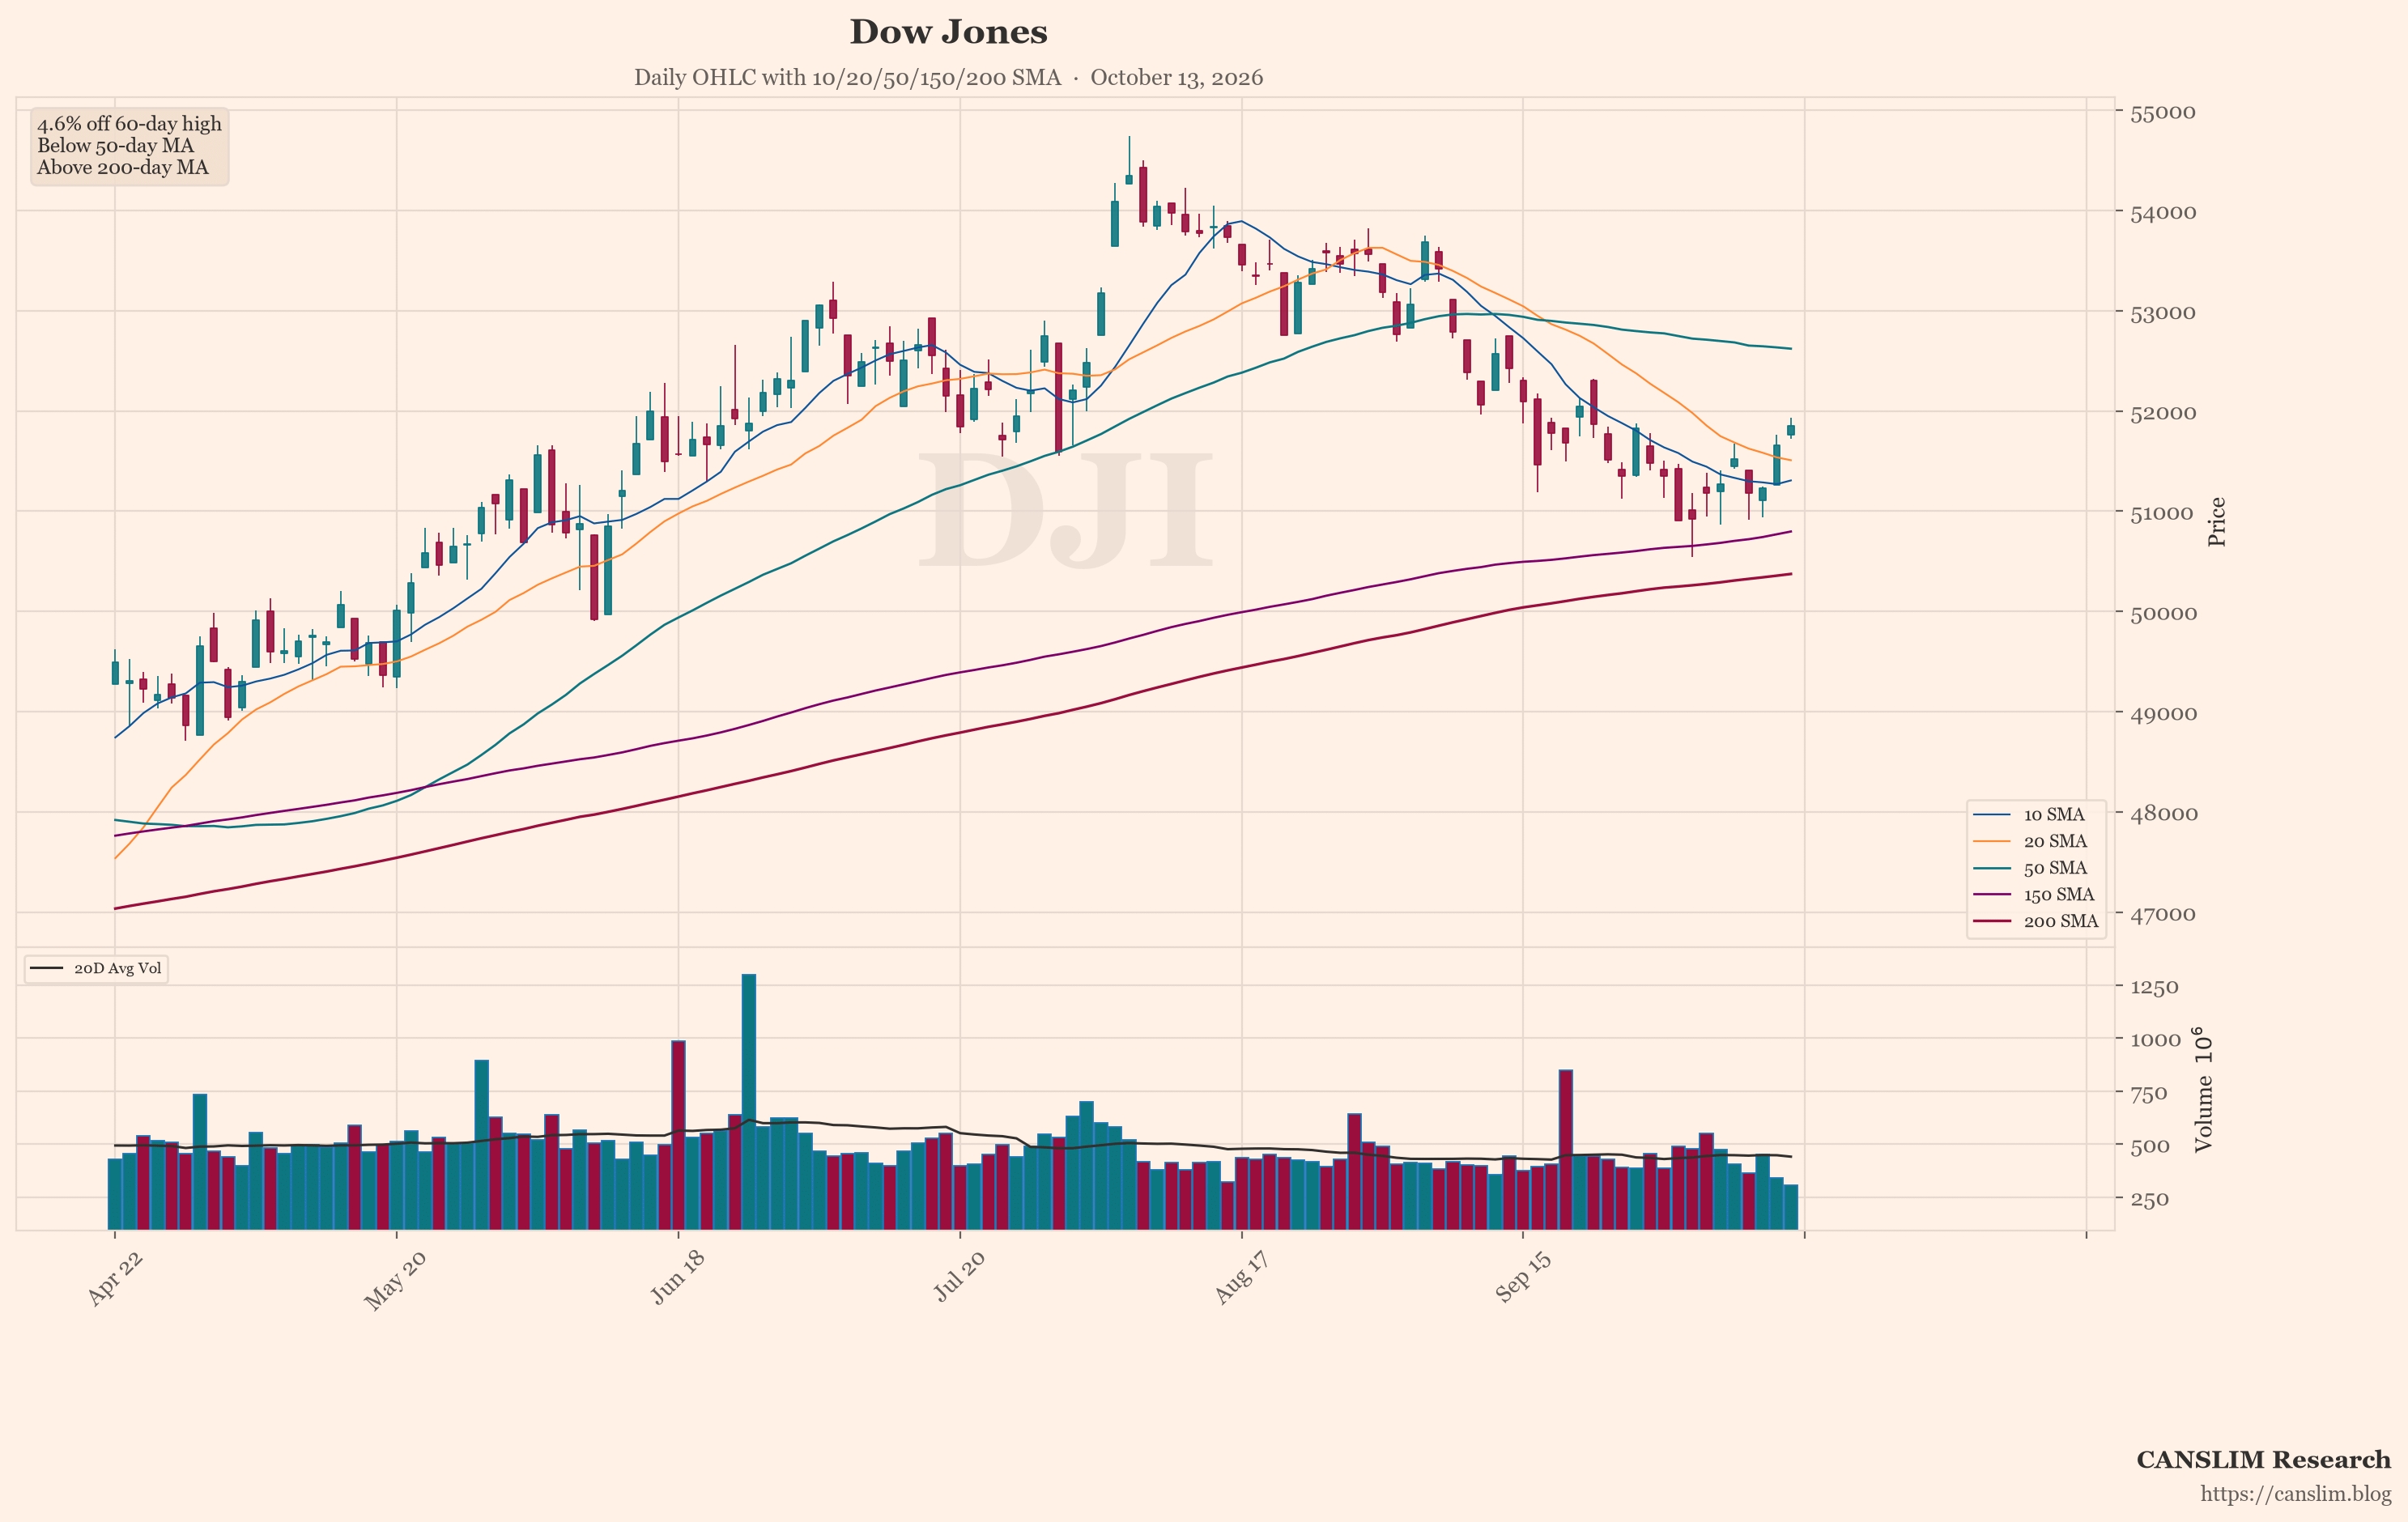
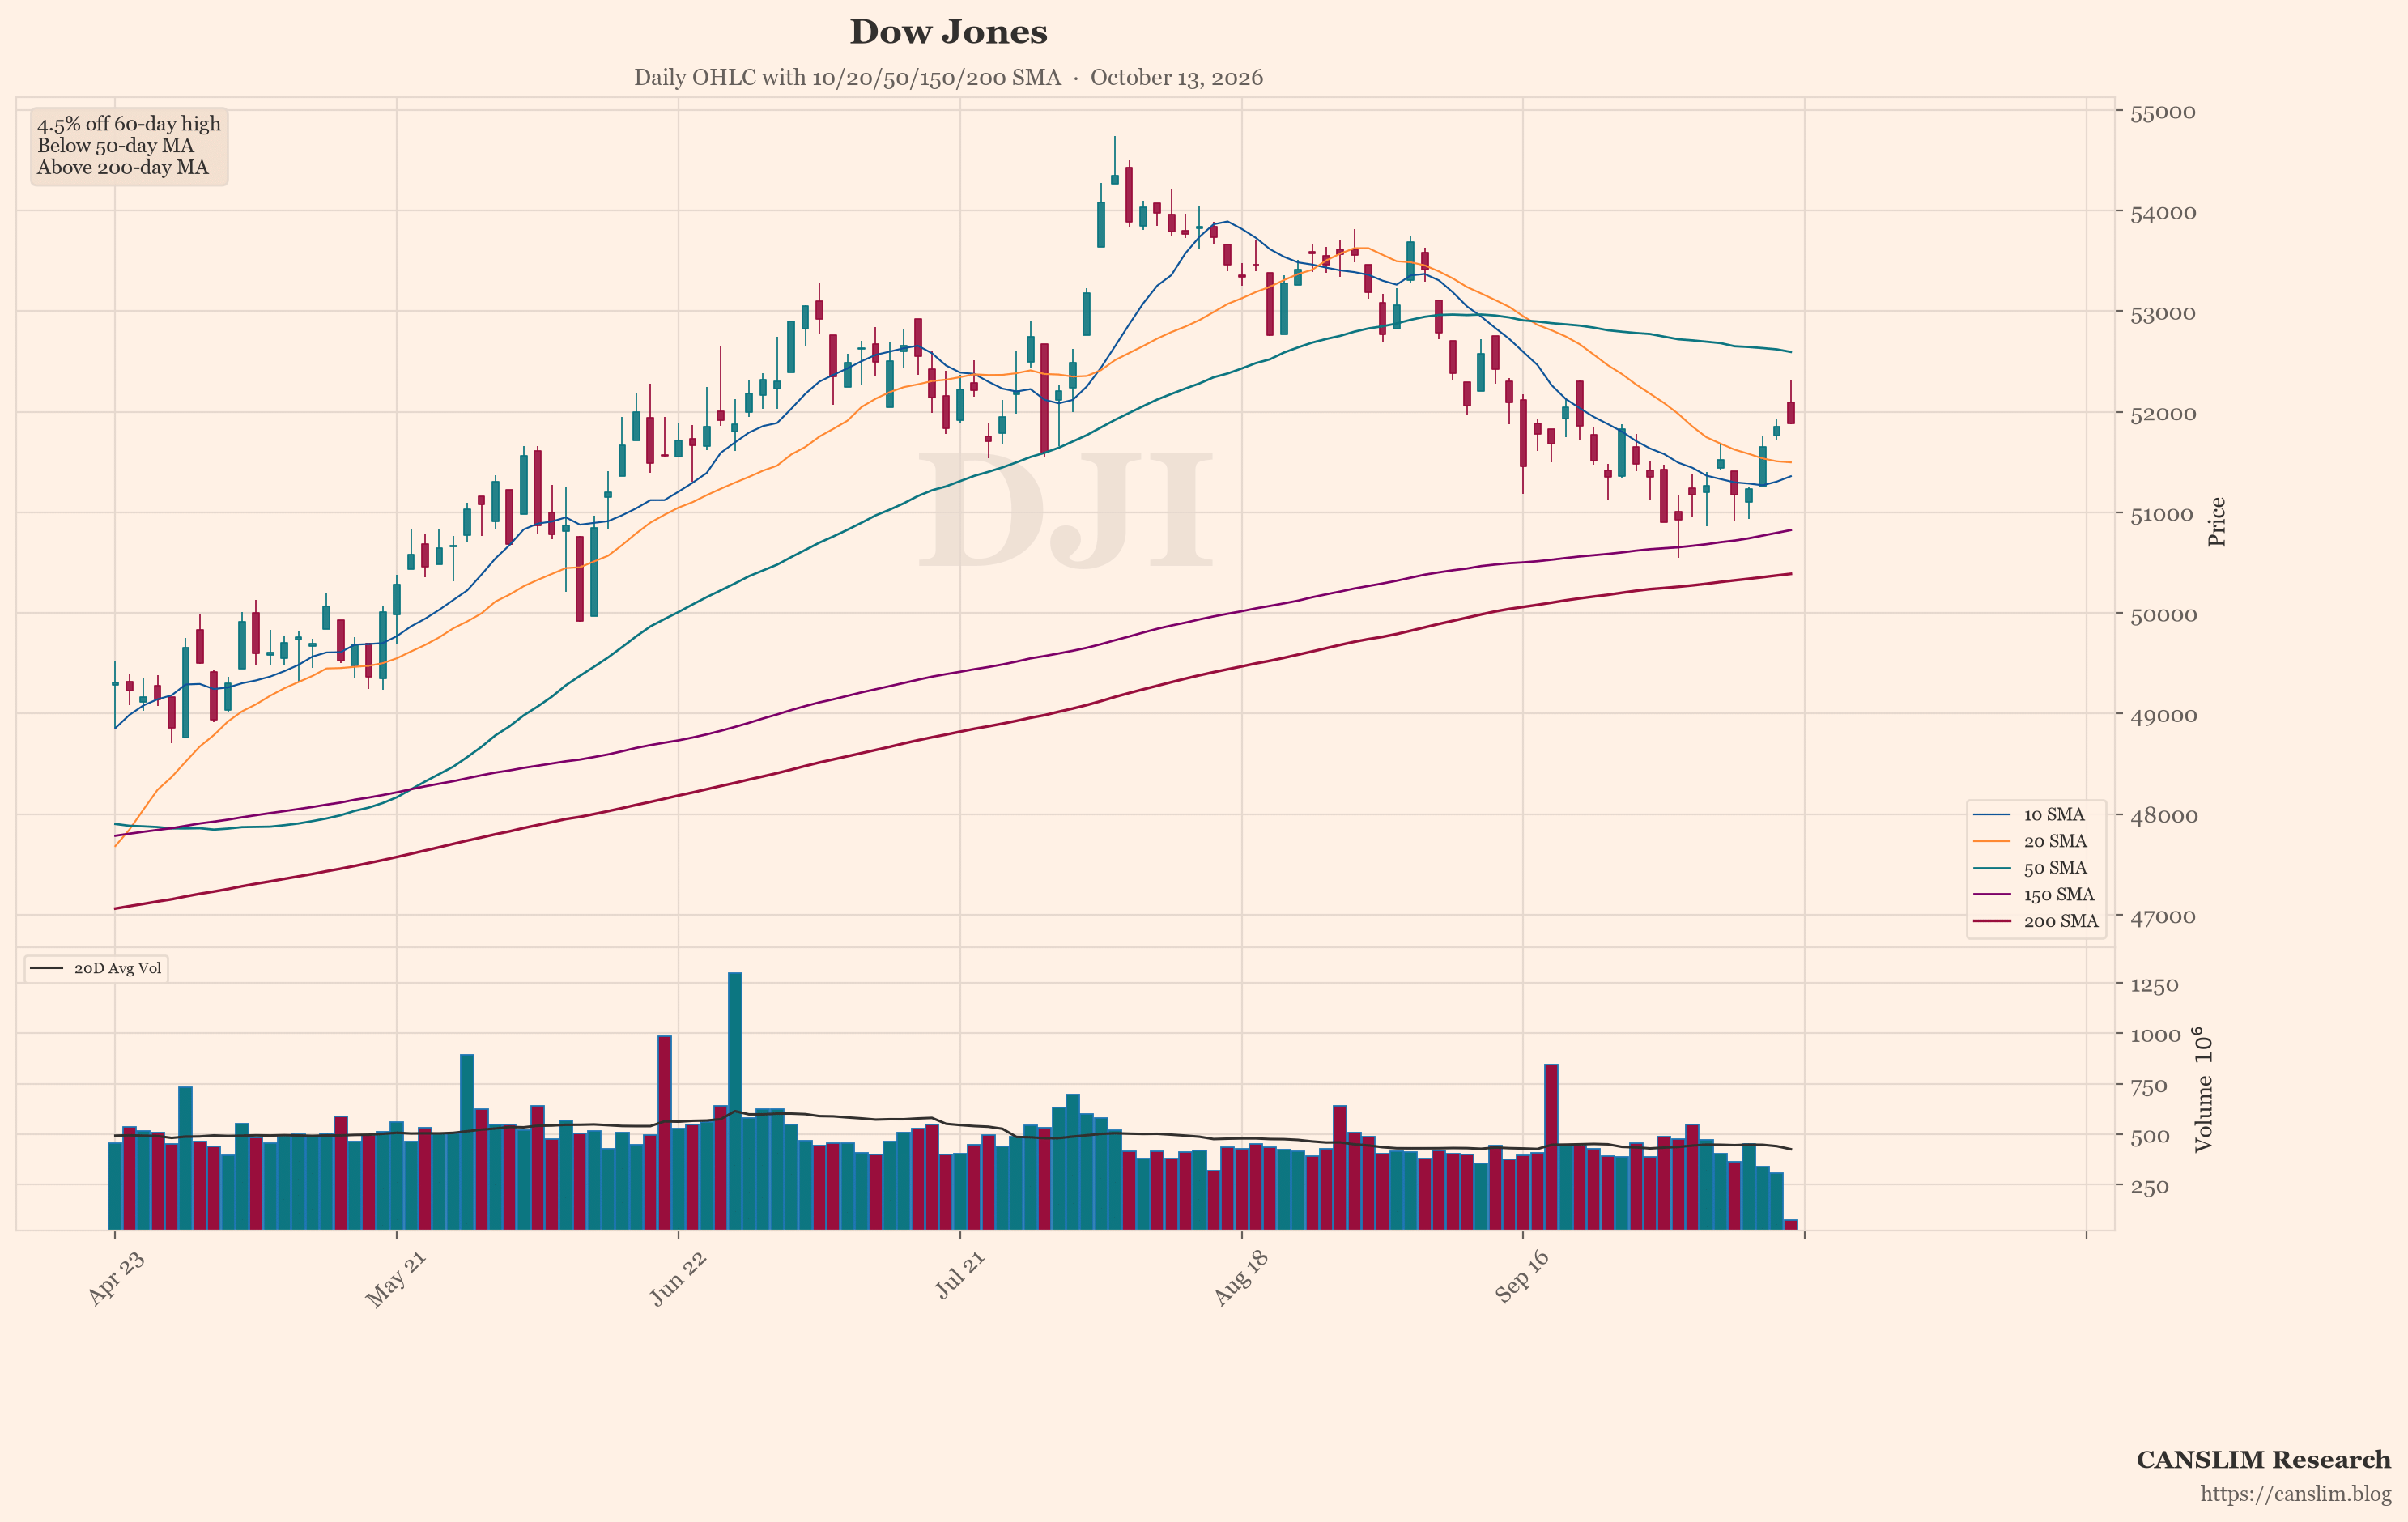
The featured chart shows the Dow Jones (^DJI). An automated technical screen picked it because, among the items it checked, it showed the most weakness on a few measures. These were distance from its recent high, position versus its 50-day and 200-day moving averages, and down days on higher volume.
This is one screen, not a full view. Past price patterns do not predict future results. The screen is not a signal to act.
Risks Include Rates, Energy and Narrow Leadership
Several risks stand out in the source material. Higher-for-longer rates could pressure bonds, borrowing-sensitive businesses and richly valued growth stocks. The diesel squeeze could keep inflation elevated into 2027. Bank earnings may show how credit and demand are holding up.
Weak breadth and small-cap lag are also risks. If gains stay concentrated in large caps, the market may be more fragile than the indexes suggest. Chip shares face valuation questions and uncertainty about AI spending. Online sentiment is fearful, but it is unverified and may overstate or understate conditions.
Conditions mix near-record indexes with weak breadth, hot inflation and cautious online sentiment. The path depends on yields, energy supply and earnings. Uncertainty remains high.
Sources: a third-party AI-generated market news summary, and an AI summary of unverified posts by anonymous retail users online. This article was written by an AI language model from those summaries and published automatically without human review. Updated 2026-10-14 22:00 HKT.
CANSLIM Research (canslim.blog) is an independent educational publisher. It is not licensed or registered as a broker, investment adviser, research analyst or asset manager in any jurisdiction. This article is general information for education only. It is not investment advice, a research report, an investment recommendation, or an offer or solicitation to buy or sell any security, and it does not consider any reader's objectives, financial situation or needs. No ticker, chart, heading or technical comment is a suggestion to buy, sell, hold or short. Figures come from third-party sources, are not independently verified, and may be incomplete, out of date or wrong. Online sentiment may include rumour, speculation or coordinated posting. Past performance and past price patterns do not predict future results. Investing involves risk, including the loss of capital. This article is not updated after publication. Laws differ by country; seek advice from a licensed professional in your jurisdiction before making any investment decision.
Discover more from CANSLIM Research
Subscribe to get the latest posts sent to your email.