Andrew
General educational commentary only, generated automatically with AI. Not investment advice or a recommendation to buy, sell or hold any security. Capital is at risk.
Index Sets Record While Participation Stays Thin
The S&P 500 closed above 7,800 for the first time, according to CNBC International TV. The news brief describes the rally as unusually narrow. AI-linked megacaps and chipmakers are doing much of the work. Fewer than half of S&P 500 stocks were above their 200-day moving average. That gap matters. A strong index headline can mask weaker breadth. One reading is that the market may be more exposed if enthusiasm for AI spending cools. Past price patterns do not predict future results.
Rising Yields and Mortgage Rates Add Pressure
Treasury yields are rising ahead of a closely watched 10-year auction and Fed minutes, CNBC reports. The news brief notes uncertainty over whether the Fed's September hike begins a broader tightening cycle. Higher yields could pressure stock valuations. The average 30-year mortgage rate rose to 7.49%, per CNBC. Purchase applications fell 2% for the week and were down 15% from a year earlier. Resilient September activity and healthy consumer spending offer some support, the brief adds. Still, households are drawing down savings as income growth moderates.
AI Spending Faces Financing Questions
Analysts are warning that heavy spending, debt costs, and limited evidence of broad productivity gains could slow the AI investment cycle, according to the news brief. Seeking Alpha pieces titled "The AI Capex Wall" and "Wall Street Highs And AI Bubble Risks" raise similar themes. The key questions are whether AI investment can earn adequate returns and whether companies can keep funding the build-out. This may suggest the rally's durability depends on profits, not just enthusiasm. Q3 earnings are a near-term test.
Online Posts Show Fear despite Small Index Declines
Online sentiment comes from unverified posts by anonymous retail users. It may include rumour or speculation and has not been checked. In these posts, the mood turned fearful. One widely shared measure put fear/greed near 35/100. Indexes were down only about 0.5% to 0.9%, yet some posts used extreme language. Leveraged positions in memory and semiconductor themes showed deeper losses than the indexes. Some posts described panic; others called for rebounds. This is sentiment at the theme level only, not confirmed positioning.
Bond Yields Dominate Anonymous Discussion
The most discussed theme in anonymous posts was long-dated bond yields. Posts cited 10-year yields near 5.35% and said 20-year and 30-year yields were approaching 5.8%. Some posts argued yields now actively suppress valuations. Others expected a rebound after the 10-year auction. A smaller group compared credit-market signals to 2007. These claims are unverified. The news brief separately notes Treasury yields rose ahead of the auction and Fed minutes. One interpretation is that rate uncertainty is now a central topic for both professional commentary and retail posts.
Chart Screen Flags Dow Weakness on Several Measures
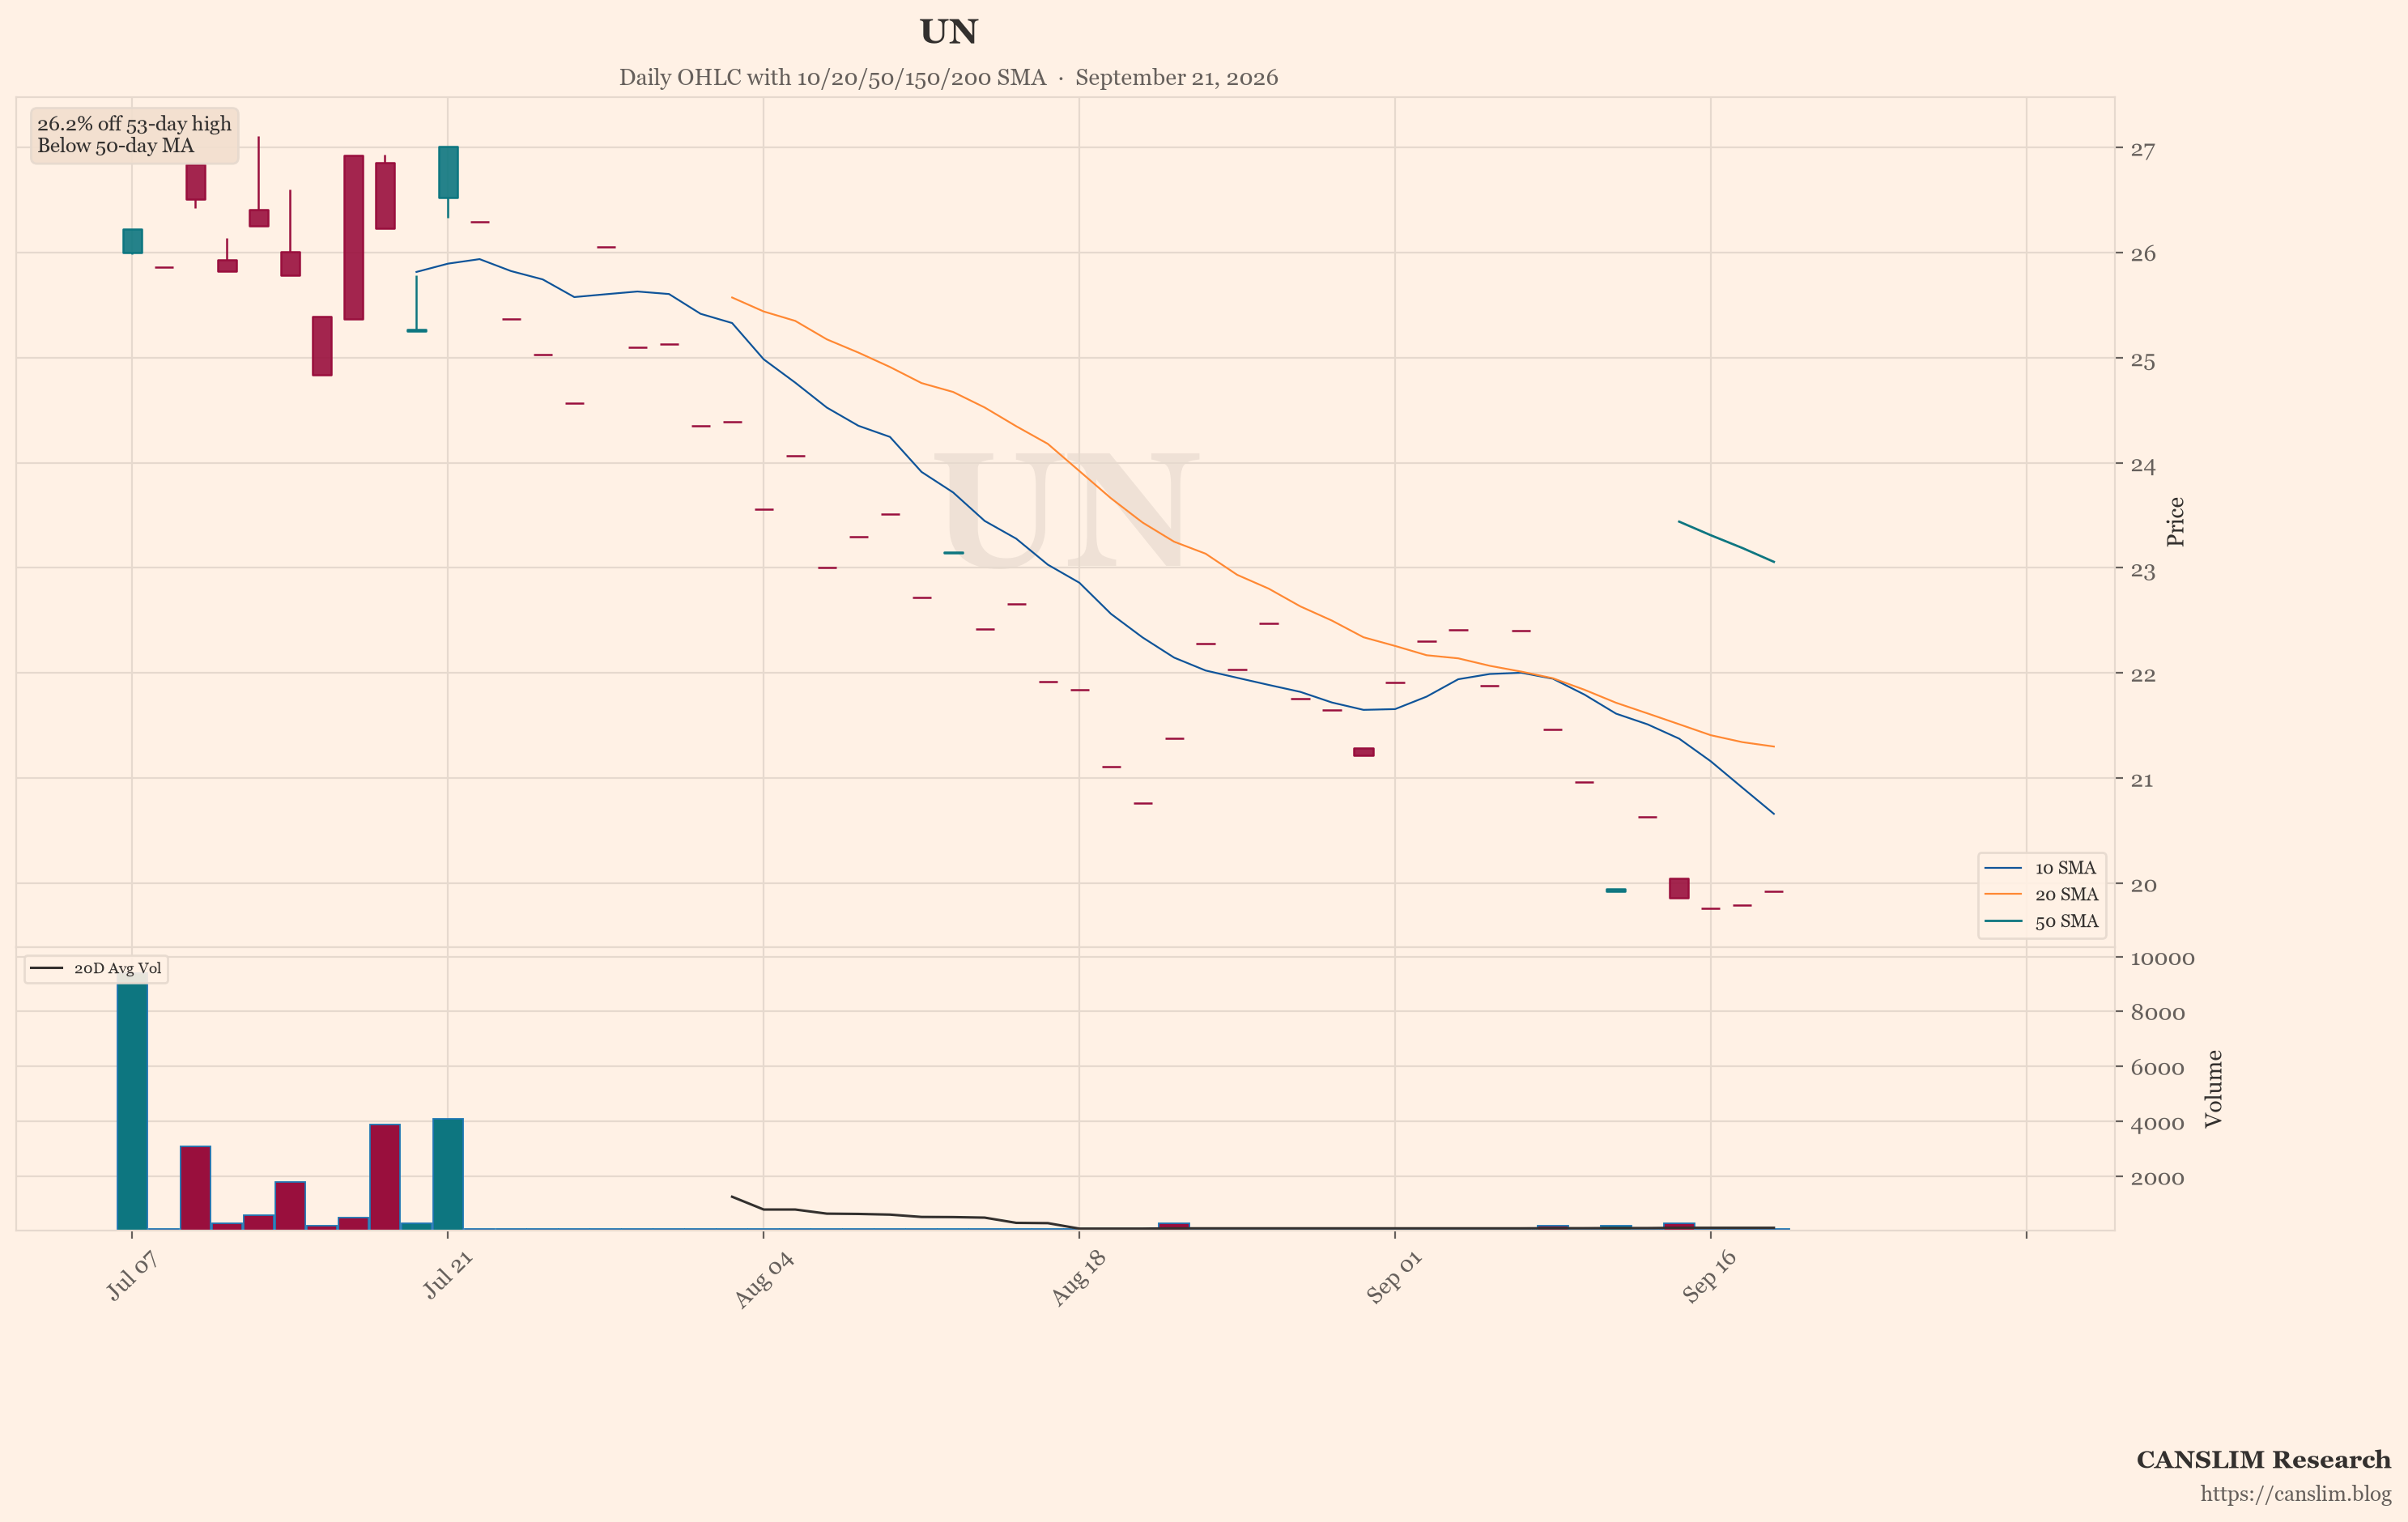
The featured chart shows the Dow Jones (^DJI). An automated technical screen picked it because, among the indices and stocks it checked, it showed the most weakness on a few measures. These include distance from its recent high, position versus its 50-day and 200-day moving averages, and down days on higher volume. This is one screen, not a full view. It is not a signal about the index's prospects. Past price patterns do not predict future results.
Records Rest on Narrow Leadership and Rate Questions
Conditions are mixed. The S&P 500 set a record, but breadth stayed thin. AI spending faces financing and return questions. Yields and mortgage rates are elevated. Consumer spending is resilient, but savings are shrinking. Anonymous posts show fear even as index declines stay modest. Near-term tests include Q3 earnings, the 10-year auction, and the Fed minutes. Whether profits and policy expectations can support the rally beyond a handful of stocks remains uncertain.
Sources: a third-party AI-generated market news summary, and an AI summary of unverified posts by anonymous retail users online. This article was written by an AI language model from those summaries and published automatically without human review. Updated 2026-10-07 22:00 HKT.
CANSLIM Research (canslim.blog) is an independent educational publisher. It is not licensed or registered as a broker, investment adviser, research analyst or asset manager in any jurisdiction. This article is general information for education only. It is not investment advice, a research report, an investment recommendation, or an offer or solicitation to buy or sell any security, and it does not consider any reader's objectives, financial situation or needs. No ticker, chart, heading or technical comment is a suggestion to buy, sell, hold or short. Figures come from third-party sources, are not independently verified, and may be incomplete, out of date or wrong. Online sentiment may include rumour, speculation or coordinated posting. Past performance and past price patterns do not predict future results. Investing involves risk, including the loss of capital. This article is not updated after publication. Laws differ by country; seek advice from a licensed professional in your jurisdiction before making any investment decision.
Discover more from CANSLIM Research
Subscribe to get the latest posts sent to your email.