Andrew
General educational commentary only, generated automatically with AI. Not investment advice or a recommendation to buy, sell or hold any security. Capital is at risk.
S&P 500 Slips as October Begins with Little Momentum
The S&P 500 fell 0.28% last week to 7,722.72, according to the market brief. Futures were roughly flat on Monday. The brief describes the index as resilient but uneven. A weak September jobs report reduced expectations for another near-term Fed rate increase. However, the brief says this did not resolve the bigger concern for equities. Borrowing costs remain high, with the 10-year Treasury yield near 5.26%. CNBC reported that Treasury yields inched lower as investors pared back Fed rate hike bets. One reading is that softer jobs data helped at the margin, but the level of yields still matters for stock valuations.
Technology Leadership Supports Indexes While Other Stocks Lag
The market brief reports that technology and semiconductor leaders continue to support returns. Many other stocks lag behind. This makes market breadth a key risk to watch, according to the brief. The index can hold up while fewer stocks participate. If leadership weakens, the brief suggests the index could become vulnerable. This is a description of what has happened, not a signal. Growth-stock methods often track breadth and leadership, but past patterns do not predict future results.
Fed Minutes and Early Earnings Fill the Calendar
This week, the brief says investors will weigh the Fed's meeting minutes, fresh economic data and early earnings from Delta, PepsiCo and Levi Strauss. The brief notes that strong earnings growth remains a central argument for the bull market. It adds that earnings will need to offset elevated rates and uneven participation. The brief does not give specific earnings figures. Investopedia and Invezz published previews of the week ahead, according to the source list. The outcome of these reports is uncertain.
French Fiscal Stress and a Weak Euro Add Pressure
Overseas, French fiscal strains and political uncertainty in France and Spain have pushed the euro to a 17-month low, according to the brief. CNBC and Reuters both covered the euro's move. The Wall Street Journal reported that U.S. stock futures were steady as French fiscal pressure raised contagion risk. The brief says this could keep global bond markets unsettled. One interpretation is that overseas fiscal worries may add to the cost of borrowing in the U.S. if global bond markets stay tense. That chain of events is not certain.
Oil Supply Signals Conflict as Inventories Stay Low
Energy is another key variable. Saudi Aramco's CEO warned that rebuilding depleted oil inventories could take up to two years, CNBC reported. At the same time, Saudi Arabia cut its selling price to Asia, and some shipments through the Strait of Hormuz resumed. The brief calls these signals conflicting. They matter for inflation, yields and corporate costs. The brief does not state a specific oil price. The direction of oil supply and prices remains uncertain.
Online Sentiment Shows Caution beneath a Defiant Tone
Online sentiment comes from unverified posts by anonymous retail users. It may include rumour or speculation and has not been checked. The social sentiment report describes the overall mood as neutral with a cautious tilt. Posts were outwardly defiant but showed rising anxiety, according to the report. The report says the community's verbal panic about a "red market" far exceeded the actual move in index prices. It also notes that weakness in memory stocks and in one chip name was real and matched some complaints. The report mentions large all-in bets and short-dated option discussions continuing as usual. These are unverified posts, not confirmed positioning. The report adds that mentions of dollar strength, a rising VIX and higher long-term yields suggest less willingness to chase highs than the prior week. The report lists several widely discussed tickers, but no individual stock is named here with any social-media stance. At the theme level, the report says interest rates, oil prices and memory-stock pullbacks were the real concerns, not the Russia health story. That story drew the most comments but was mostly treated as memes, according to the report.
Chart Screen Flags One Index on Weakness Measures
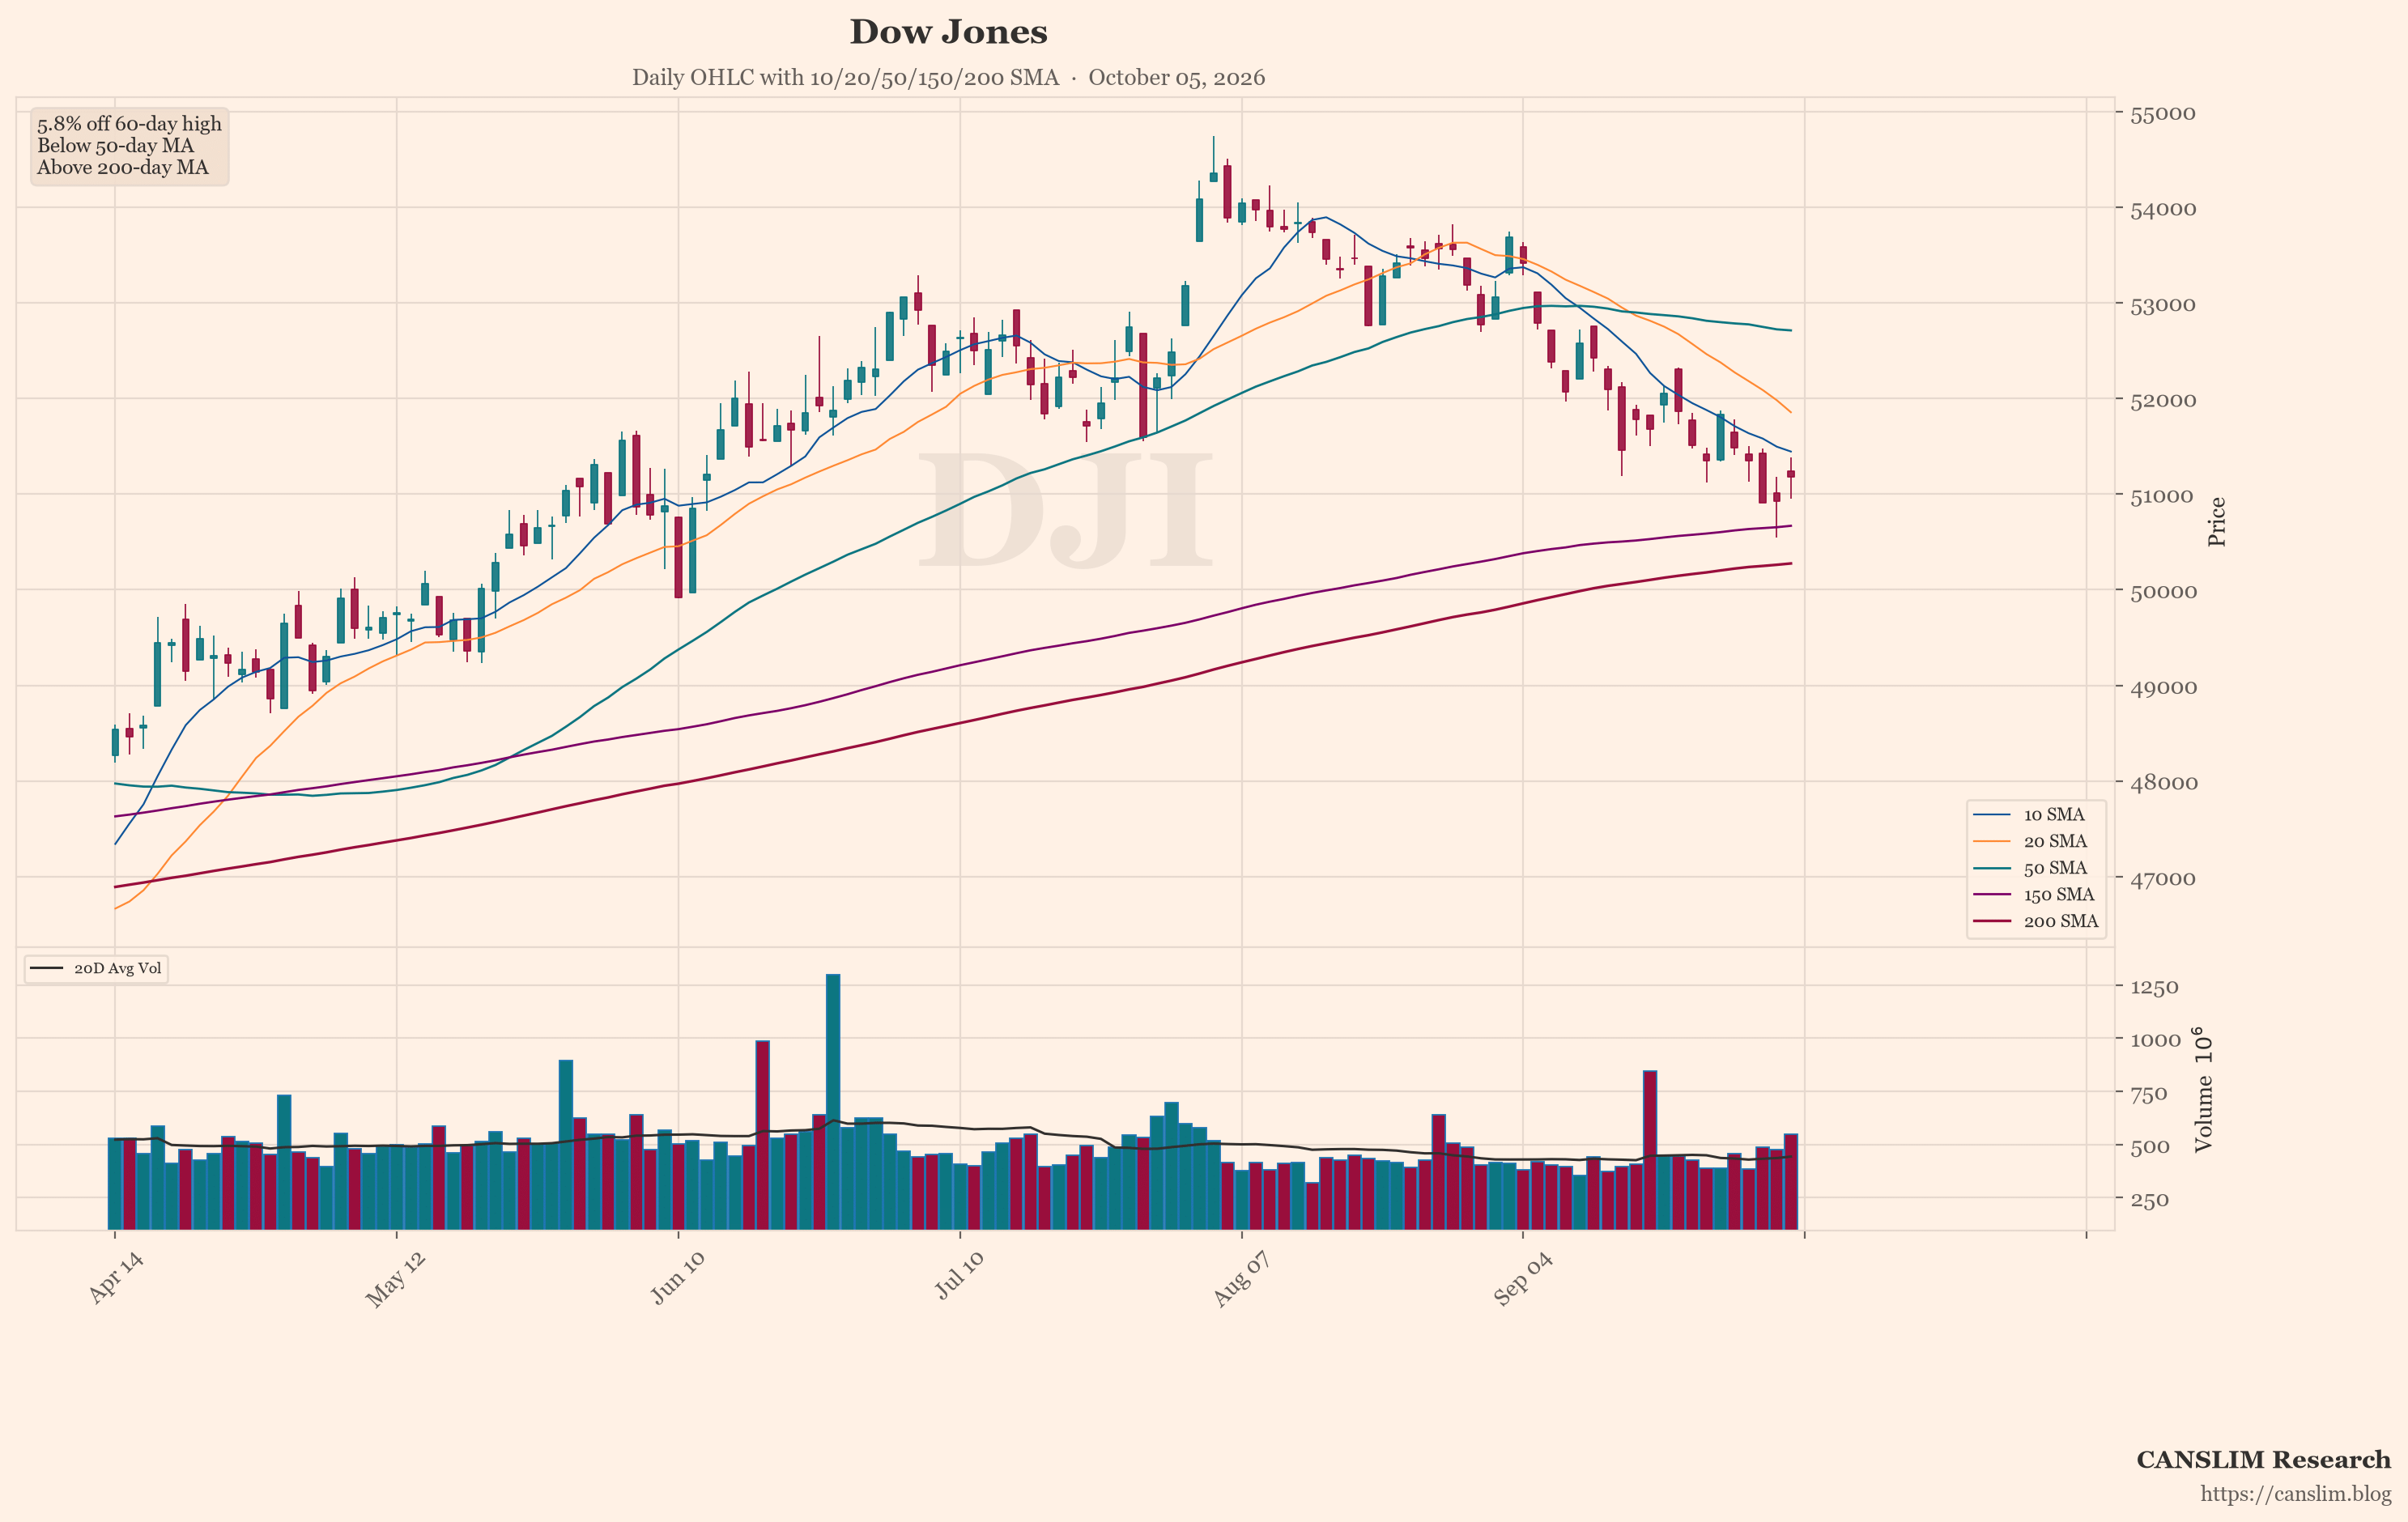
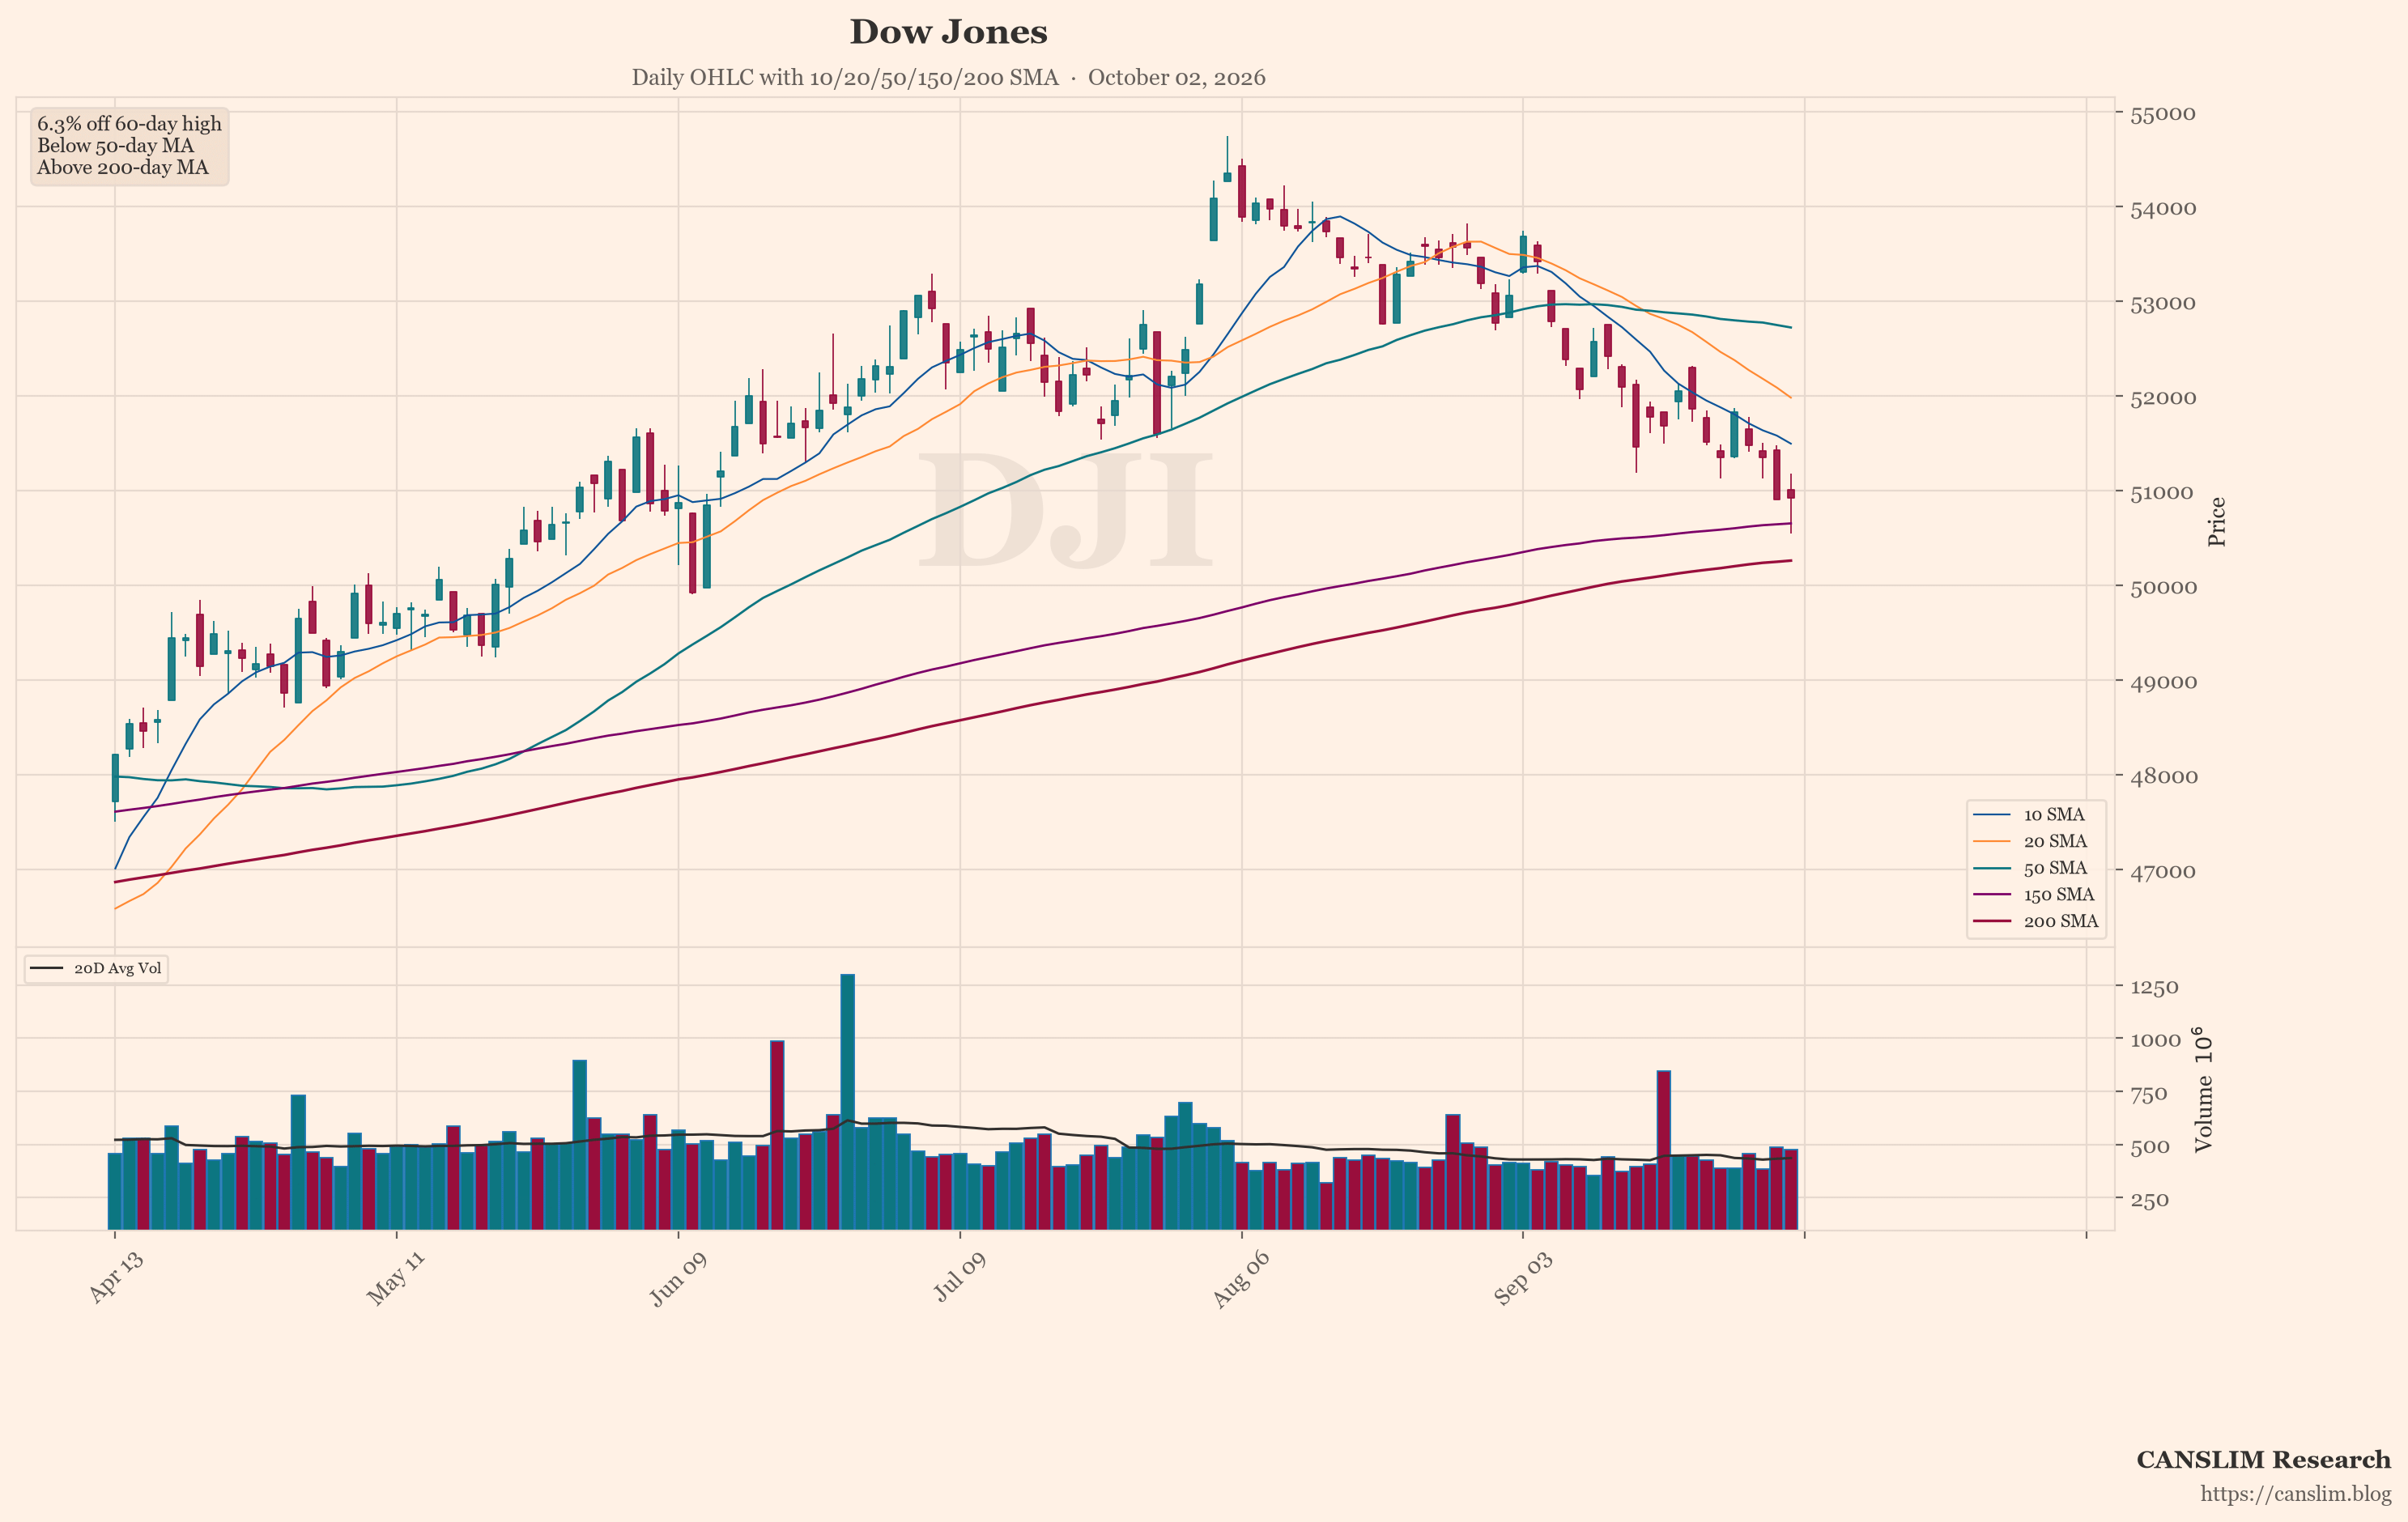
The featured chart shows the Dow Jones (^DJI). An automated technical screen picked it because, among the indices and stocks it checked, it showed the most weakness on a few measures. These include distance from its recent high, position versus its 50-day and 200-day moving averages, and down days on higher volume. This is a factual note on what the screen found. One screen is not a full view. Past price patterns do not predict future results.
Mixed Signals Leave the Market without a Clear Direction
The sources describe a market that is holding near highs but leaning on a small group of large technology stocks. Yields near 5.26%, a weak euro, conflicting oil signals and uneven breadth all sit in the background. Earnings growth is the main support cited in the brief, but it has not yet been tested by this week's reports. Online sentiment, which is unverified, shows caution under a confident surface. Risks include a further rise in yields, weaker leadership, unsettled global bond markets and oil supply shocks. Any of these could change the picture. None of them is certain to happen.
Sources: a third-party AI-generated market news summary, and an AI summary of unverified posts by anonymous retail users online. This article was written by an AI language model from those summaries and published automatically without human review. Updated 2026-10-05 22:00 HKT.
CANSLIM Research (canslim.blog) is an independent educational publisher. It is not licensed or registered as a broker, investment adviser, research analyst or asset manager in any jurisdiction. This article is general information for education only. It is not investment advice, a research report, an investment recommendation, or an offer or solicitation to buy or sell any security, and it does not consider any reader's objectives, financial situation or needs. No ticker, chart, heading or technical comment is a suggestion to buy, sell, hold or short. Figures come from third-party sources, are not independently verified, and may be incomplete, out of date or wrong. Online sentiment may include rumour, speculation or coordinated posting. Past performance and past price patterns do not predict future results. Investing involves risk, including the loss of capital. This article is not updated after publication. Laws differ by country; seek advice from a licensed professional in your jurisdiction before making any investment decision.
Discover more from CANSLIM Research
Subscribe to get the latest posts sent to your email.