 Andrew@CANSLIM RESEARCH
Stocks Bounce, but the Bond Market Still Holds the Leash
Stocks closed a wild week on firmer ground. The Dow snapped a three-session losing streak. The Nasdaq and mega-cap tech sit near records. Treasury yields eased, and oil pulled back on hopes for U.S.-Iran talks that could reopen the Strait of Hormuz. That relief was enough to lift equities. But the bigger problem has not gone away. The 30-year Treasury yield recently hit 5.48%, its highest since 2004. Long-term borrowing costs stay high. That raises the discount rate on every stock. It hits dividend payers, small caps, and richly valued growth names the hardest. The online crowd noticed the divergence. Stocks and bonds moved apart all week. That undercut the bear case for a crash. "I've decided to ignore Treasury yields from now on" became a running joke in global social sentiment.
Mega-Cap Tech Carries the Load Alone
The MAG7 Index rose 3.1% for the week. The Nasdaq 100 gained 3.3%. Those are strong numbers. But leadership is narrow. The market now leans on a small group of giants. The online crowd nicknamed the group "S&P 007." Breadth is poor. Equal-weight indexes fell for four straight weeks. Money is chasing only megacaps and semiconductors. One trader asked why nobody buys the dip in the equal-weight index. The answer: the money is not there. Consumer discretionary names are weak. Home renovation, dining out, RVs, and yachts all show localized downturns. MCD, NFLX, LULU, NKE, PYPL, INTU, and RDDT were jokingly called an "all-star lineup of bagholds." This is the classic CAN SLIM warning: when the indexes make highs but your account falls, breadth is telling the truth.
AI Spending Is Now a Credit Story
AI infrastructure spending is still a powerful growth driver. But the story is shifting. More than $500 billion of AI-related debt has reportedly been issued this year. The focus is moving to cash flow and returns on hyperscaler spending. The bond market is becoming an AI trade. That is a yellow flag. Data centers also face a physical limit: grid congestion. Power infrastructure cannot keep pace with hyperscaler electricity needs. China wants in on the U.S. AI data center boom. Meanwhile, the U.S. and China agreed to a reported $30 billion reciprocal tariff cut and an AI dialogue. That extends the trade truce. It lowers near-term risk. But disputes over technology, Taiwan, and security remain unresolved.
Two Giants Move in Opposite Directions
MSFT unveiled a full Copilot revamp with code generation and a persistent agent. It closed Friday at 516.16, up 3.73% on higher volume. That is textbook accumulation. META saw profit-taking after Goldman turned cautious. It closed at 751.26, down 3.40%. The stock had risen about 32% in the prior month on its Muse agent. Some bulls bought the after-hours dip. They liken Muse to the iPod of the agent era. Skeptics call the pullback normal after a 40% run. One call holder lost 48% in a day. COST closed at 922.76, up 2.93%. AAPL closed at 341.02, up 1.53%.
The Weakest Chart on the Board
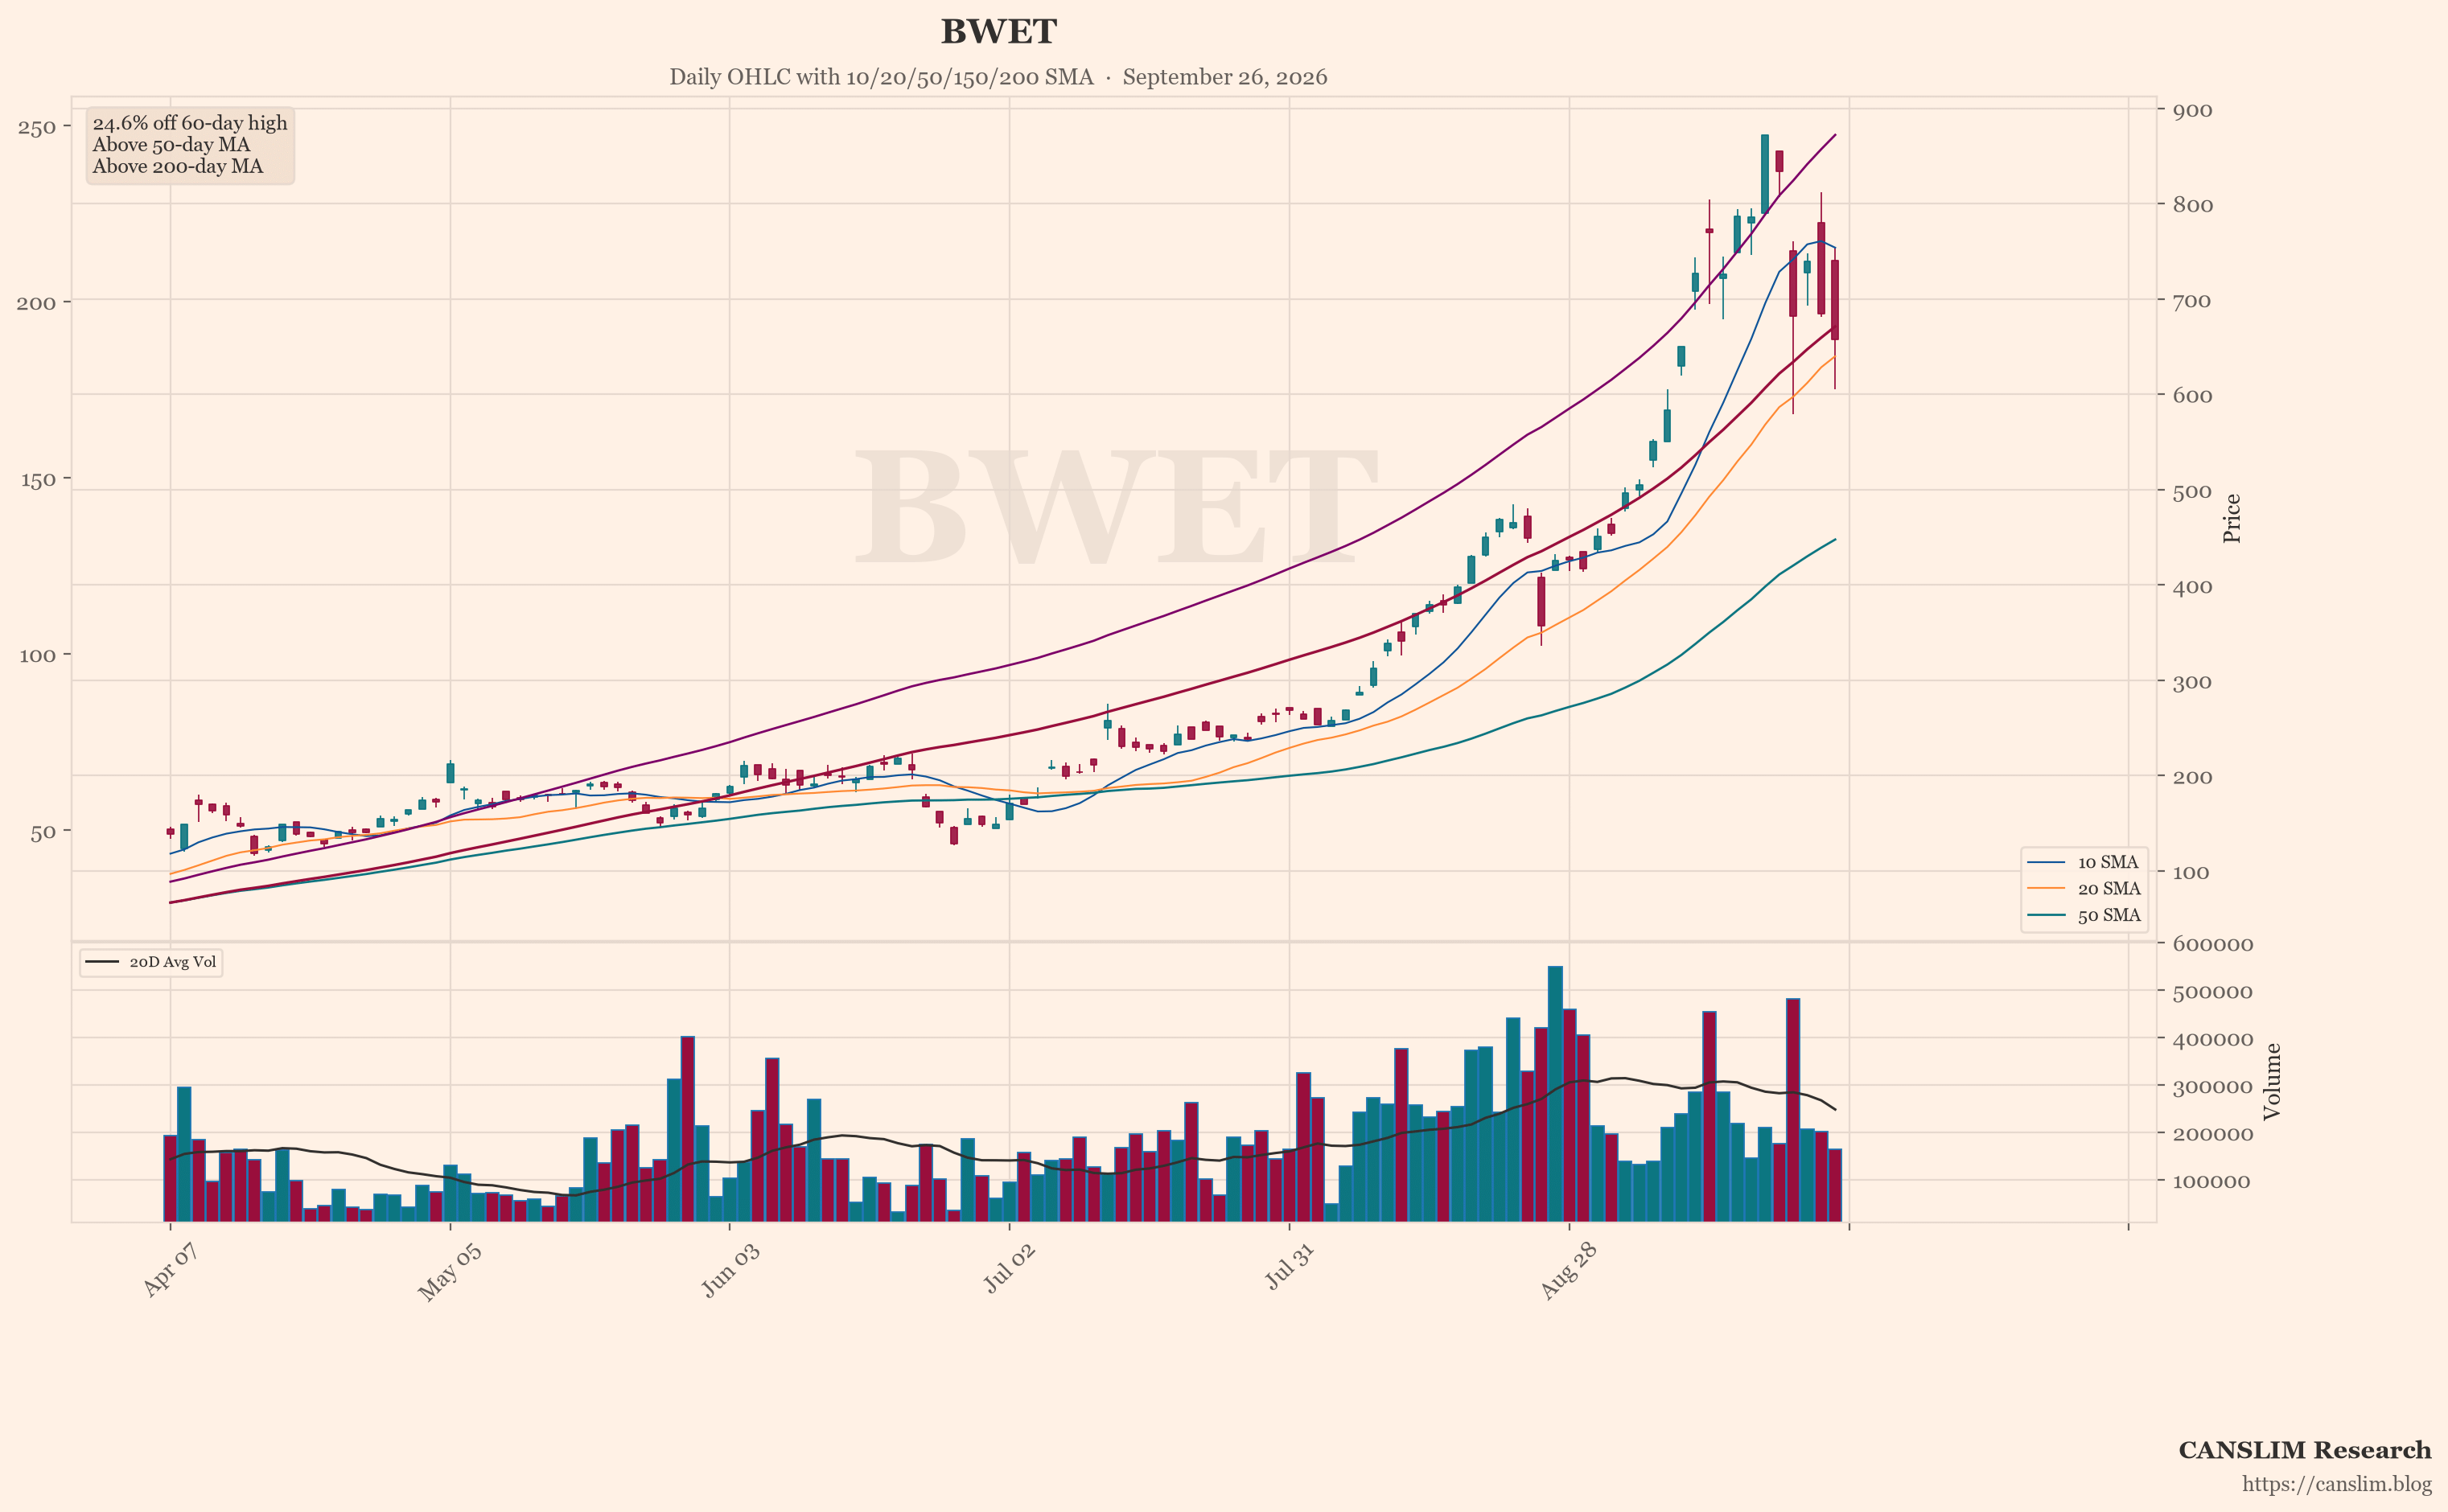
Not every name is holding up. BWET plunged 8.05% Friday to close at 662.46. The online crowd says it trades at a roughly 10.8% discount to NAV. That is a broken technical pattern. It shows distribution, not accumulation. Rumors are circulating about a White House AI event and disrupted government websites. Those are only community rumors. Treat them as noise. The chart is the signal, and this one is weak.
Earnings and Inflation Data Collide Next Week
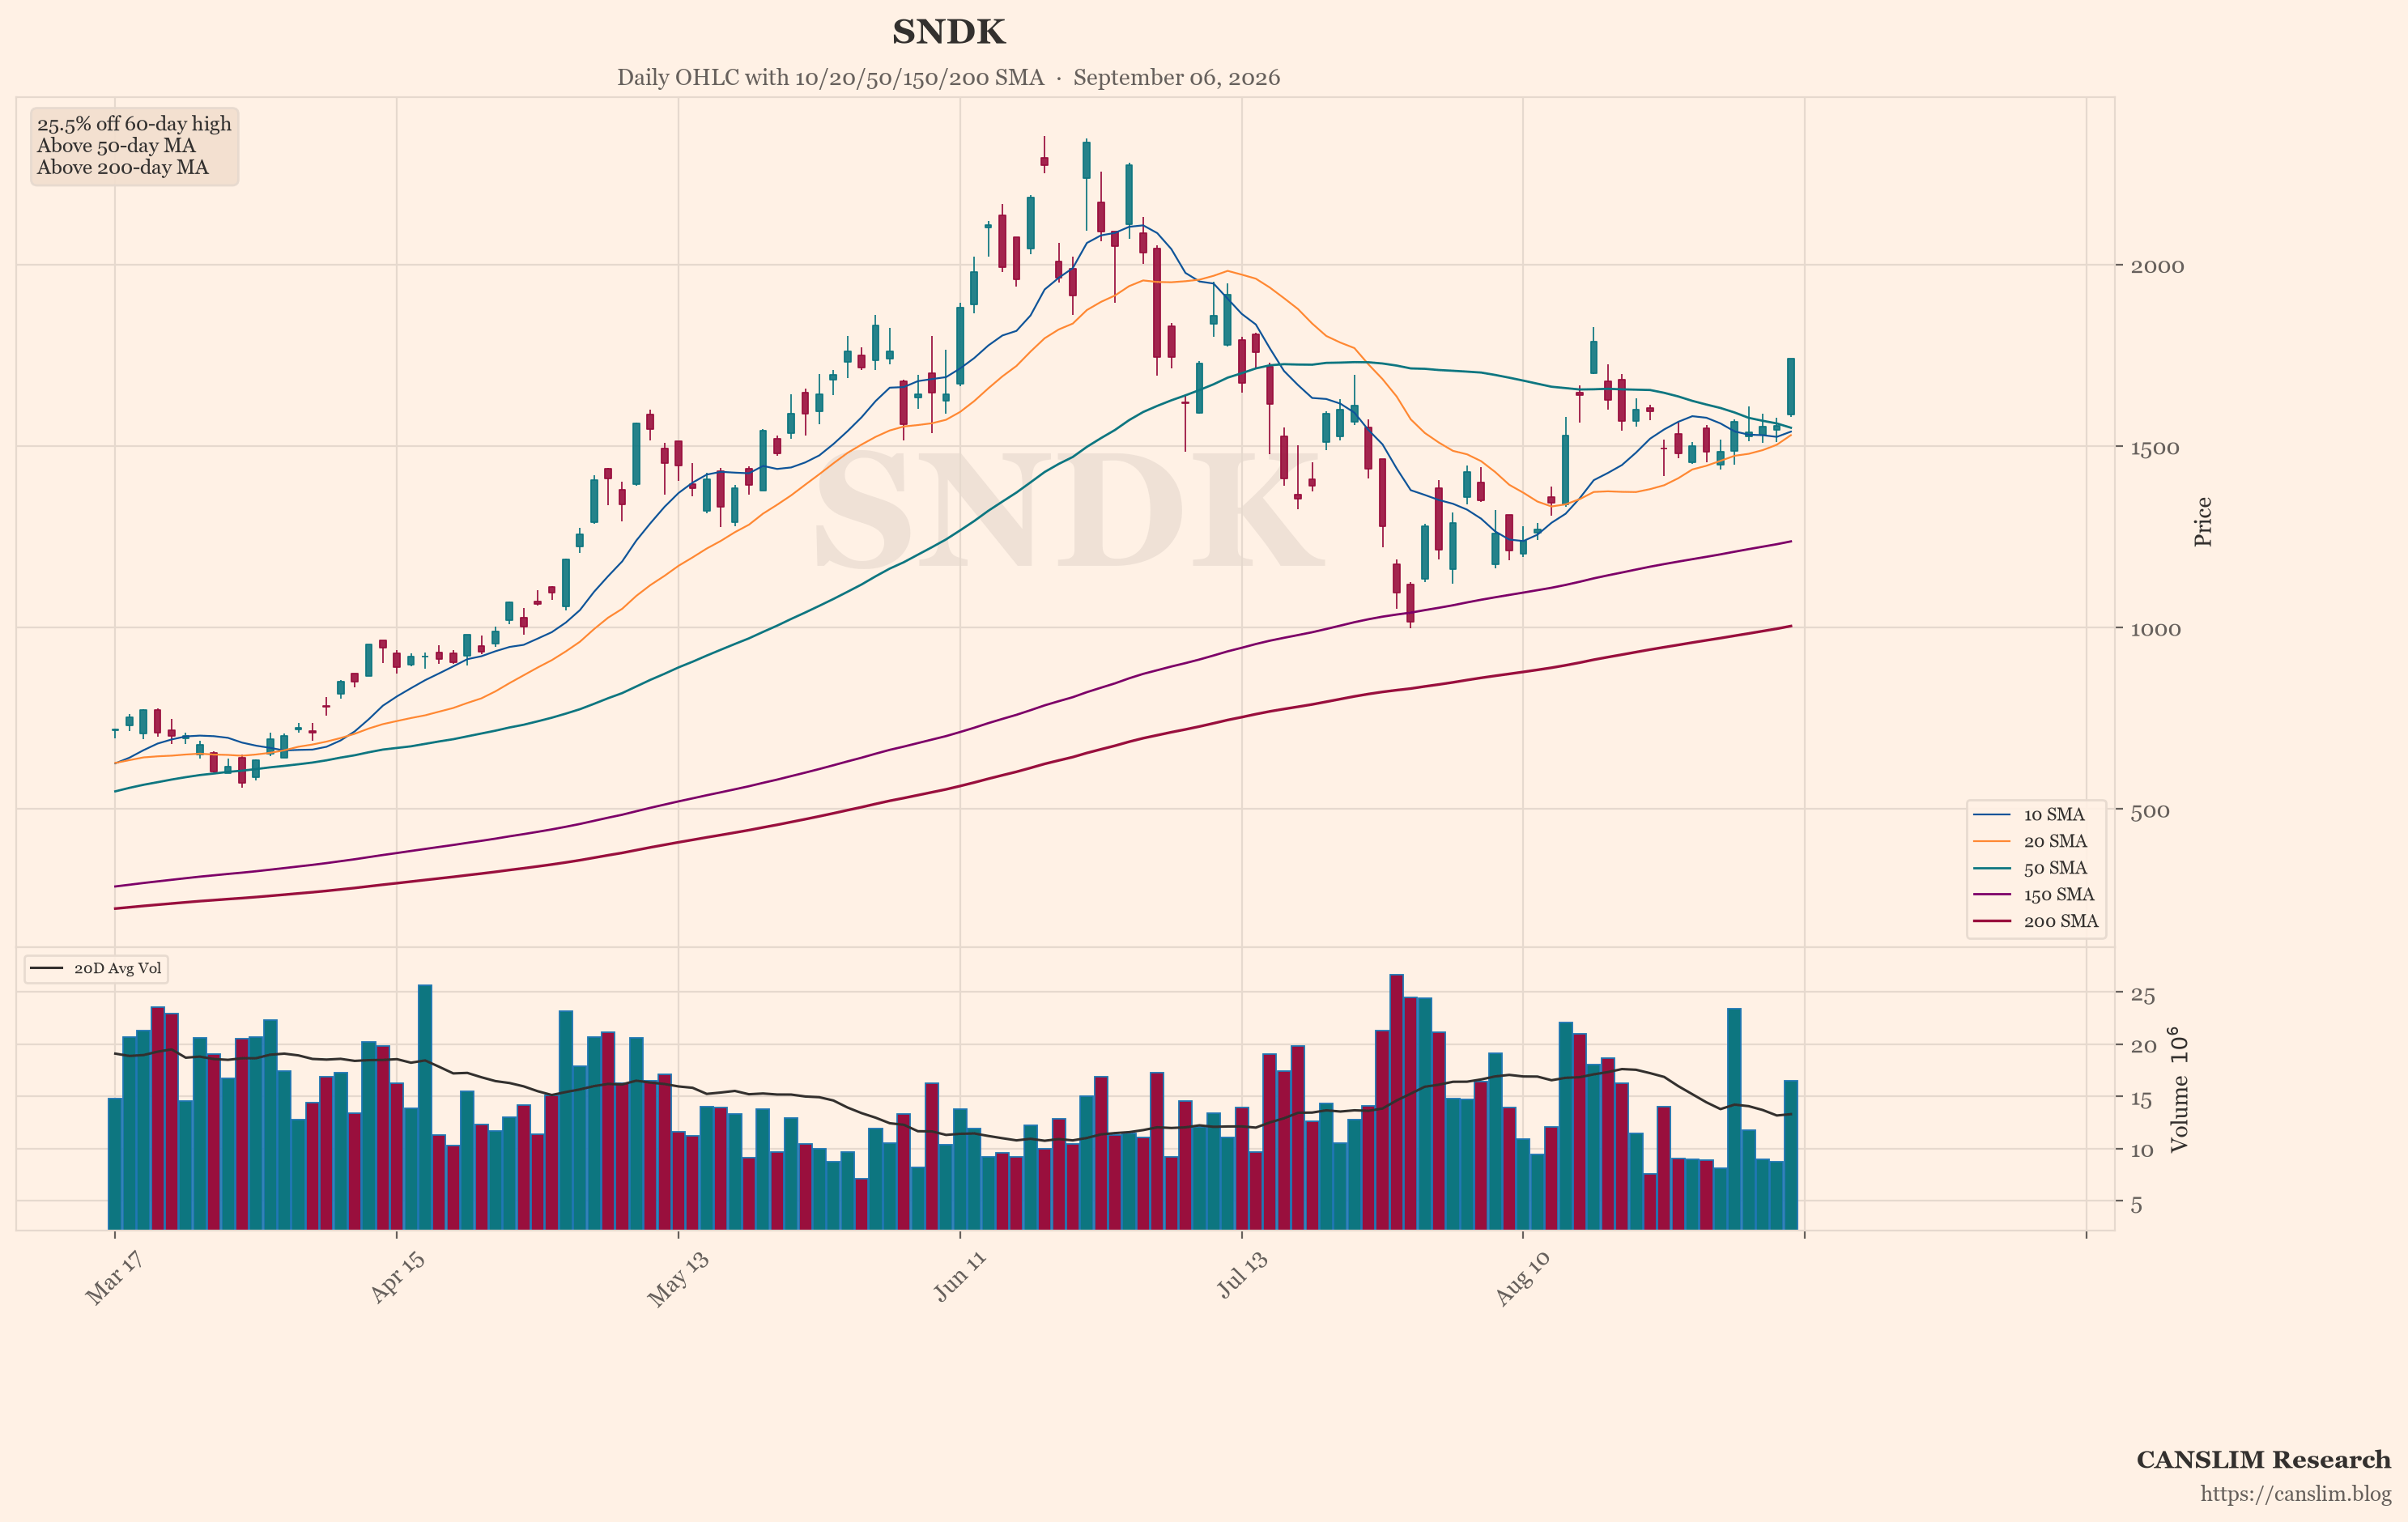
MU reports earnings around 9/29–9/30. It closed Friday at 1082.01. The stock has been pinned near that level for a week. Bulls target 1300–1450. The take-profit camp wants to sell at 1200. The shakeout camp expects an engineered sell-off first. SNDK closed at 1777.01. SOXL closed at 151.30, up 3.42%. Then PCE lands before the open on 9/30, with historical revisions back to 2021. Nonfarm payrolls follow on 10/2. The key question: if MU and PCE conflict, which does the market follow? Most say PCE carries more weight. The 10-year yield sits near a 19-year high, around 5.19%. TLT closed at 79.33. GLD closed at 393.39. Some predict the 30-year hits 6%. Others say stocks will not care until yields reach 10%.
Stay Disciplined While the Tape Sorts Itself Out
This is a market of narrow leadership and loud headlines. The indexes look strong. The average stock does not. Yields are still the master variable. Oil remains a geopolitical swing factor. If supply routes stay at risk, transport costs and inflation pressures stay high. The online crowd is fixated on headline timing, not fundamentals. That is a contrarian signal in itself. For growth investors, the playbook is simple. Follow the leaders with strong volume. Avoid broken charts like BWET. Keep position sizes modest into MU earnings and PCE. Let the market prove itself. When breadth improves and yields cool, the door opens wider. Until then, patience is a position.
Sources: market news brief & global social sentiment data. Updated 2026-09-26 22:00 HKT. For educational purposes only — not investment advice.
Discover more from CANSLIM Research
Subscribe to get the latest posts sent to your email.