 Andrew@CANSLIM RESEARCH
Yields Creep Higher but Stocks Refuse to Blink
U.S. stocks ended the week higher. Falling oil and softer bond prices gave traders some relief. But the calm hides a real problem. The 10-year Treasury yield sits at its highest level since the financial crisis. The 30-year yield hit a new high since 2004. Investors now see a real chance of another Fed rate hike in October. Normally, that would sink stocks. This week, it did not. The online crowd is confused. One popular line says stocks rise when yields fall, but they do not fall when yields rise. That puzzle is the story of the week.
A Trade Truce With Little Substance
Trump and Xi extended the U.S.-China trade truce. That removes one near-term risk. But the summit was more spectacle than substance. Deeper fights over technology and security remain unsolved. Both sides agreed to meet again at APEC in November and the G20 in December. Markets barely moved on the news. Oil also fell on hopes that a U.S.-Iran deal could reopen the Strait of Hormuz. That outcome is far from certain. Energy prices can reverse fast on any headline. For now, cooler oil helps the inflation picture.
Mega-Caps Carry the Whole Load
Market leadership is dangerously narrow. MSFT jumped 3.73% to 516.155, a new high for the year. The catalyst was Copilot's push into enterprise customers, plus a price-target raise to $570 from Oppenheimer. AAPL added 1.53%. Together they dragged the major indexes higher. Meanwhile, META fell 3.40% to 751.26 after a New Mexico jury found it misled users in the Cambridge Analytica case. INTC dropped 3.42%. ORCL lost 1.76%. Small caps barely moved. The crowd's complaint that "only SPY is going up" is mostly true. Breadth is thin.
The Bond Market Is Becoming an AI Trade
AI spending still supports large-cap tech. But the story is shifting. Over $500 billion in AI-related debt has been issued this year. That puts leverage, cash flow, and returns on investment under the microscope. One analyst calls the bond market a new AI trade. Even Fed's Schmid asked whether the AI "ecosystem" is getting too big to fail. The crowd is also tired of the hype. Trump's rebrand of AI as "super intelligence" drew heavy mockery. Some traders now hedge AI risk with PANW and CRWD, fearing a major hack within months.
A Weak Chart in a Strong Tape
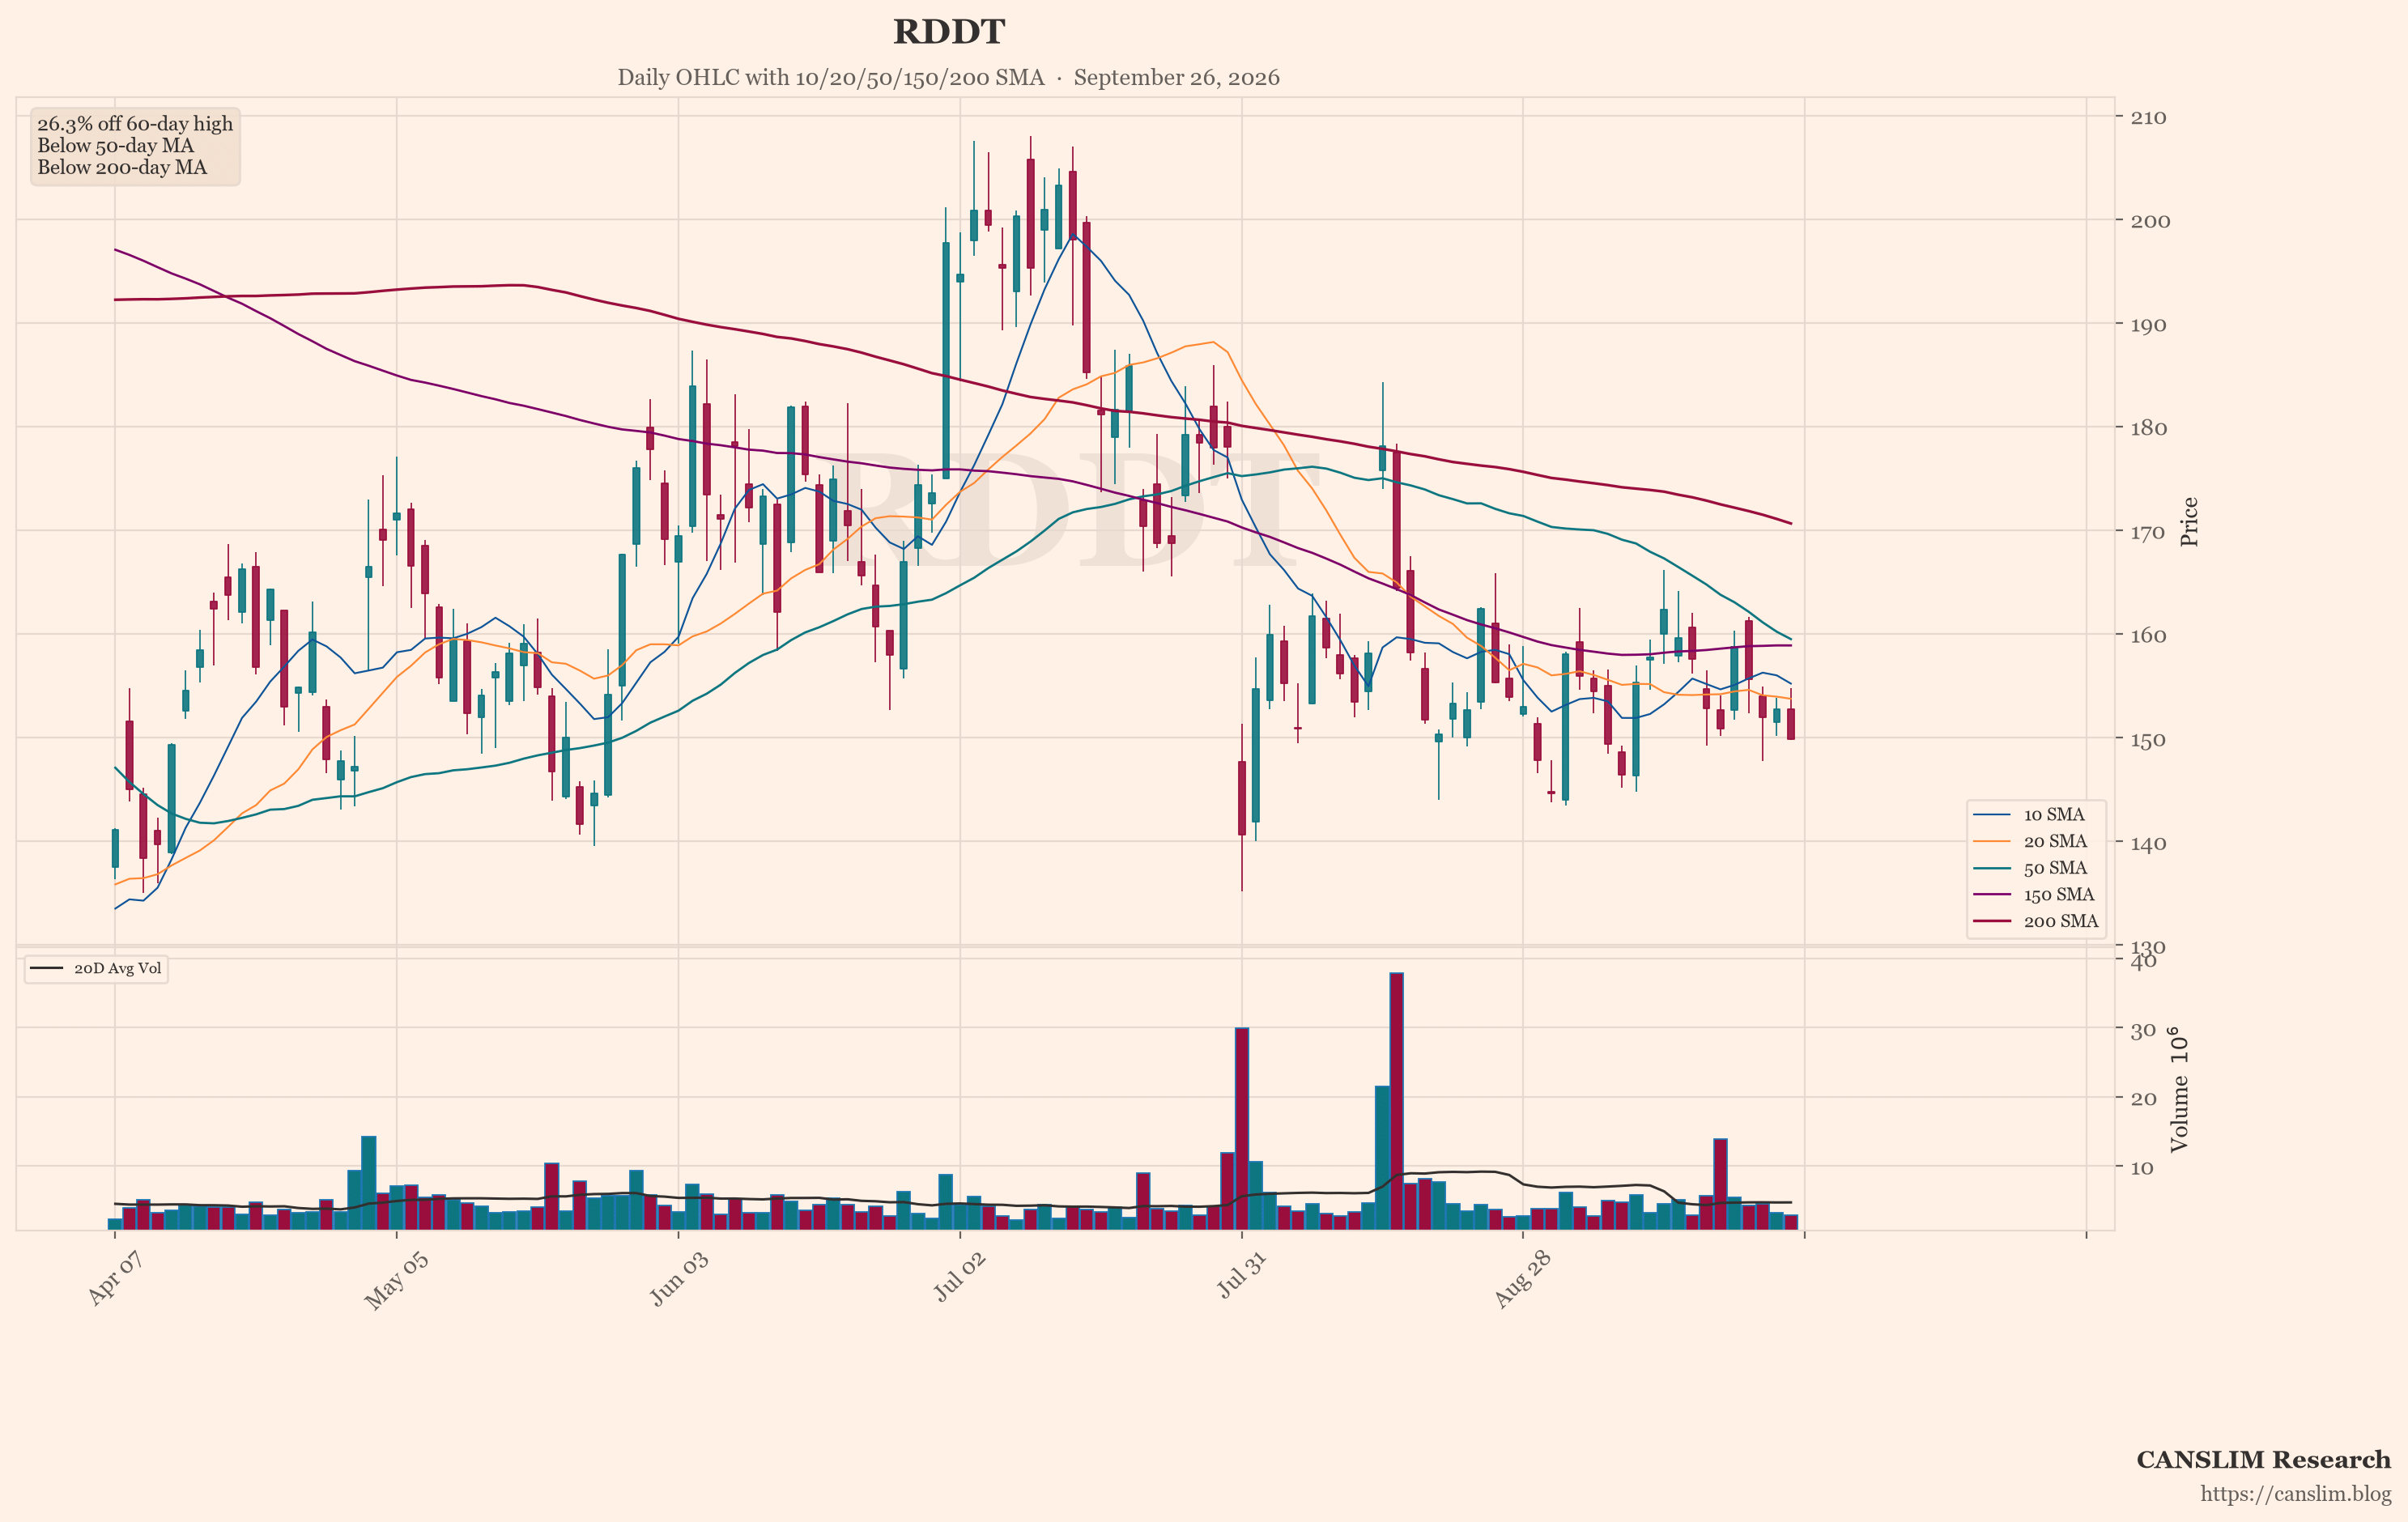
Not every leader holds up. RDDT fell 1.88% and shows the weakest technical pattern in the featured chart. While MSFT breaks out, RDDT struggles. That gap matters. In a narrow market, laggards get punished. The crowd is also fixated on MU, which hit 1108 Friday but closed at 1082. Earnings land September 30, the same day as quarter-end. Bulls want 1300–1400. Bears expect a reality check. It is the biggest single-stock event ahead.
Watch the Jobs Report, Not the Noise
Next week brings September employment data. A cool report would ease rate pressure. Strong labor data would revive the inflation trade fast. Watch Treasury yields and any verified progress on Iran talks. Also note the crowd's frustration with algo-driven pinning and forced 0DTE closures. That anger is real but not a signal. The trend still favors large-cap tech. Yet narrow breadth and rising yields are yellow flags. Stay with leaders showing strong charts. Avoid weak patterns like RDDT. Let the jobs report tell you which way the wind blows.
Sources: market news brief & global social sentiment data. Updated 2026-09-26 14:00 HKT. For educational purposes only — not investment advice.
Discover more from CANSLIM Research
Subscribe to get the latest posts sent to your email.