 Andrew
Key Takeaways
- The 10-year Treasury yield sits near 5.17%, with the 30-year briefly touching 5.501%, its highest since 2004.
- AKAM jumped 10.75% to 122.31 on a seven-year, $11.6 billion cloud deal with Anthropic.
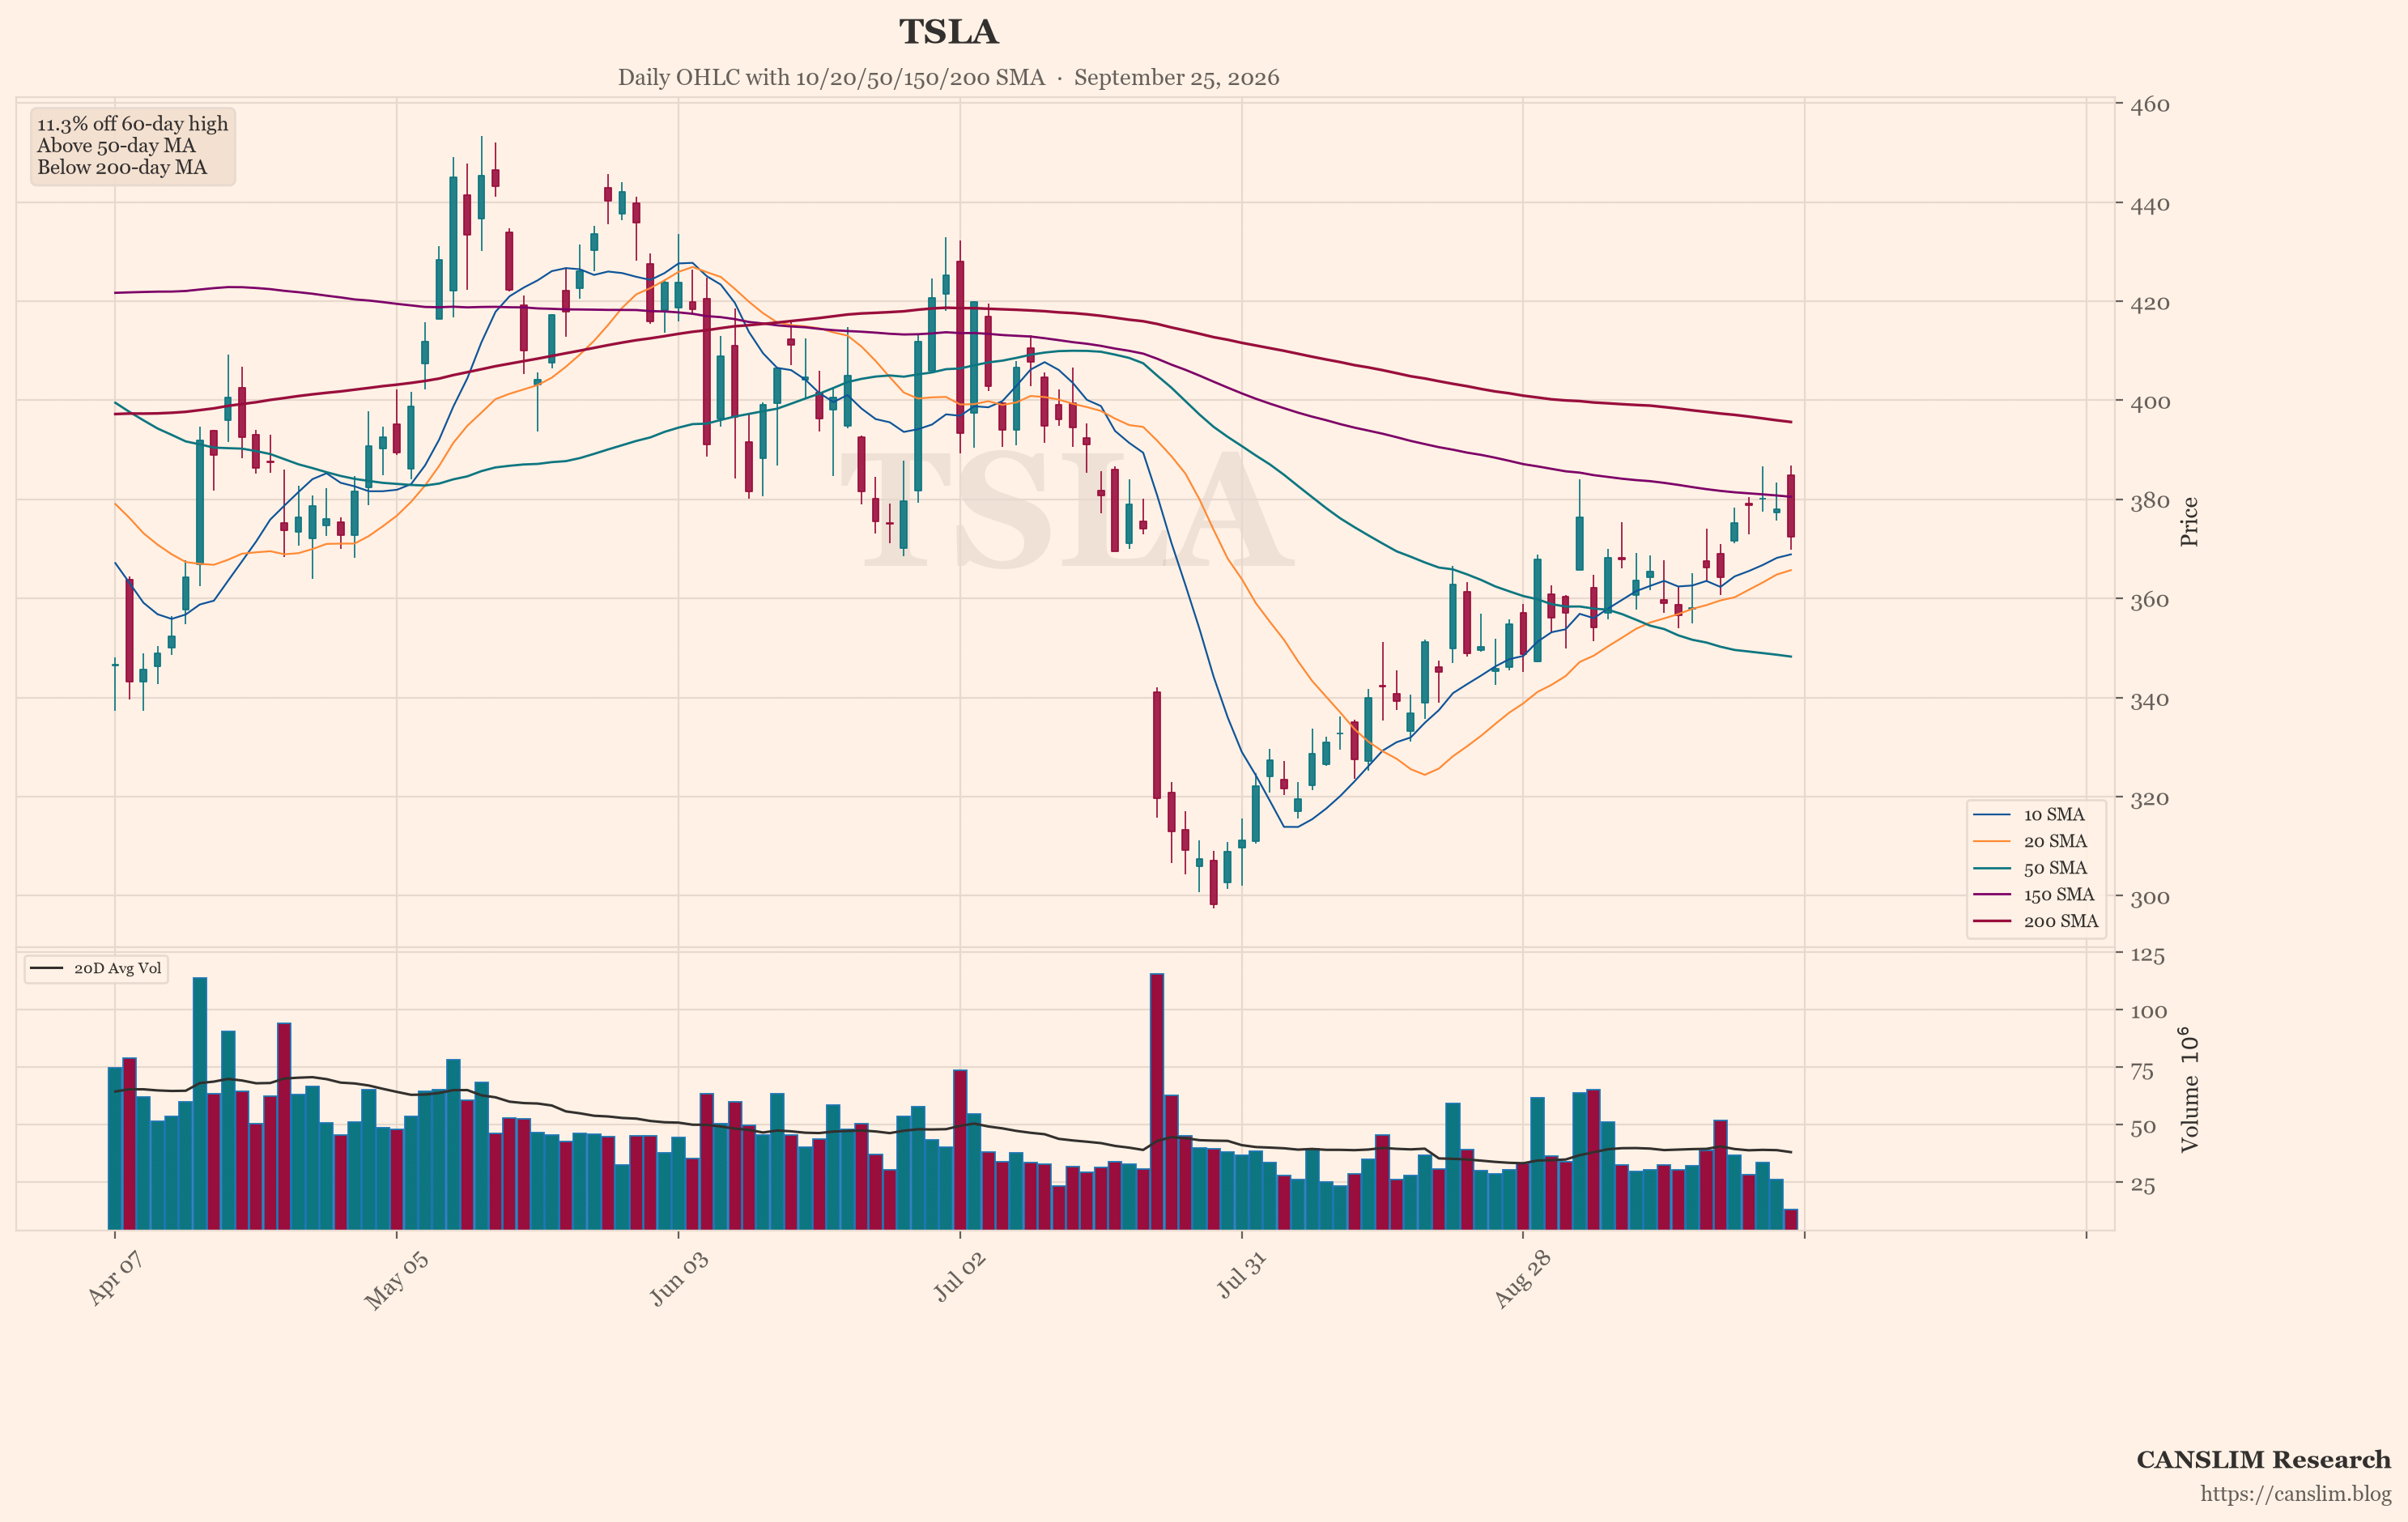
- TSLA fell from 384.6 to 370.6 intraday and closed at 373.79, down 1.11%.
Rising Yields Are Quietly Repricing Everything
The bond market is running the show right now. The 10-year Treasury yield sits near 5.17%, and the 30-year briefly touched 5.501% — its highest level since 2004. That matters for stocks because higher yields raise the rate used to value future profits. Long-duration names get hit hardest. Rate-sensitive groups like REITs and utilities are already feeling it. This looks like a flow-driven selloff, not a business problem. Still, the pressure is real, and it is not going away yet.
Stocks Shrug While the Crowd Stays Skeptical
Here is the strange part. Equities are holding up anyway. SPY traded at 769.59, up 0.30%, but stuck below 770 all day. QQQ rose 0.40%. DIA added 0.36%, while small caps lagged with IWM up just 0.18%. The online crowd noticed the gap. Many mocked the market for ignoring a 5.5% long bond. Others waited for a move that comes "gradually, then all at once." Fear/Greed sits near 65/100 — greedy, but without real conviction.
Oil Keeps Inflation Sticky and Margins Thin
Crude remains the second pressure point. Traders are watching U.S.–Iran talks about a phased reopening of the Strait of Hormuz. No deal has been reached. Gulf states already pushed back on transit fees. USO slipped 1.93% to 150.19, but supply risks have not vanished. Low strategic reserves keep the floor under prices. Higher oil supports yields and squeezes consumers through fuel and diesel costs. That combination is not friendly to stock multiples.
AI Leadership Does the Heavy Lifting
AI optimism is still the market's backbone. AKAM jumped 10.75% to 122.31 on a seven-year, $11.6 billion cloud deal with Anthropic. MSFT gained 2.67% to 510.87. Memory names ripped higher: MU rose 2.30% to 1105.0, and SNDK climbed 3.21% to 1810.27. The AI infrastructure buildout looks durable. But financing it is getting more expensive. That is the tension nobody has resolved.
TSLA Weakens While META Slips from Its Highs
The featured chart, TSLA, shows the weakest technical pattern here. It fell from 384.6 to 370.6 intraday and closed at 373.79, down 1.11%. That reversal is a warning. META also failed near 780 and dropped 2.77% to 756.22. Bears finally got a win. Bulls called it a healthy pullback after a 36% monthly gain. Meanwhile, NKE sank 1.62% to 35.43 after a Bank of America downgrade. Weak charts are getting punished.
Stock Picking Beats Index Watching from Here
The indexes look calm. The action underneath is not. Money is rotating into AI hardware and select megacaps. It is leaving broken charts and rate-sensitive sectors behind. If yields keep grinding higher, crowded long-duration trades stay vulnerable. Watch whether yields stabilize, whether oil stays elevated, and whether AI leadership can keep carrying the tape. In this market, the index tells you little. Your individual names tell you everything.
Sources: market news brief & global social sentiment data. Updated 2026-09-25 22:00 HKT. For educational purposes only — not investment advice.
Frequently Asked Questions
Why Do Higher Treasury Yields Pressure Stocks?
Higher yields raise the rate used to value future profits, so long-duration names and rate-sensitive groups like REITs and utilities are hit hardest.
How Did the Major Index ETFs Trade?
SPY traded at 769.59, up 0.30% but stuck below 770 all day. QQQ rose 0.40%, DIA added 0.36% and IWM was up just 0.18%.
What Happened to TSLA in This Session?
TSLA showed the weakest technical pattern, falling from 384.6 to 370.6 intraday and closing at 373.79, down 1.11%.