 Andrew@CANSLIM RESEARCH
The Bond Market Just Slammed the Brakes
The 10-year Treasury yield climbed above 5% this week. It briefly touched 5.14%, the highest level since 2007. That is a big deal for growth stocks. Higher yields raise borrowing costs for mortgages, corporate debt, and equities. Richly valued names get hit hardest. The Dow lost 0.68%. The S&P 500 pulled back from record levels. Small caps were weaker still, with IWM down 1.80%. The pressure came from three places. First, the September flash Composite PMI hit 58.4, the best since 2021. Second, a $70 billion five-year note auction drew weak demand. Third, Governor Barr sounded hawkish. The market now prices roughly a 73% chance of a rate hike in October.
Strong Data Cuts Both Ways
Here is the tricky part. Strong business data says the economy is still expanding fast. That reduces near-term recession fears. But it also tells the Fed it can keep rates high. So good news becomes bad news for stocks. The online crowd felt this tension all week. Global social sentiment swung from Tuesday's optimism to irritation and self-mockery. Bears grabbed the microphone. Yet most traders still held calls, hoping for good news. The fear and greed estimate sat near 40/100, leaning fearful. Screenshots of puts and crash calls spread fast. But real selling stayed mild. SPY fell only 0.71% and sat about 1.5% below its high. The crowd felt far more bearish than the tape actually was.
The Chart That Worries Me Most
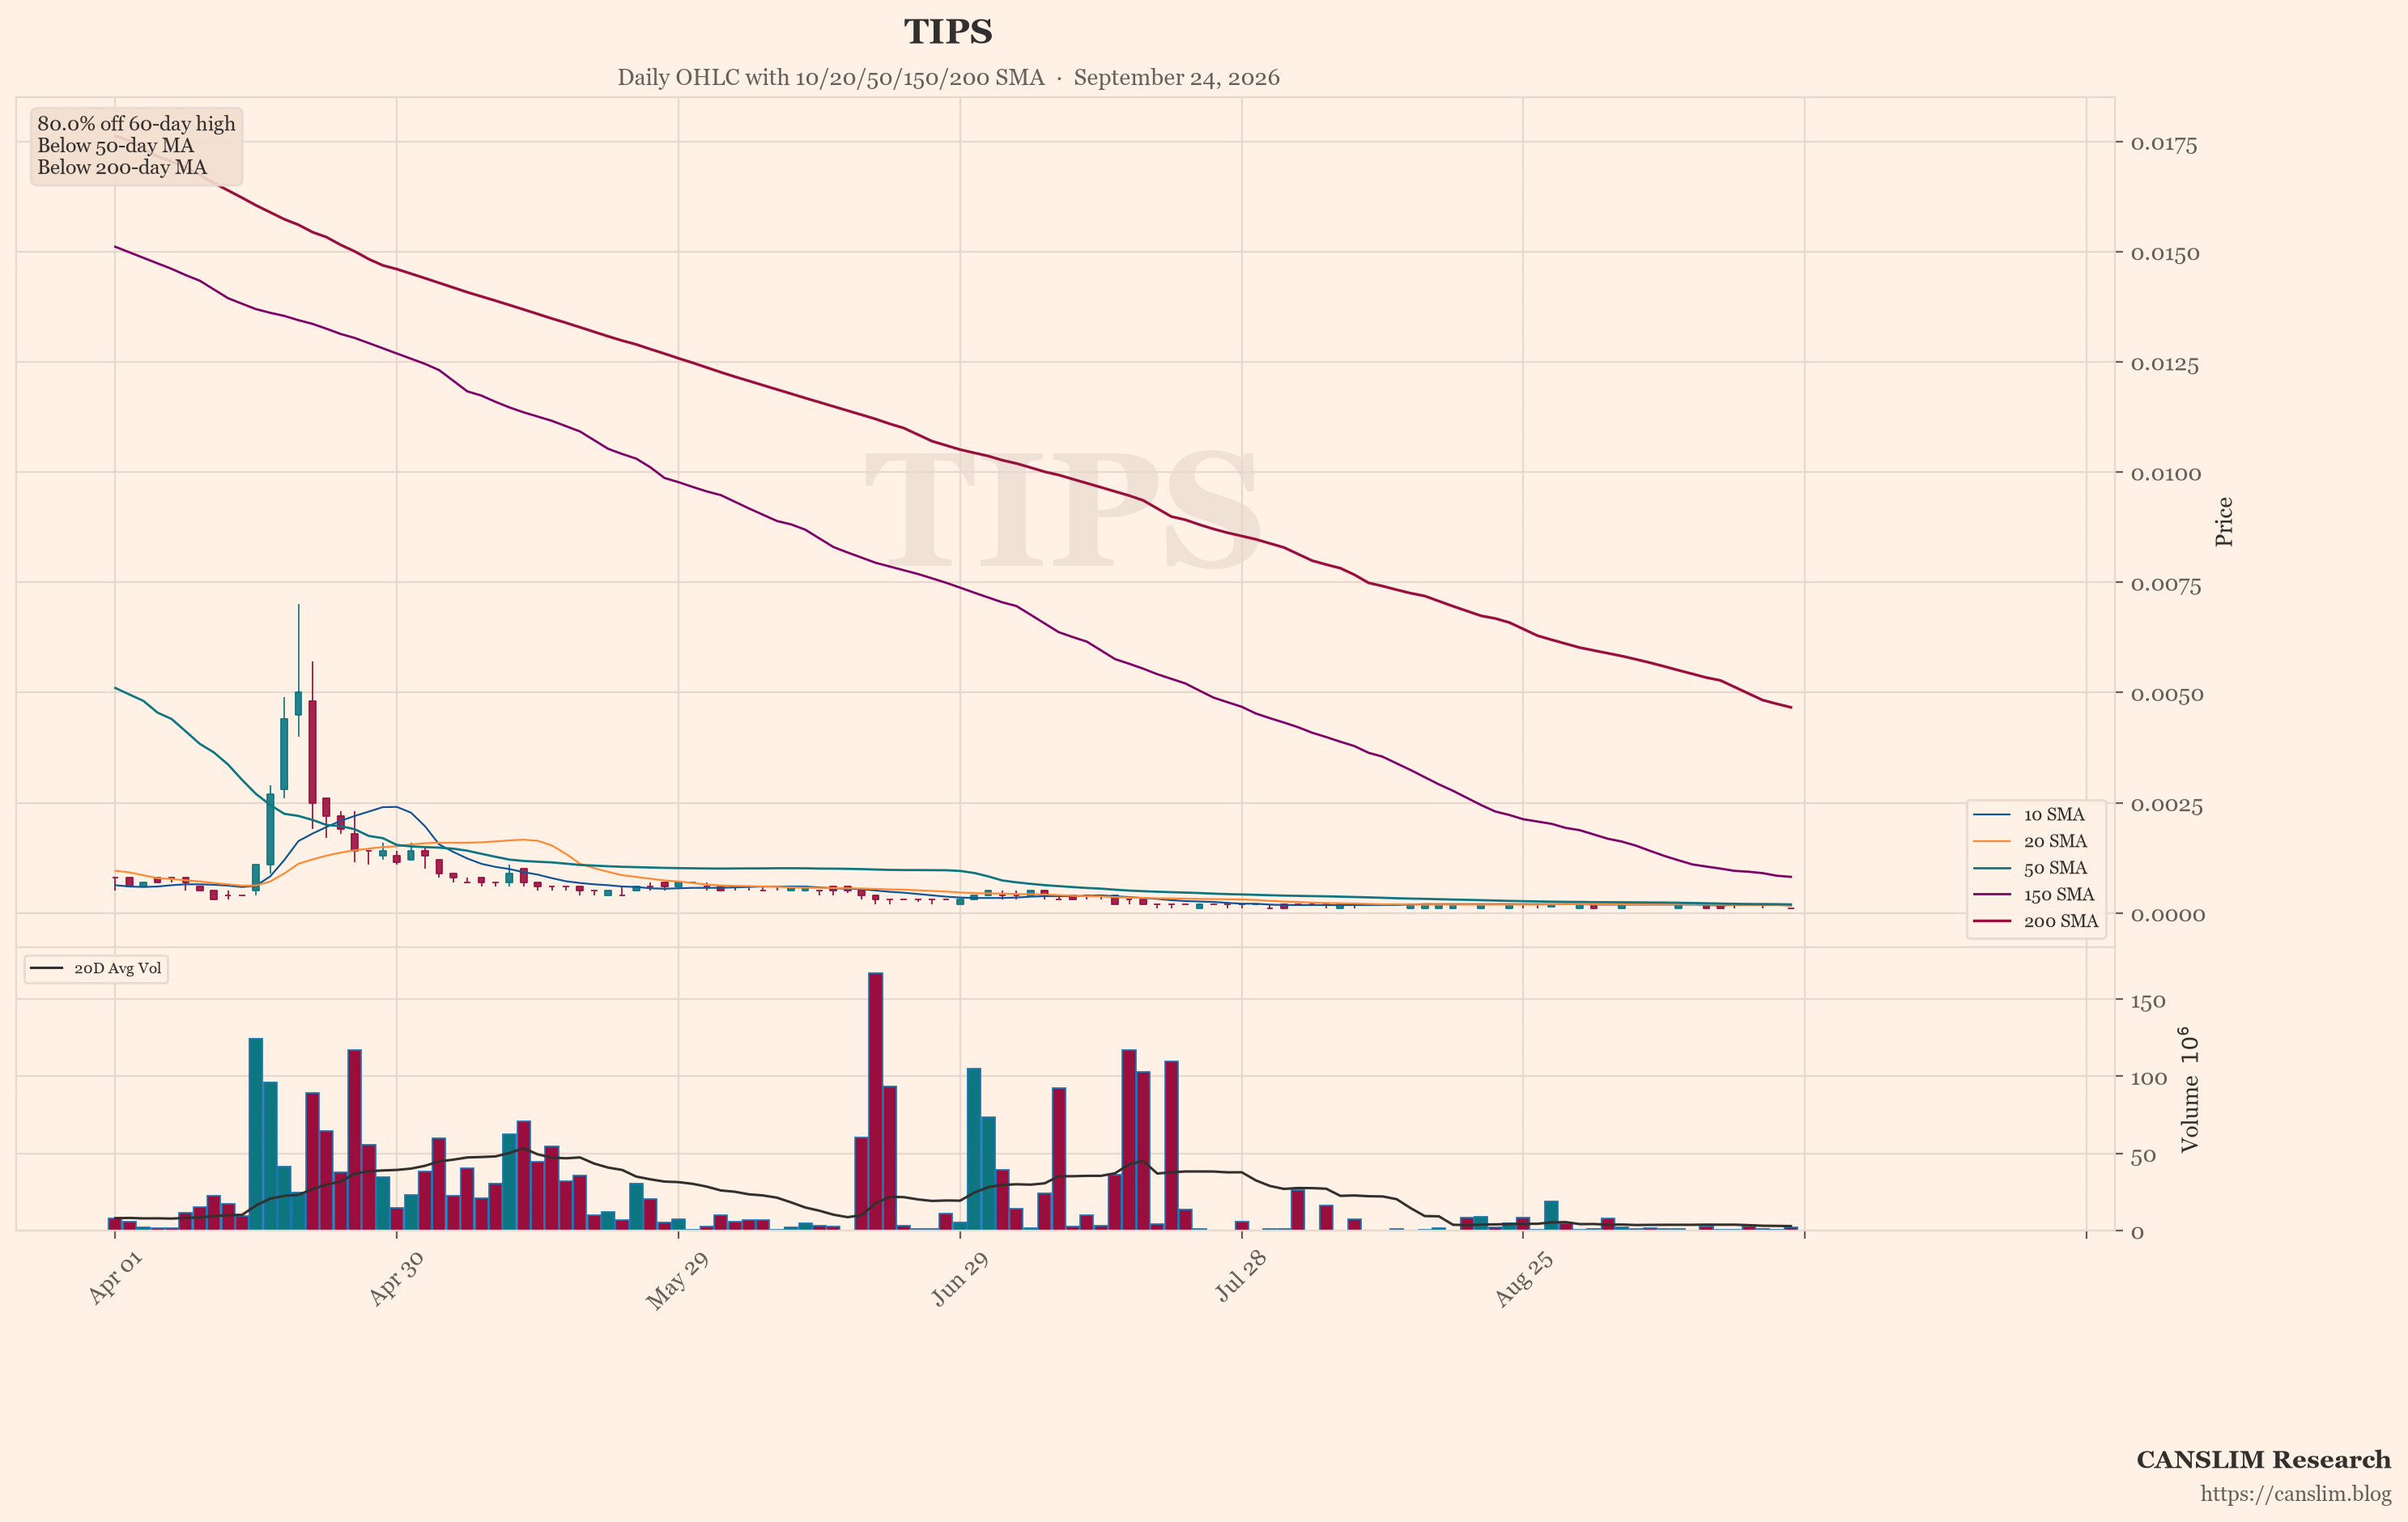
Look at TIPS. This is the featured chart, and it shows the weakest technical pattern right now. The 30-year TIPS real yield reached 3.17%, matching its 2000 level. That tells you real borrowing costs are back at dot-com-era highs. For CAN SLIM and Minervini-style traders, this matters. Rising real yields compress valuation multiples. They punish extended growth names. They also tighten financial conditions across the whole market. When the weakest chart is the inflation-protected bond fund, the message is clear. The cost of money is the story. Watch this chart closely. If it keeps breaking down, growth leaders will keep facing headwinds.
Breadth Narrows While Leaders Hold Firm
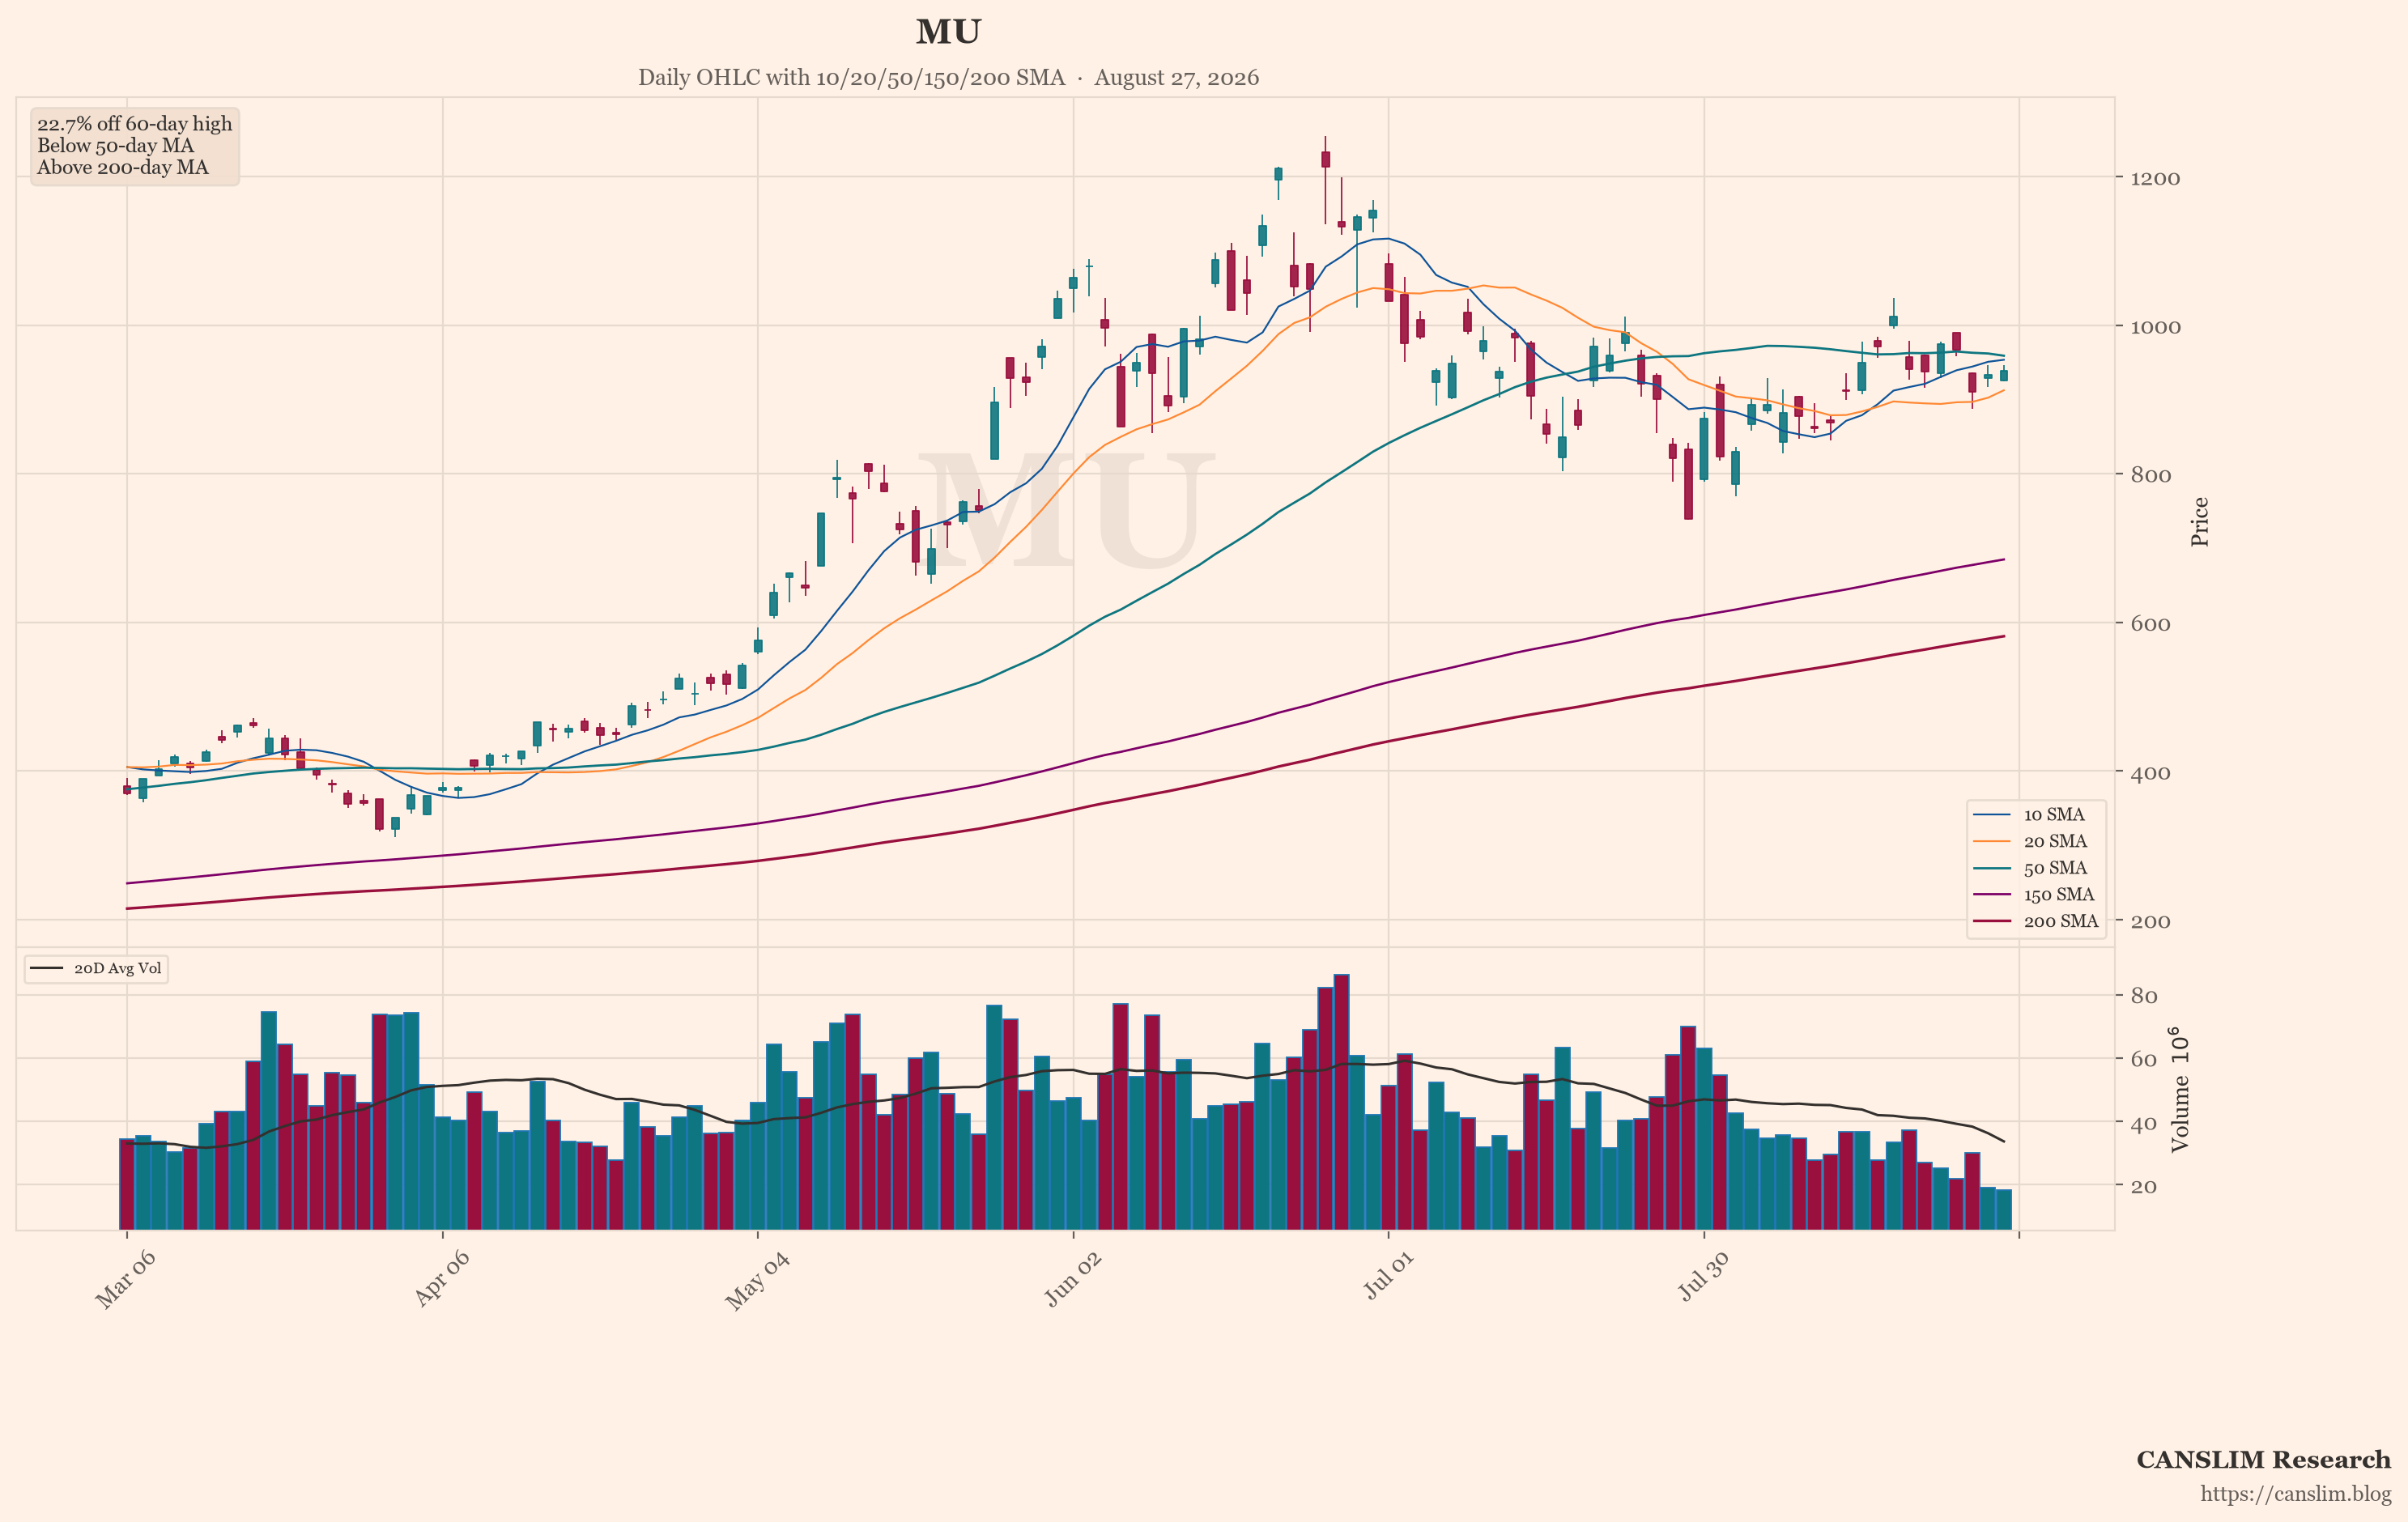
Fewer stocks are carrying this market than at any time since the dot-com peak. That is a warning sign. Narrow breadth leaves the rally exposed. If megacap technology shares weaken, the indexes have little support underneath. Wednesday showed this clearly. GOOGL fell 3.81% to 337.80, nearly at its low. Memory and chip names struggled too. MU dropped 2.13%. SNDK lost 3.75%. SOXX fell 1.24%. ARM slid another 2.19% overnight. But not everything broke. META closed up 1.01% at 744.04 after its Connect conference. It unveiled new Ray-Ban glasses starting at $449 and a VR device for spring 2027. Partner U jumped 2.32%, then gained another 4.96% overnight. Leaders can still hold firm even when breadth is thin.
Oil, Diesel, and the Trade Truce
Energy sent mixed signals. Oil eased after Iran said it was open to diplomacy. Asia is set to import 23.96 million barrels per day of crude in September, the most since February. That suggests supply is still flowing. But diesel is a real inflation threat. Record prices are lifting freight, food, and heating costs. Senators from both parties asked Trump to release emergency heating oil. Trump backed a diesel export ban. USO rose 3.32% Wednesday, then gave back 1.26% overnight. On trade, there was good news. The U.S.-China truce was extended to January 10. That supports chip and industrial sentiment. Xi began a three-day state visit. Tech executives will attend Thursday's state dinner. But an F-35 parts incident added tension. The Pentagon is investigating.
What Growth Traders Should Do Now
The playbook is simple. Watch the 10-year yield. Watch upcoming Treasury auctions. Watch October Fed expectations. Watch the Strait of Hormuz. And watch whether strong data keeps outweighing rate pressure. Right now, the market is neutral but fragile. Breadth is narrow. Real yields are at 2000 levels. The crowd is fearful but not panicking. That mix favors patience over chasing. Keep a watchlist of leaders holding up well, like META and U. Avoid extended names that break down on volume. Let the weakest chart, TIPS, guide your caution. If yields cool, growth can run again. If they push toward 6%, the pressure only grows. Stay disciplined. Let the market prove itself before you commit size.
Sources: market news brief & global social sentiment data. Updated 2026-09-24 14:00 HKT. For educational purposes only — not investment advice.
Discover more from CANSLIM Research
Subscribe to get the latest posts sent to your email.