 Eben@CANSLIM Research
Institutional Analysis & Market Backdrop
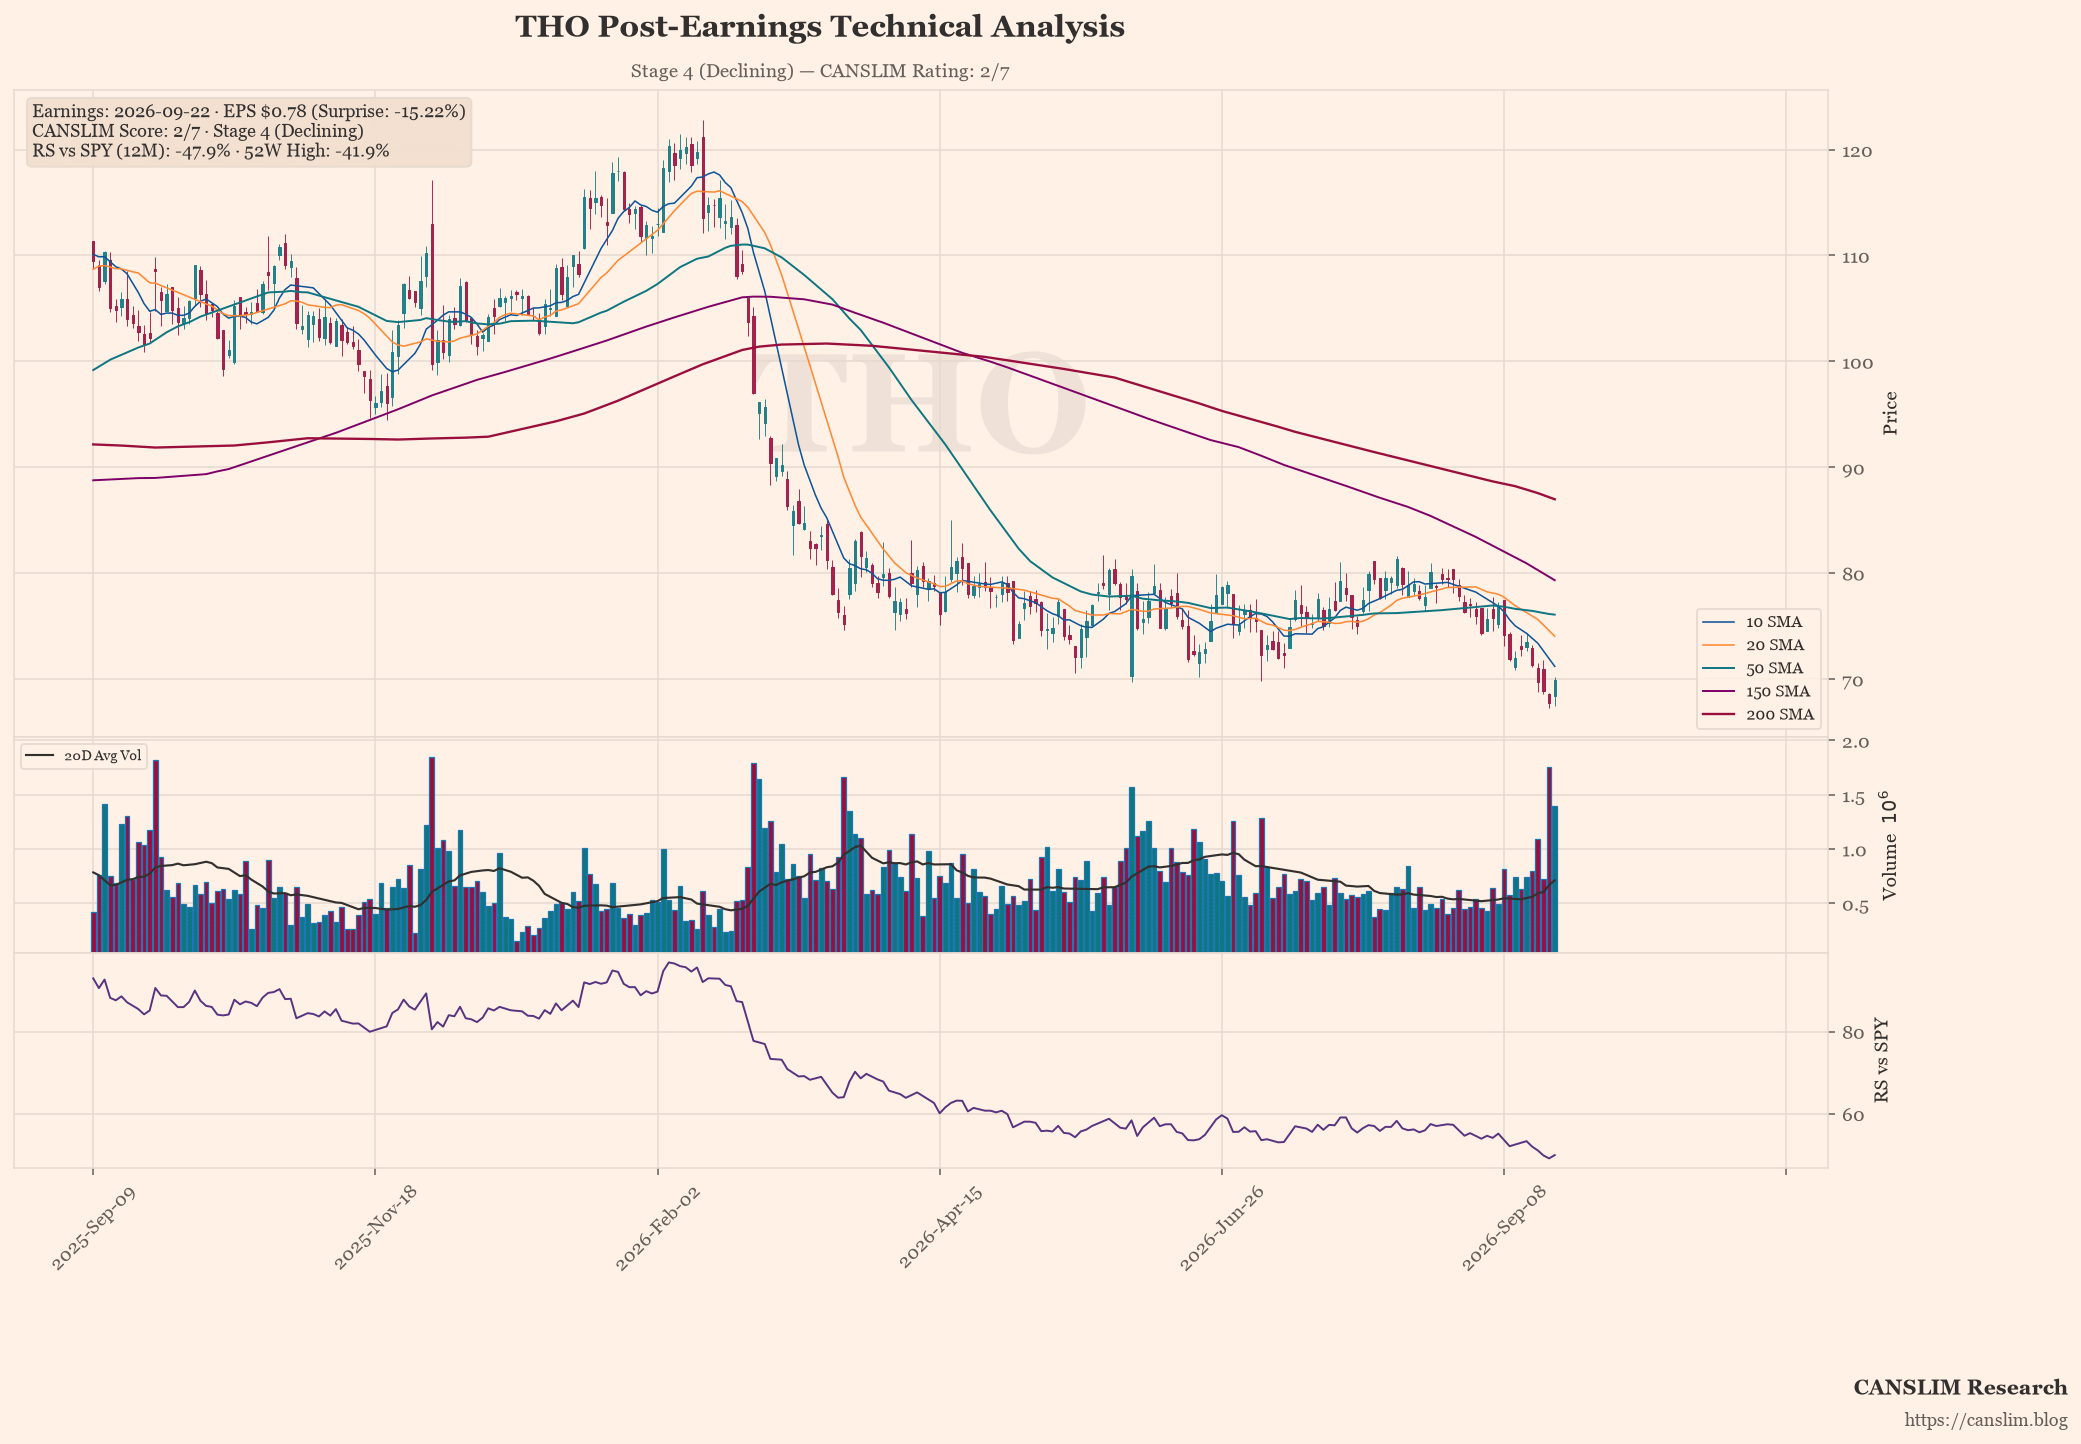
Thermo Fisher Scientific (THO) delivered disappointing third-quarter results, with earnings per share settling at $0.78, significantly below the analyst consensus of $0.92 and representing a miss of over 15%. This shortfall coincided with a year-over-year revenue contraction of approximately 4%, indicating that growth momentum has stalled despite broader market conditions. The failure to meet guidance suggests underlying operational pressures are outweighing any potential recovery in demand.
From a technical perspective, the share price currently trades at $69.94, well below its 50-day moving average of $76.09 and significantly underperforming the 200-day line at $87.00. This positioning places THO firmly in Stage 4 of the CANSLIM framework, a period characterised by extended declines and weak institutional accumulation. The stock has retreated over 41% from its recent highs, with no immediate signs of stabilisation or reversal, suggesting that further downside could be tested before any meaningful support is found.
Looking ahead, investors should remain cautious as the company faces significant headwinds in a declining market environment. Forward catalysts will likely depend on whether management can stabilise margins and restore revenue growth in the coming quarters, but current operational risks appear elevated. Until evidence of a trend reversal emerges, the technical structure remains bearish, with institutional favour shifting towards more resilient equities.
Earnings & Quantitative Scorecard
| Key Metric | Reported / Current | Benchmark / Consensus | Status |
|---|---|---|---|
| Quarterly EPS (C) | $0.78 (+-67% YoY) | $0.92 (Surprise: -15.2%) | Fail |
| Quarterly Revenue | $2.78B (-3.9% YoY) | Top-line Growth | Neutral |
| Annual EPS Growth (A) | +-38%/yr | ≥25% Annual CAGR | Fail |
| 52-Week High Range (N) | -41.9% off high | Within 15% of High | Lagging |
| Relative Strength (L) | -47.9% vs SPY | Positive Alpha | Fail |
| Institutional Float (I) | 108% | 30% – 90% Float Ownership | Neutral |
| Minervini Trend Template | 0 / 7 Criteria | Stage 2 Uptrend Alignment | Stage 4 (Declining) |
| Composite CANSLIM Rating | 2 / 7 Pillars | Institutional Quality Setup | 🔴 Lagging / Deteriorating |
Stage, pattern and sentiment labels are generated by rule-based approximations (Weinstein stage analysis, Minervini trend template and heuristic pattern detection), not by precise technical analysis. Data as of September 22, 2026. For informational and educational purposes only — not investment advice. Always verify against primary sources before making any investment decision.
Discover more from CANSLIM Research
Subscribe to get the latest posts sent to your email.