Eben@CANSLIM Research
Institutional Analysis & Market Backdrop
FRO delivered a compelling narrative of aggressive expansion, with year-on-year revenue surging by nearly 67%, driven largely by its core product lines and market penetration. However, the company narrowly missed analyst expectations on earnings per share, reporting 2.61 against a consensus of 2.62, representing a -0.49% surprise. This divergence suggests that while top-line growth remains robust, operating leverage is currently under pressure, likely due to increased investment in capacity or supply chain adjustments.
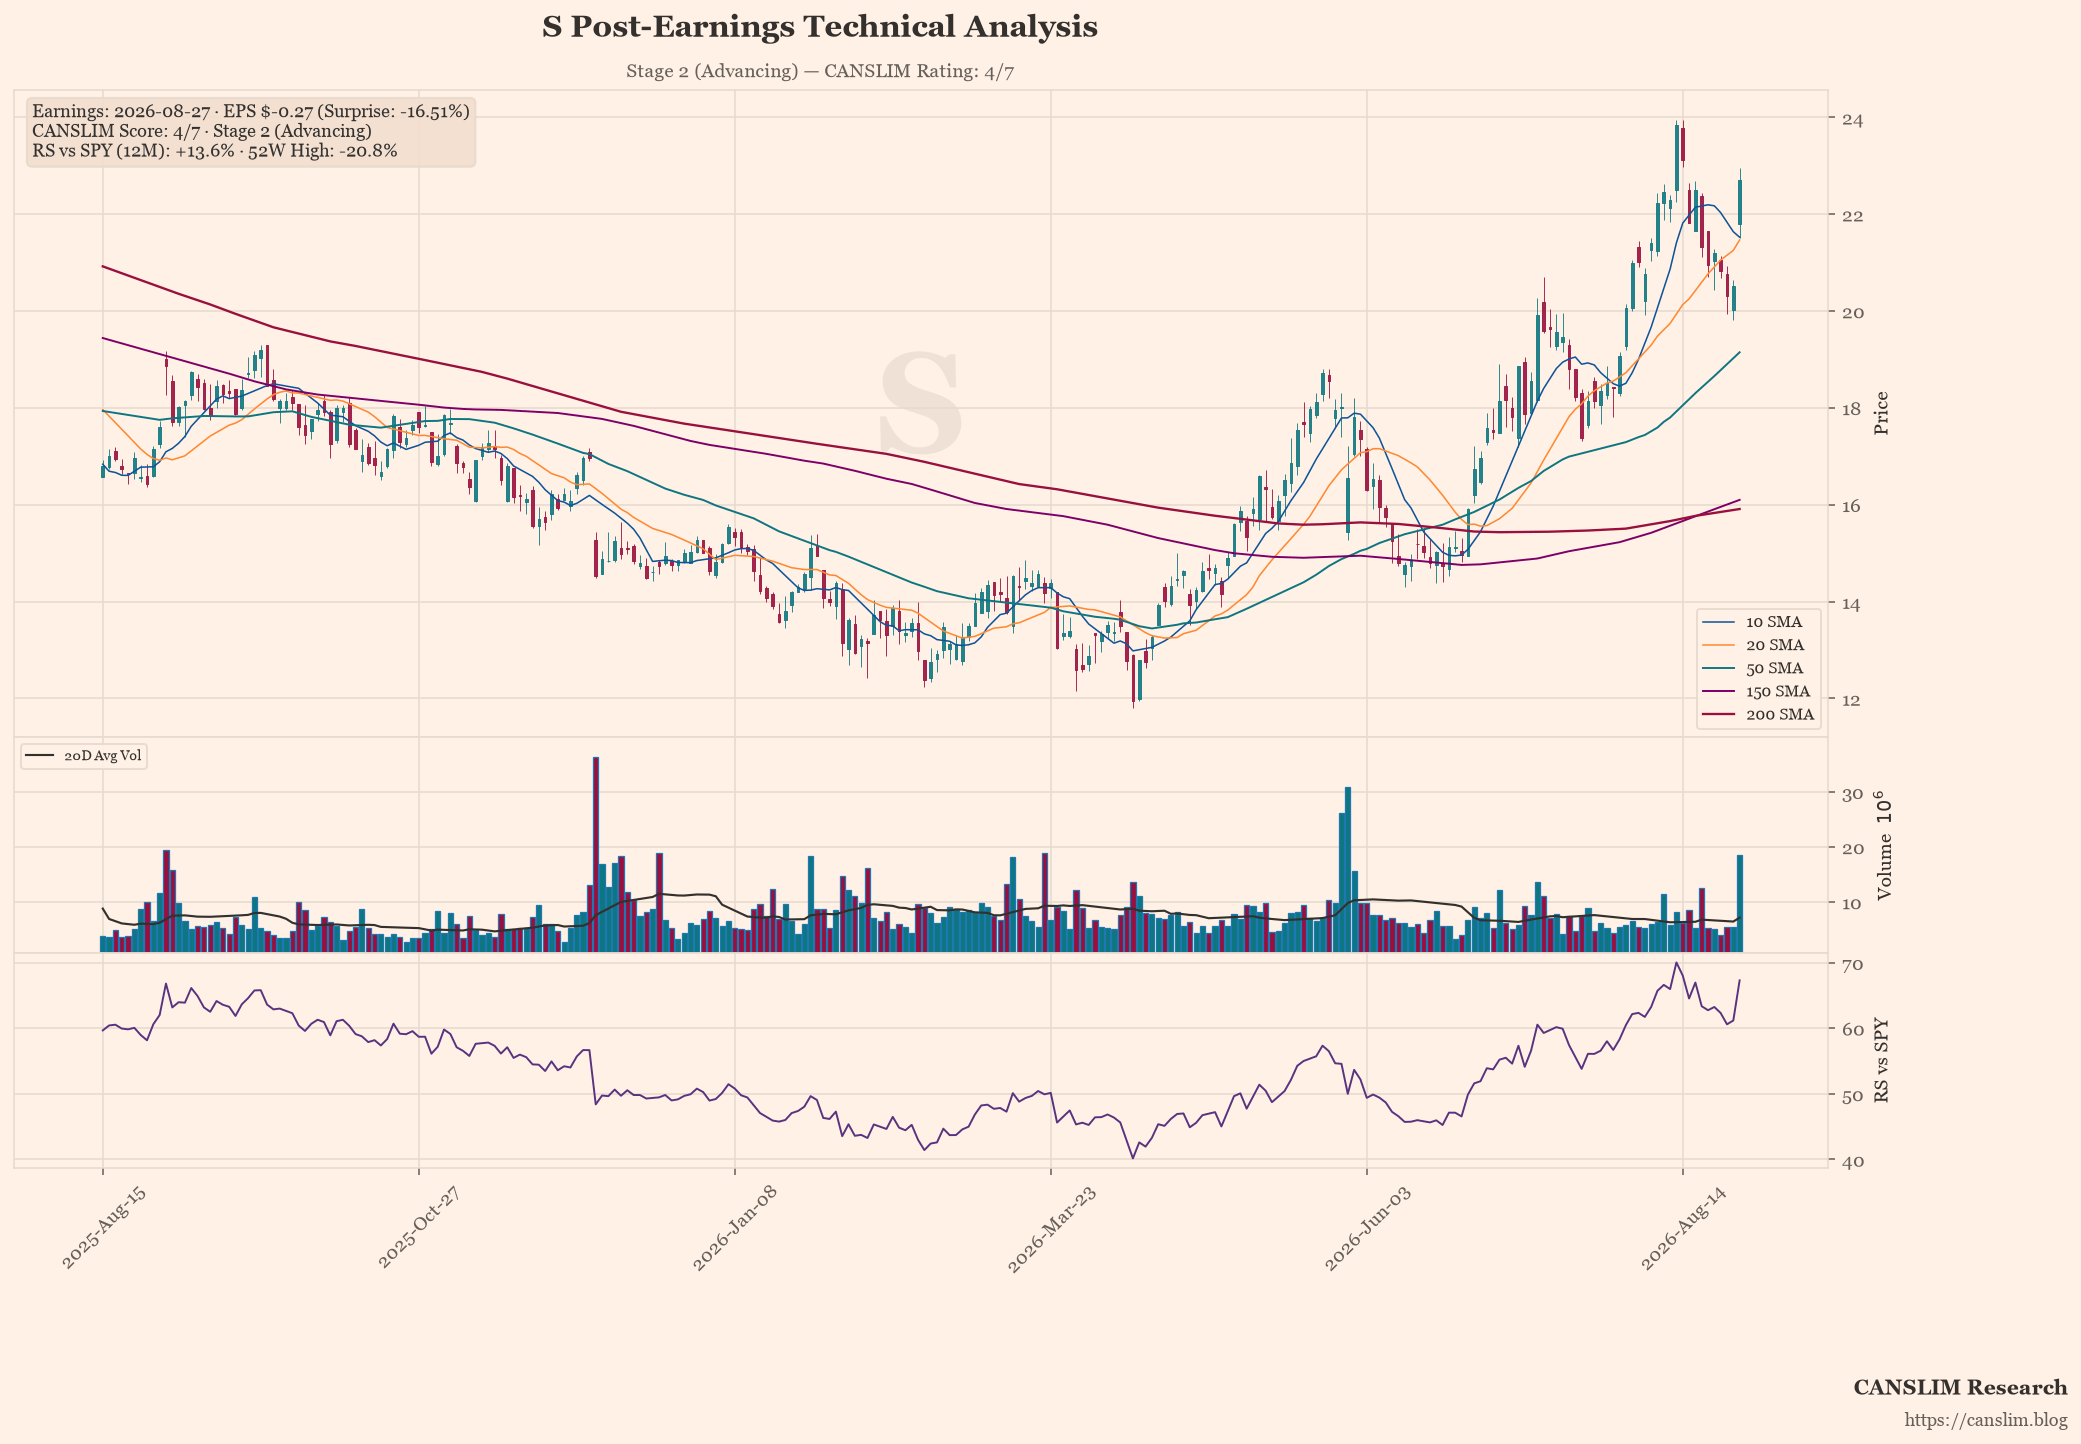
Technically, the share price of 43.75p sits comfortably above the critical 50-day moving average at 39.31p and the 200-day mean at 33.00p, indicating a strong institutional bias favouring accumulation. The stock is currently in Stage 2 (Advancing), having only dipped 1.57% from its recent high, which signals resilience despite the earnings miss. With a CANSLIM score of 6/7, the asset demonstrates solid momentum and volume characteristics, suggesting that the market has already priced in the near-term headwinds.
Looking ahead, institutional investors should monitor the company’s ability to stabilise margins as it scales its operations, with forward catalysts including potential new product launches and international expansion plans. Risks remain concentrated in execution against the rapid growth trajectory and any unforeseen cost escalations that could further widen the gap between revenue and profit. For now, the technical structure supports a bullish outlook, provided earnings per share can be stabilised in the coming quarters.
Earnings & Quantitative Scorecard
| Key Metric | Reported / Current | Benchmark / Consensus | Status |
|---|---|---|---|
| Quarterly EPS (C) | $2.61 (+625% YoY) | $2.62 (Surprise: -0.5%) | Pass |
| Quarterly Revenue | $714.2M (+66.9% YoY) | Top-line Growth | Pass |
| Annual EPS Growth (A) | +-8%/yr | ≥25% Annual CAGR | Fail |
| 52-Week High Range (N) | -1.6% off high | Within 15% of High | Pass |
| Relative Strength (L) | +94.4% vs SPY | Positive Alpha | Pass |
| Institutional Float (I) | 40% | 30% – 90% Float Ownership | Pass |
| Minervini Trend Template | 7 / 7 Criteria | Stage 2 Uptrend Alignment | Stage 2 (Advancing) |
| Composite CANSLIM Rating | 6 / 7 Pillars | Institutional Quality Setup | 🟢 Strong Momentum Candidate |
Stage, pattern and sentiment labels are generated by rule-based approximations (Weinstein stage analysis, Minervini trend template and heuristic pattern detection), not by precise technical analysis. Data as of August 28, 2026. For informational and educational purposes only — not investment advice. Always verify against primary sources before making any investment decision.
Discover more from CANSLIM Research
Subscribe to get the latest posts sent to your email.