 Eben@CANSLIM Research
Institutional Analysis & Market Backdrop
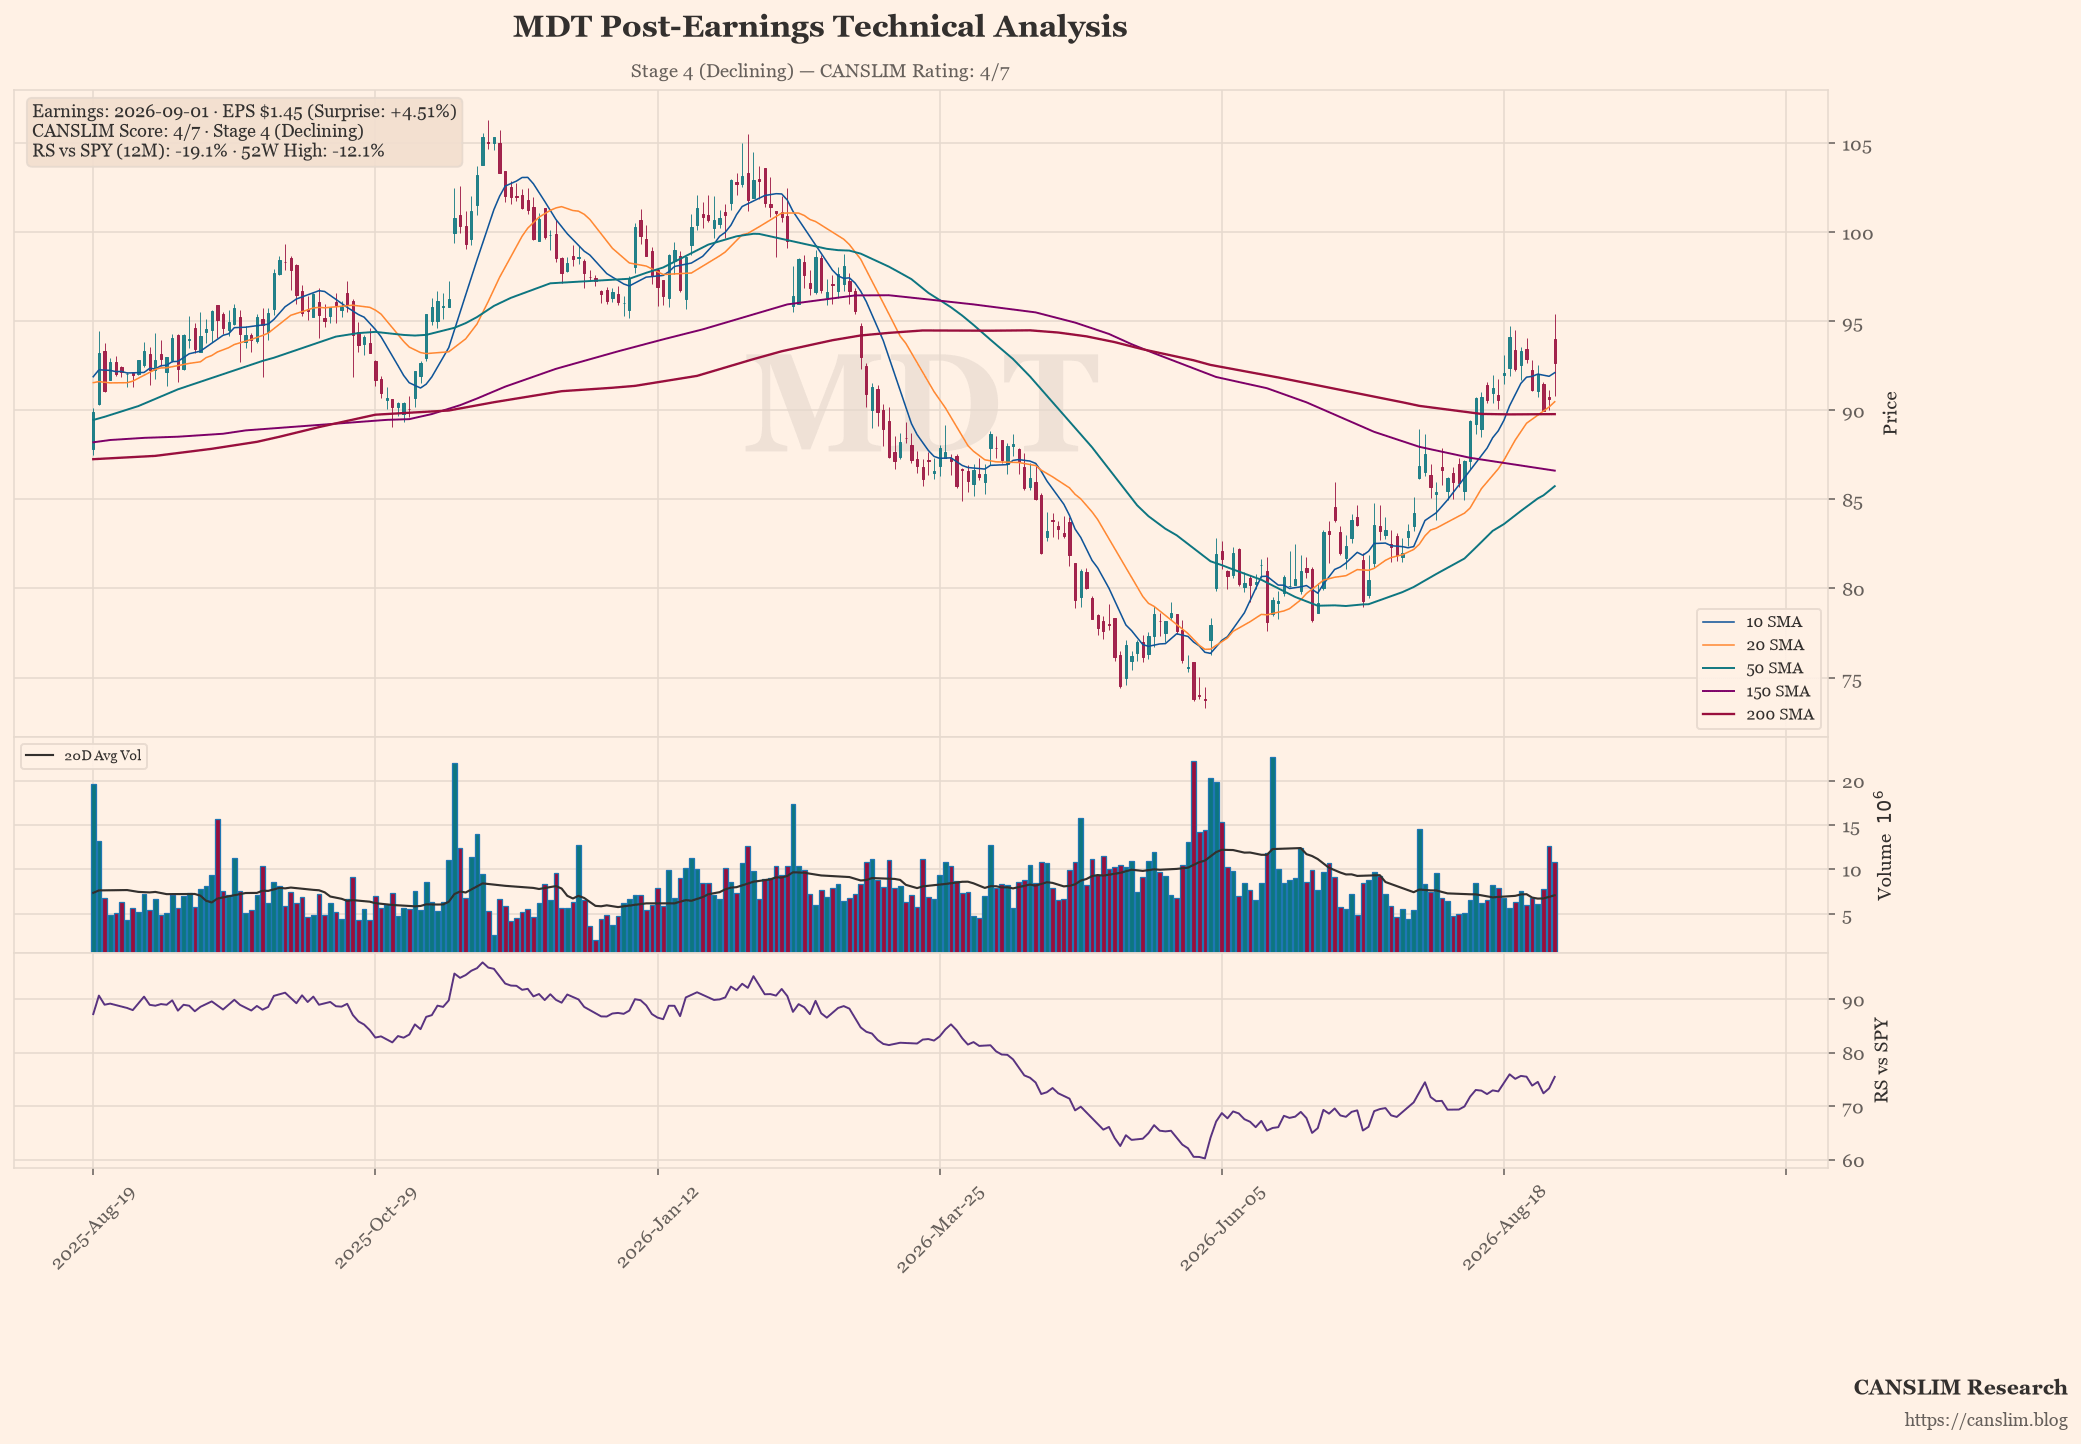
Medtronic (MDT) reported fiscal third-quarter results that exceeded Wall Street expectations, posting earnings per share of $1.45 against a consensus estimate of $1.39. This represents a positive surprise of 4.51%, primarily attributed to robust revenue growth of nearly 9.9% year-on-year. The company’s ability to maintain margin expansion despite macro-headwinds has been favouring investor sentiment, although the headline figures mask underlying headwinds in its core implantable cardioverter-defibrillator segment.
From a technical perspective, MDT is currently operating in Stage 4, a phase characterised by a distinct decline from recent highs. The share price of $92.64 sits below critical moving average support levels, specifically the 50-day MA at $85.75 and the 200-day MA at $89.79. While the CANSLIM score remains at 4 out of 7 points—indicating moderate institutional interest—the lack of a confirmed breakout above resistance suggests that further downside volatility is likely before any meaningful reversal occurs.
Looking forward, institutional investors should monitor for catalysts related to the company’s strategic pivot towards digital health and robotics, which could provide the necessary momentum to exit Stage 4. However, operational risks persist regarding regulatory approvals in key international markets and potential supply chain disruptions affecting raw material costs. Until clear evidence of sustained earnings acceleration appears alongside a technical reversion to a higher timeframe trend, the prevailing market view remains cautious on MDT’s immediate upside potential.
Earnings & Quantitative Scorecard
| Key Metric | Reported / Current | Benchmark / Consensus | Status |
|---|---|---|---|
| Quarterly EPS (C) | $1.45 (+15% YoY) | $1.39 (Surprise: +4.5%) | Fail |
| Quarterly Revenue | $9.81B (+9.9% YoY) | Top-line Growth | Pass |
| Annual EPS Growth (A) | +-1%/yr | ≥25% Annual CAGR | Fail |
| 52-Week High Range (N) | -12.1% off high | Within 15% of High | Pass |
| Relative Strength (L) | -19.1% vs SPY | Positive Alpha | Fail |
| Institutional Float (I) | 89% | 30% – 90% Float Ownership | Pass |
| Minervini Trend Template | 3 / 7 Criteria | Stage 2 Uptrend Alignment | Stage 4 (Declining) |
| Composite CANSLIM Rating | 4 / 7 Pillars | Institutional Quality Setup | 🟡 Developing / Watchlist |
Stage, pattern and sentiment labels are generated by rule-based approximations (Weinstein stage analysis, Minervini trend template and heuristic pattern detection), not by precise technical analysis. Data as of September 02, 2026. For informational and educational purposes only — not investment advice. Always verify against primary sources before making any investment decision.
Discover more from CANSLIM Research
Subscribe to get the latest posts sent to your email.