 Andrew@CANSLIM RESEARCH
The Fear Trade Just Got a New Leader
Wall Street has a new number one worry. It is no longer an AI bubble. Bank of America’s latest fund manager survey shows a disorderly jump in bond yields is now the top fear. The tape agrees. The 10-year Treasury yield pushed above 5%, the highest since 2007. Brent crude surged past $100 on Middle East supply risks. Stock futures opened weaker. Investors now brace for a Fed meeting that could bring a hike, not a pause.
Oil Above $100 Rewrites the Fed Script
The Saudi East-West pipeline is still closed after a drone attack. That cuts 4 million barrels per day of export capacity. Repairs may take 5-6 weeks. Brent briefly neared $110. Energy stocks finally moved with oil: XLE +1.08%, XOM +1.23%, CVX +1.29%, VLO +1.73%. This supply shock feeds inflation. It makes a Fed hike look more likely. Futures price a 92% chance of a 25bp hike tomorrow. That would be the first hike since July 2023.
The Online Crowd Has Lost Its Map
Global social sentiment sits at “angry neutrality.” Bulls and bears are both losing money. The crowd cannot explain a market where yields are above 5%, oil is over $100, and two oil routes are disrupted, yet the index sits just 2% below its all-time high. So they turn to conspiracy talk and nihilistic memes. The Fear & Greed Index reads about 35/100. Some note it nears “Extreme Fear” while SPY is down only 2.5%. That gap is the market’s central contradiction. Talk of holding cash rose sharply. But real crash pricing is absent. The VIX stays below 17.
Mega-Cap Tech Holds the Line, For Now
The AI trade is not dead. It is getting narrower. Fundstrat says the Magnificent Seven is close to a breakout. Data-center demand still lifts names like Coherent and Axelera. But other coverage warns of an AI buildout slowdown. Higher rates and tighter financing could bite infrastructure-heavy spending first. Watch the Fed decision, Treasury yields, oil, and whether funding costs crack high-multiple tech or just rotate leadership inside it. The Trump-Xi meeting later this month adds another layer. Trade and export controls could pressure chips and China exposure.
Crypto Stocks Crack Under a Washington Vote
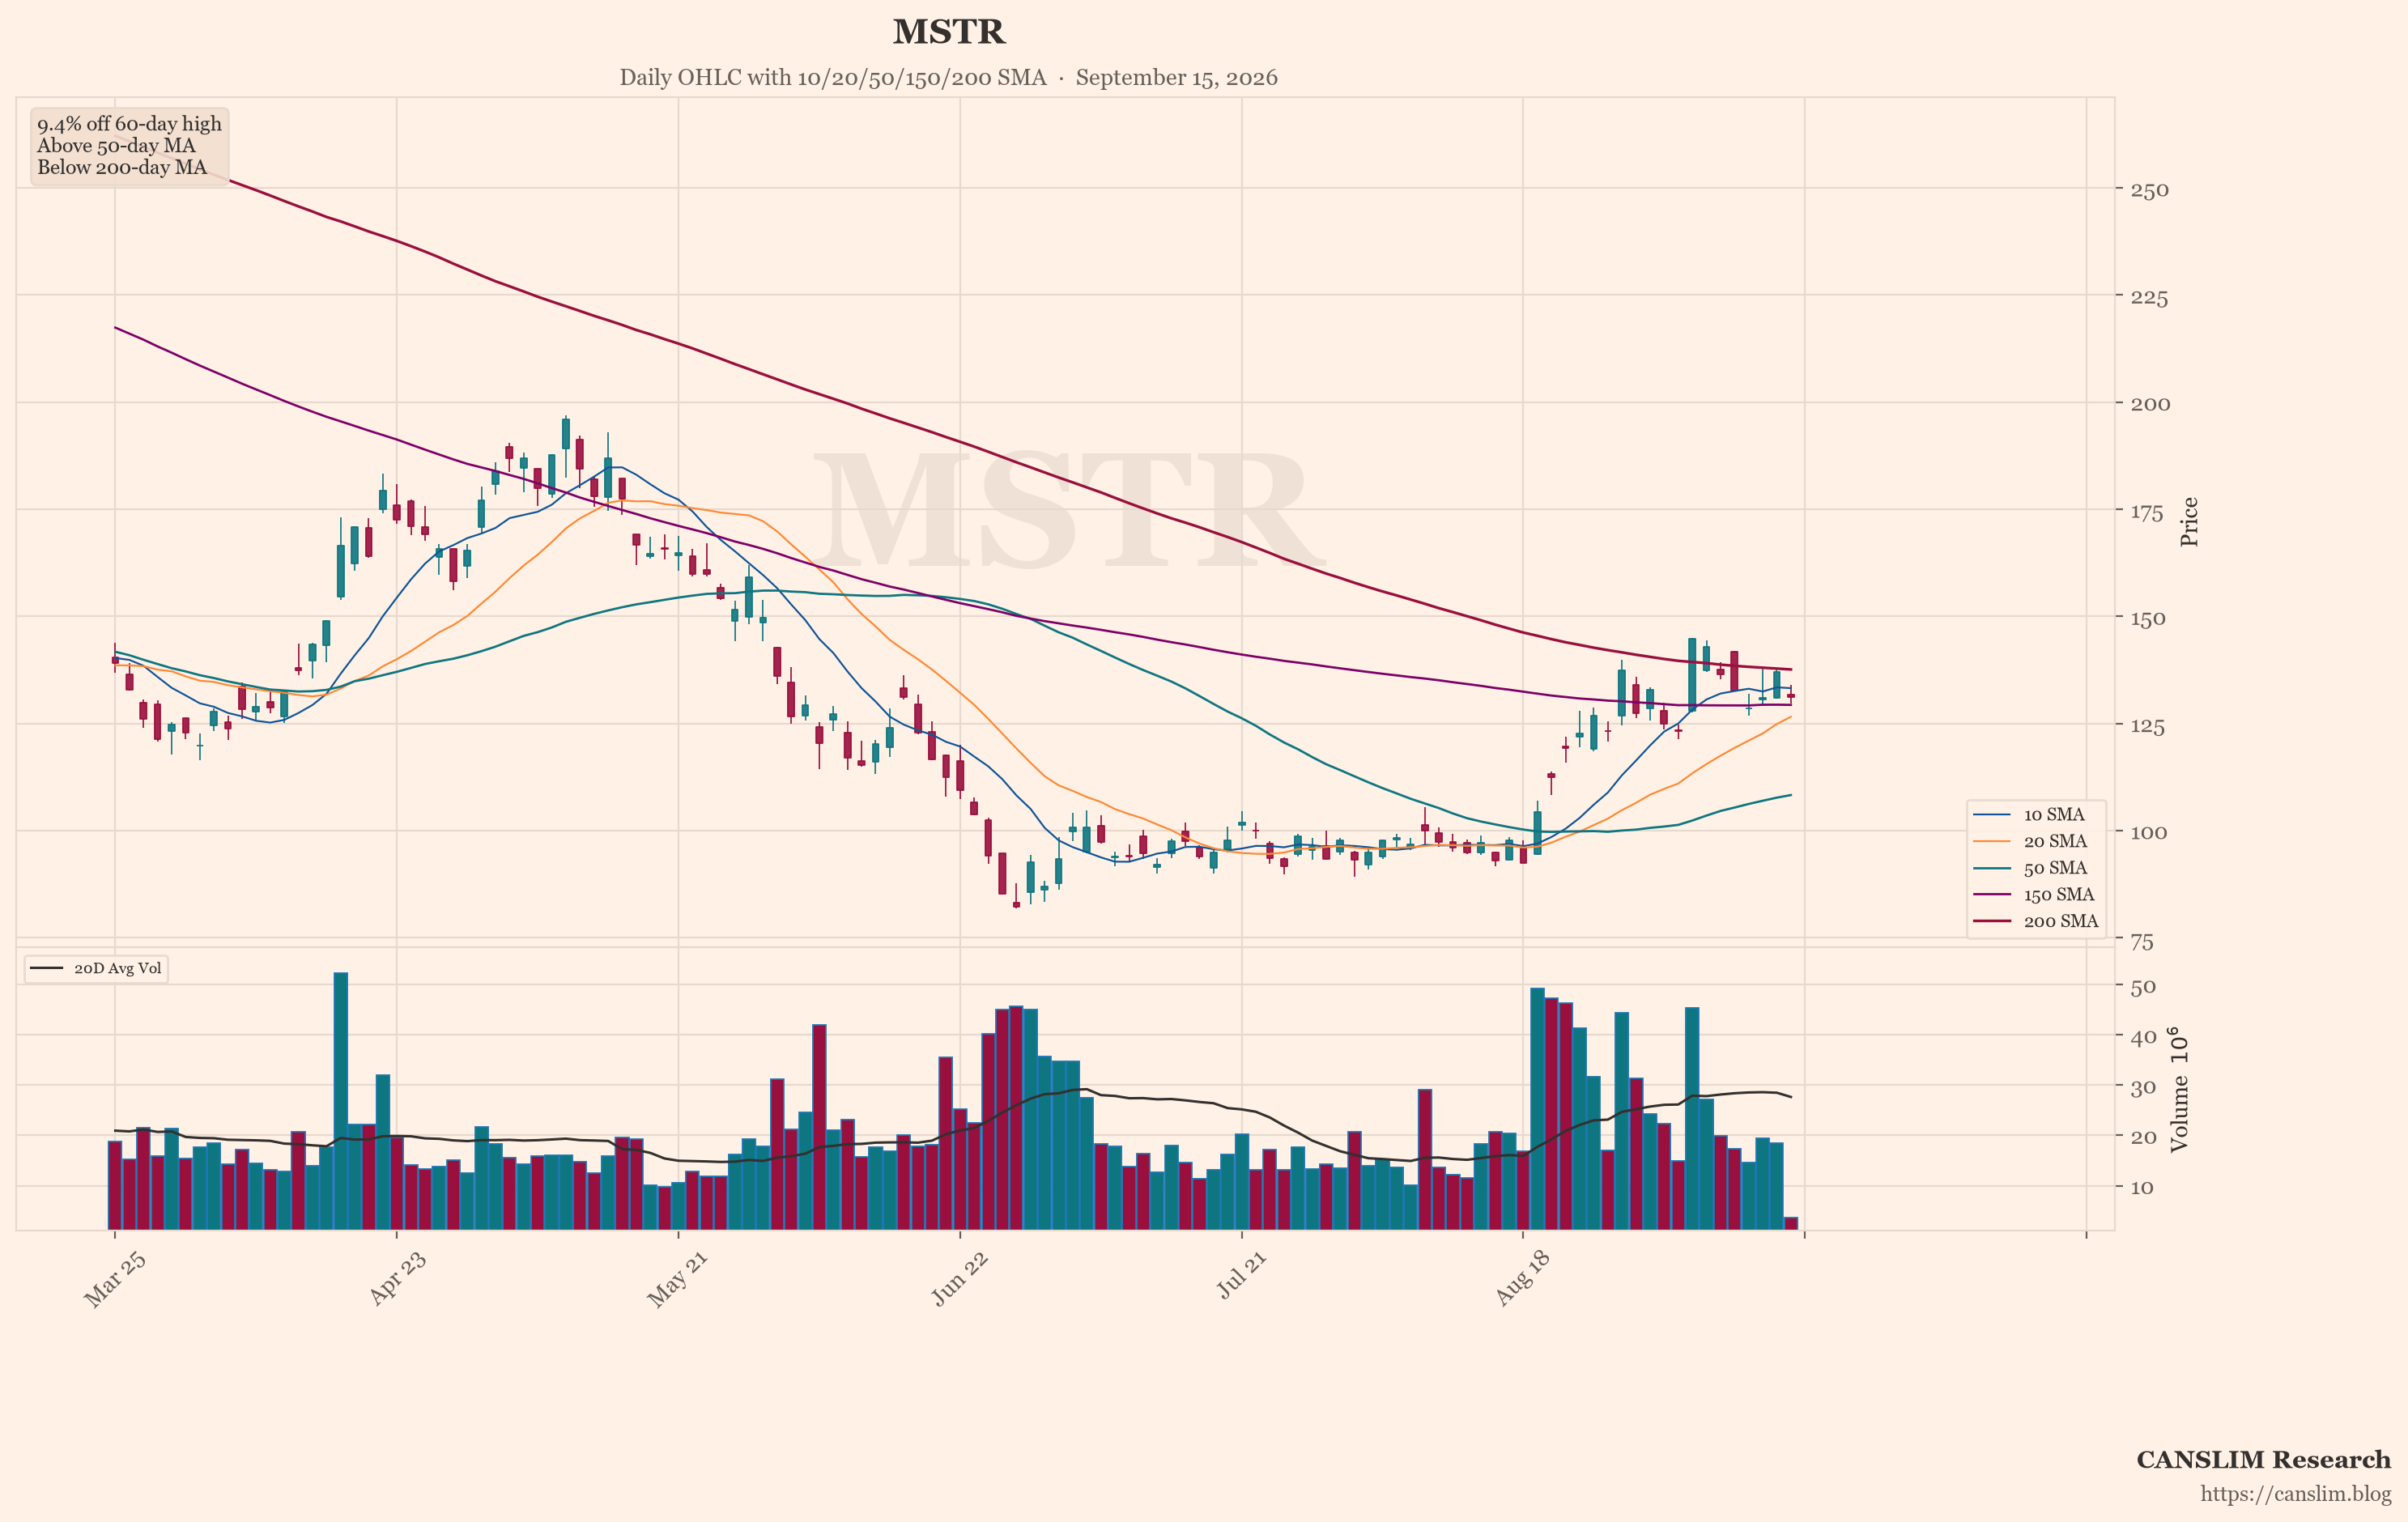
A procedural vote on the CLARITY Act needs 60 votes. That means 53 Republicans need at least seven Democrats. Crypto names sold off hard at the open: CRCL -8.23%, COIN -6.00%, and MSTR -4.59%. Our featured chart, MSTR, now shows the weakest technical pattern of the group. It broke down before the others and cannot reclaim its moving averages. That is a warning. When the weakest chart in a hot group fails first, it often signals distribution, not opportunity. Growth investors should treat MSTR as a tell, not a buy.
Where the Next Move Gets Decided
The near-term watchlist is short and clear. First, the Fed. A 25bp hike is priced in. The real debate is stranger: some say no hike would be the true disaster, because it signals lost credibility and could send the 10-year toward 6%. A minority wants a bigger 50-100bp hike to restore trust fast. Second, the bond market itself. The crowd now calls it “the captain.” They see 5% not as a cycle peak but as sovereign-credit repricing. Third, oil. The supply shock is real and slow to fix.
Leaders Stay Strong While the Crowd Waits
Semiconductor and optical networking names tied to data-center spending still see strong demand. That supports more AI capex ahead. But a buildout slowdown would hit infrastructure, energy, and hardware suppliers first. Software may hold up better. The tactical consensus online is simple: avoid big positions and wait until after the Fed. That is not fear. It is a stalemate. Bulls win because “it didn’t fall again.” Bears win because “fundamentals got worse.” Neither side is proven wrong. In a sideways market like this, the bond market leads, oil confirms, and only the strongest charts deserve your capital.
Sources: market news brief & global social sentiment data. Updated 2026-09-15 22:00 HKT. For educational purposes only — not investment advice.
Discover more from CANSLIM Research
Subscribe to get the latest posts sent to your email.