 Eben@CANSLIM Research
Institutional Analysis & Market Backdrop
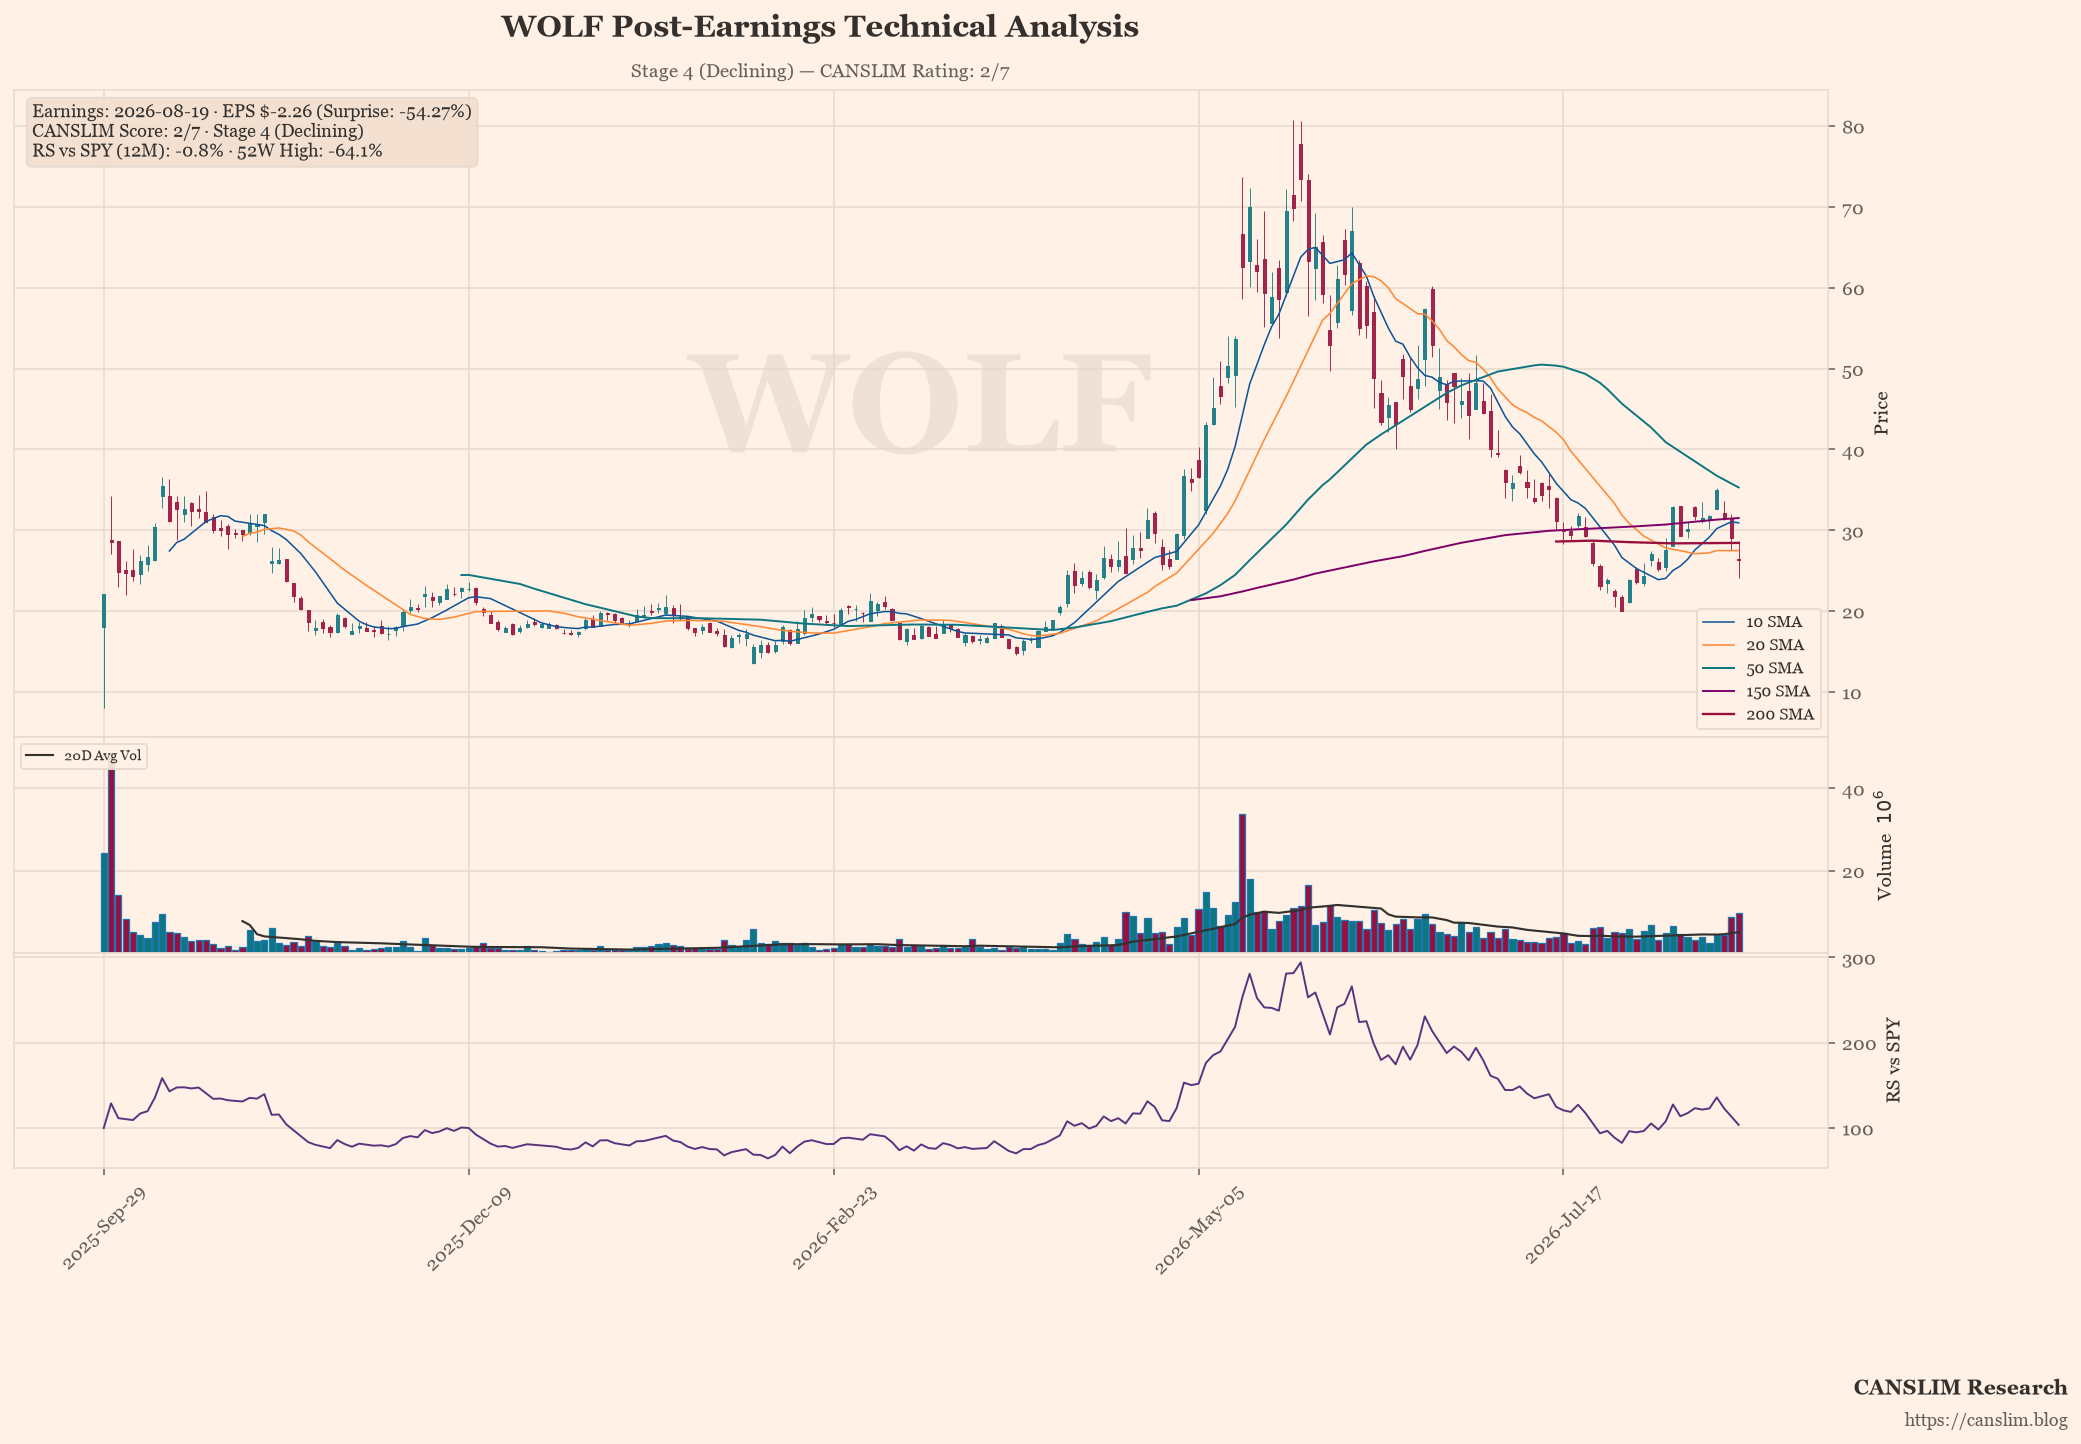
Wolf AI delivered another disappointing report for investors on Friday, posting a loss per share of $2.26 against an expected deficit of only -$1.46. This represents a severe miss by more than half the consensus estimate and signals accelerating operational headwinds that have not yet stabilised revenue growth. The company’s top line contracted significantly year-on-year at -17%, indicating that its current business model is failing to generate sufficient cash flow or market traction despite aggressive expansion efforts in recent quarters.
From a technical perspective, the share price of $26.35 sits far below both the 50-day moving average ($35.30) and the crucial 200-day support zone at roughly $28.43, confirming that institutional buying has evaporated during this downturn. With only two out of seven CANSLIM criteria currently satisfied, the stock remains in Stage 4 (Declining), suggesting a prolonged period where price action will likely continue to test lower levels before any meaningful reversal can occur.
Looking ahead, management must demonstrate improved cost discipline and clearer revenue visibility to regain investor favour. The primary catalysts for recovery would involve successful product launches or strategic partnerships that could offset the current operational drag, though significant risks remain regarding sustained demand erosion in key vertical markets.
Earnings & Quantitative Scorecard
| Key Metric | Reported / Current | Benchmark / Consensus | Status |
|---|---|---|---|
| Quarterly EPS (C) | $-2.26 (+-194% YoY) | $-1.46 (Surprise: -54.3%) | Fail |
| Quarterly Revenue | $150.2M (-16.8% YoY) | Top-line Growth | Neutral |
| Annual EPS Growth (A) | N/A | ≥25% Annual CAGR | Fail |
| 52-Week High Range (N) | -64.1% off high | Within 15% of High | Lagging |
| Relative Strength (L) | -0.8% vs SPY | Positive Alpha | Fail |
| Institutional Float (I) | 134% | 30% – 90% Float Ownership | Neutral |
| Minervini Trend Template | 3 / 7 Criteria | Stage 2 Uptrend Alignment | Stage 4 (Declining) |
| Composite CANSLIM Rating | 2 / 7 Pillars | Institutional Quality Setup | 🔴 Lagging / Deteriorating |
Stage, pattern and sentiment labels are generated by rule-based approximations (Weinstein stage analysis, Minervini trend template and heuristic pattern detection), not by precise technical analysis. Data as of August 21, 2026. For informational and educational purposes only — not investment advice. Always verify against primary sources before making any investment decision.
Discover more from CANSLIM Research
Subscribe to get the latest posts sent to your email.