 Eben@CANSLIM Research
Institutional Analysis & Market Backdrop
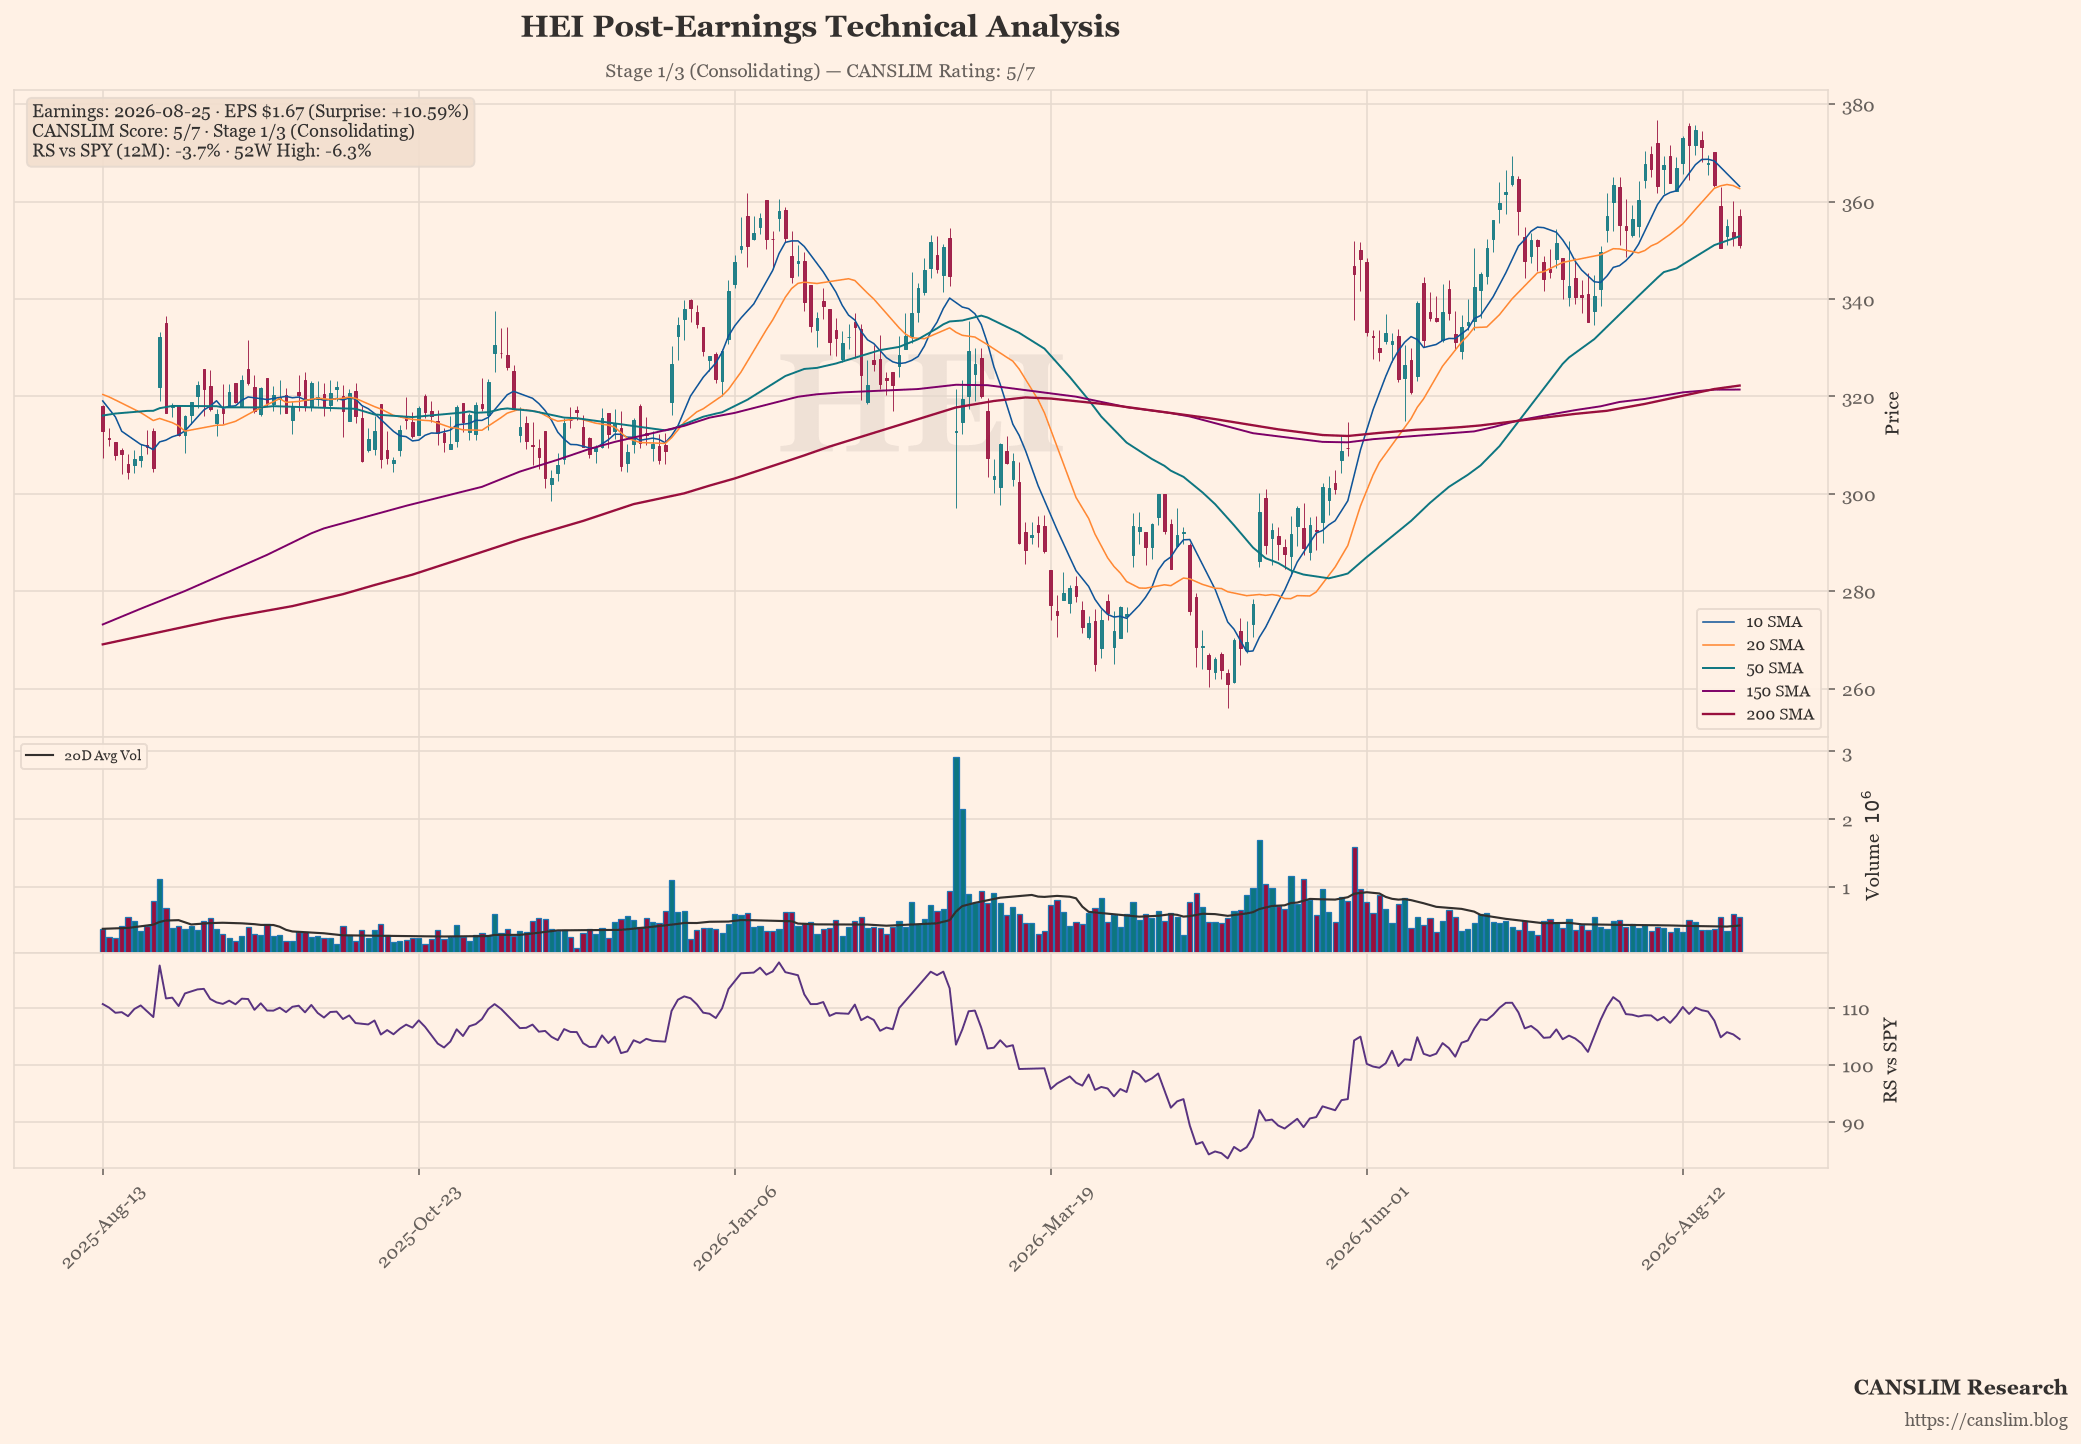
Honeywell International (HEI) has exceeded Wall Street expectations with reported earnings per share of $1.67, significantly outperforming the consensus estimate of $1.51 by 10.59%. This positive surprise was underpinned by a revenue increase of over 25% year-on-year, reflecting strong demand across its industrial and aerospace sectors despite broader market headwinds. The company’s ability to maintain margin integrity while scaling operations demonstrates effective cost management, positioning it favourably for continued investor confidence.
From a technical perspective, HEI currently trades at $351.05, hovering just below the 50-day moving average of $352.91, which suggests near-term resistance before potential consolidation. However, the stock retains significant support from the 200-day moving average at approximately $322.25, indicating that a deeper correction is unlikely unless macroeconomic signals deteriorate. With a CANSLIM score of 5 out of 7 points, the stock exhibits strong momentum and volume characteristics but lacks immediate catalysts for an explosive breakout until it clears the short-term resistance zone.
Looking ahead, institutional investors should monitor HEI’s progress through Stage 1 of its three-stage growth cycle, where the focus remains on stabilising market share and refining operational efficiency. Key forward catalysts include upcoming guidance revisions regarding aerospace recovery rates and potential strategic acquisitions in energy transition technologies. Conversely, risks remain elevated if global industrial spending slows or if raw material costs escalate, which could temper the current bullish sentiment until further technical confirmation occurs.
Earnings & Quantitative Scorecard
| Key Metric | Reported / Current | Benchmark / Consensus | Status |
|---|---|---|---|
| Quarterly EPS (C) | $1.67 (+33% YoY) | $1.51 (Surprise: +10.6%) | Pass |
| Quarterly Revenue | $1.38B (+25.3% YoY) | Top-line Growth | Pass |
| Annual EPS Growth (A) | +24%/yr | ≥25% Annual CAGR | Fail |
| 52-Week High Range (N) | -6.3% off high | Within 15% of High | Pass |
| Relative Strength (L) | -3.7% vs SPY | Positive Alpha | Fail |
| Institutional Float (I) | 81% | 30% – 90% Float Ownership | Pass |
| Minervini Trend Template | 5 / 7 Criteria | Stage 2 Uptrend Alignment | Stage 1/3 (Consolidating) |
| Composite CANSLIM Rating | 5 / 7 Pillars | Institutional Quality Setup | 🟡 Developing / Watchlist |
Stage, pattern and sentiment labels are generated by rule-based approximations (Weinstein stage analysis, Minervini trend template and heuristic pattern detection), not by precise technical analysis. Data as of August 26, 2026. For informational and educational purposes only — not investment advice. Always verify against primary sources before making any investment decision.
Discover more from CANSLIM Research
Subscribe to get the latest posts sent to your email.