 Eben@CANSLIM Research
Institutional Analysis & Market Backdrop
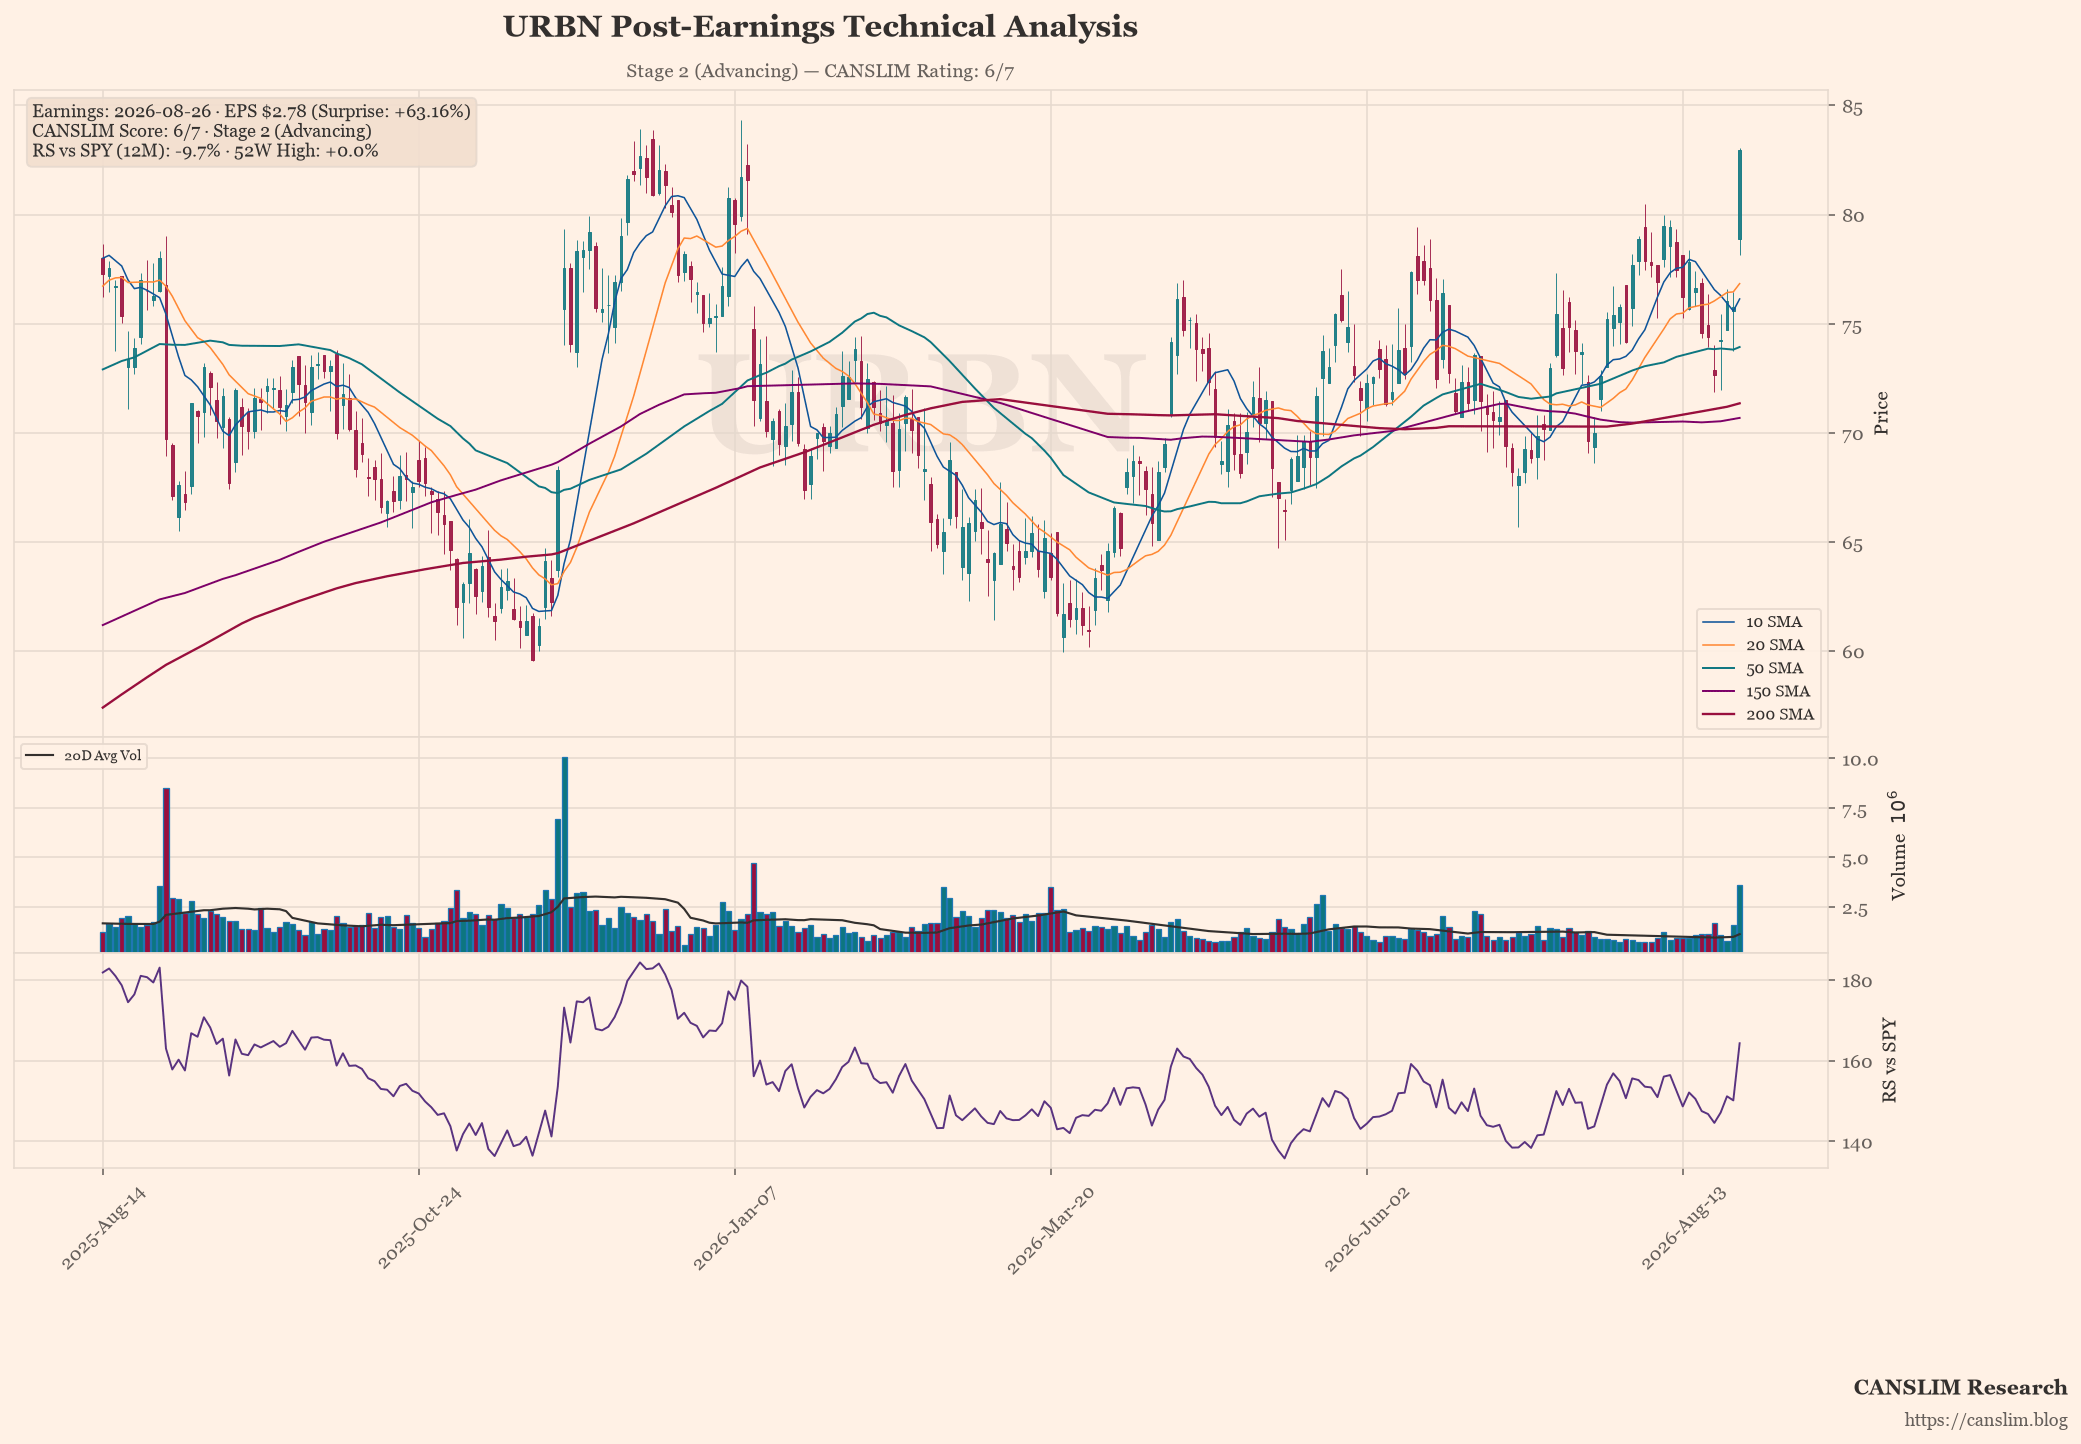
Urban Outfitters (URBN) has delivered a resounding surprise to Wall Street, reporting earnings per share of $2.78 against a consensus estimate of $1.70, representing a staggering 63.16% beat that underscores the strength of its digital transformation strategy. Revenue growth of 11.4% year-on-year indicates robust demand across core categories, driven by successful omnichannel integration and resilient consumer spending in the leisure apparel sector.
From a technical perspective, URBN is firmly established in Stage 2 (Advancing), trading at $82.95 with significant support provided by the 50-day moving average at $73.93 and the 200-day mean at $71.35. The stock remains flat relative to its recent high, suggesting institutional accumulation rather than speculative frenzy, which aligns favourably with CANSLIM criteria for a sustainable uptrend.
Looking ahead, institutional investors should monitor forward catalysts such as full-year guidance revisions and the continued performance of its subscription-based membership model, though operational risks remain tied to supply chain volatility and competitive pressure in the fast-fashion space. The current valuation appears justified given the earnings quality and technical structure, presenting a compelling opportunity for long-term holders.
Earnings & Quantitative Scorecard
| Key Metric | Reported / Current | Benchmark / Consensus | Status |
|---|---|---|---|
| Quarterly EPS (C) | $2.78 (+76% YoY) | $1.7 (Surprise: +63.2%) | Pass |
| Quarterly Revenue | $1.48B (+11.4% YoY) | Top-line Growth | Pass |
| Annual EPS Growth (A) | +44%/yr | ≥25% Annual CAGR | Pass |
| 52-Week High Range (N) | +0.0% off high | Within 15% of High | Pass |
| Relative Strength (L) | -9.7% vs SPY | Positive Alpha | Fail |
| Institutional Float (I) | 75% | 30% – 90% Float Ownership | Pass |
| Minervini Trend Template | 6 / 7 Criteria | Stage 2 Uptrend Alignment | Stage 2 (Advancing) |
| Composite CANSLIM Rating | 6 / 7 Pillars | Institutional Quality Setup | 🟢 Strong Momentum Candidate |
Stage, pattern and sentiment labels are generated by rule-based approximations (Weinstein stage analysis, Minervini trend template and heuristic pattern detection), not by precise technical analysis. Data as of August 27, 2026. For informational and educational purposes only — not investment advice. Always verify against primary sources before making any investment decision.
Discover more from CANSLIM Research
Subscribe to get the latest posts sent to your email.