 Eben@CANSLIM Research
Institutional Analysis & Market Backdrop
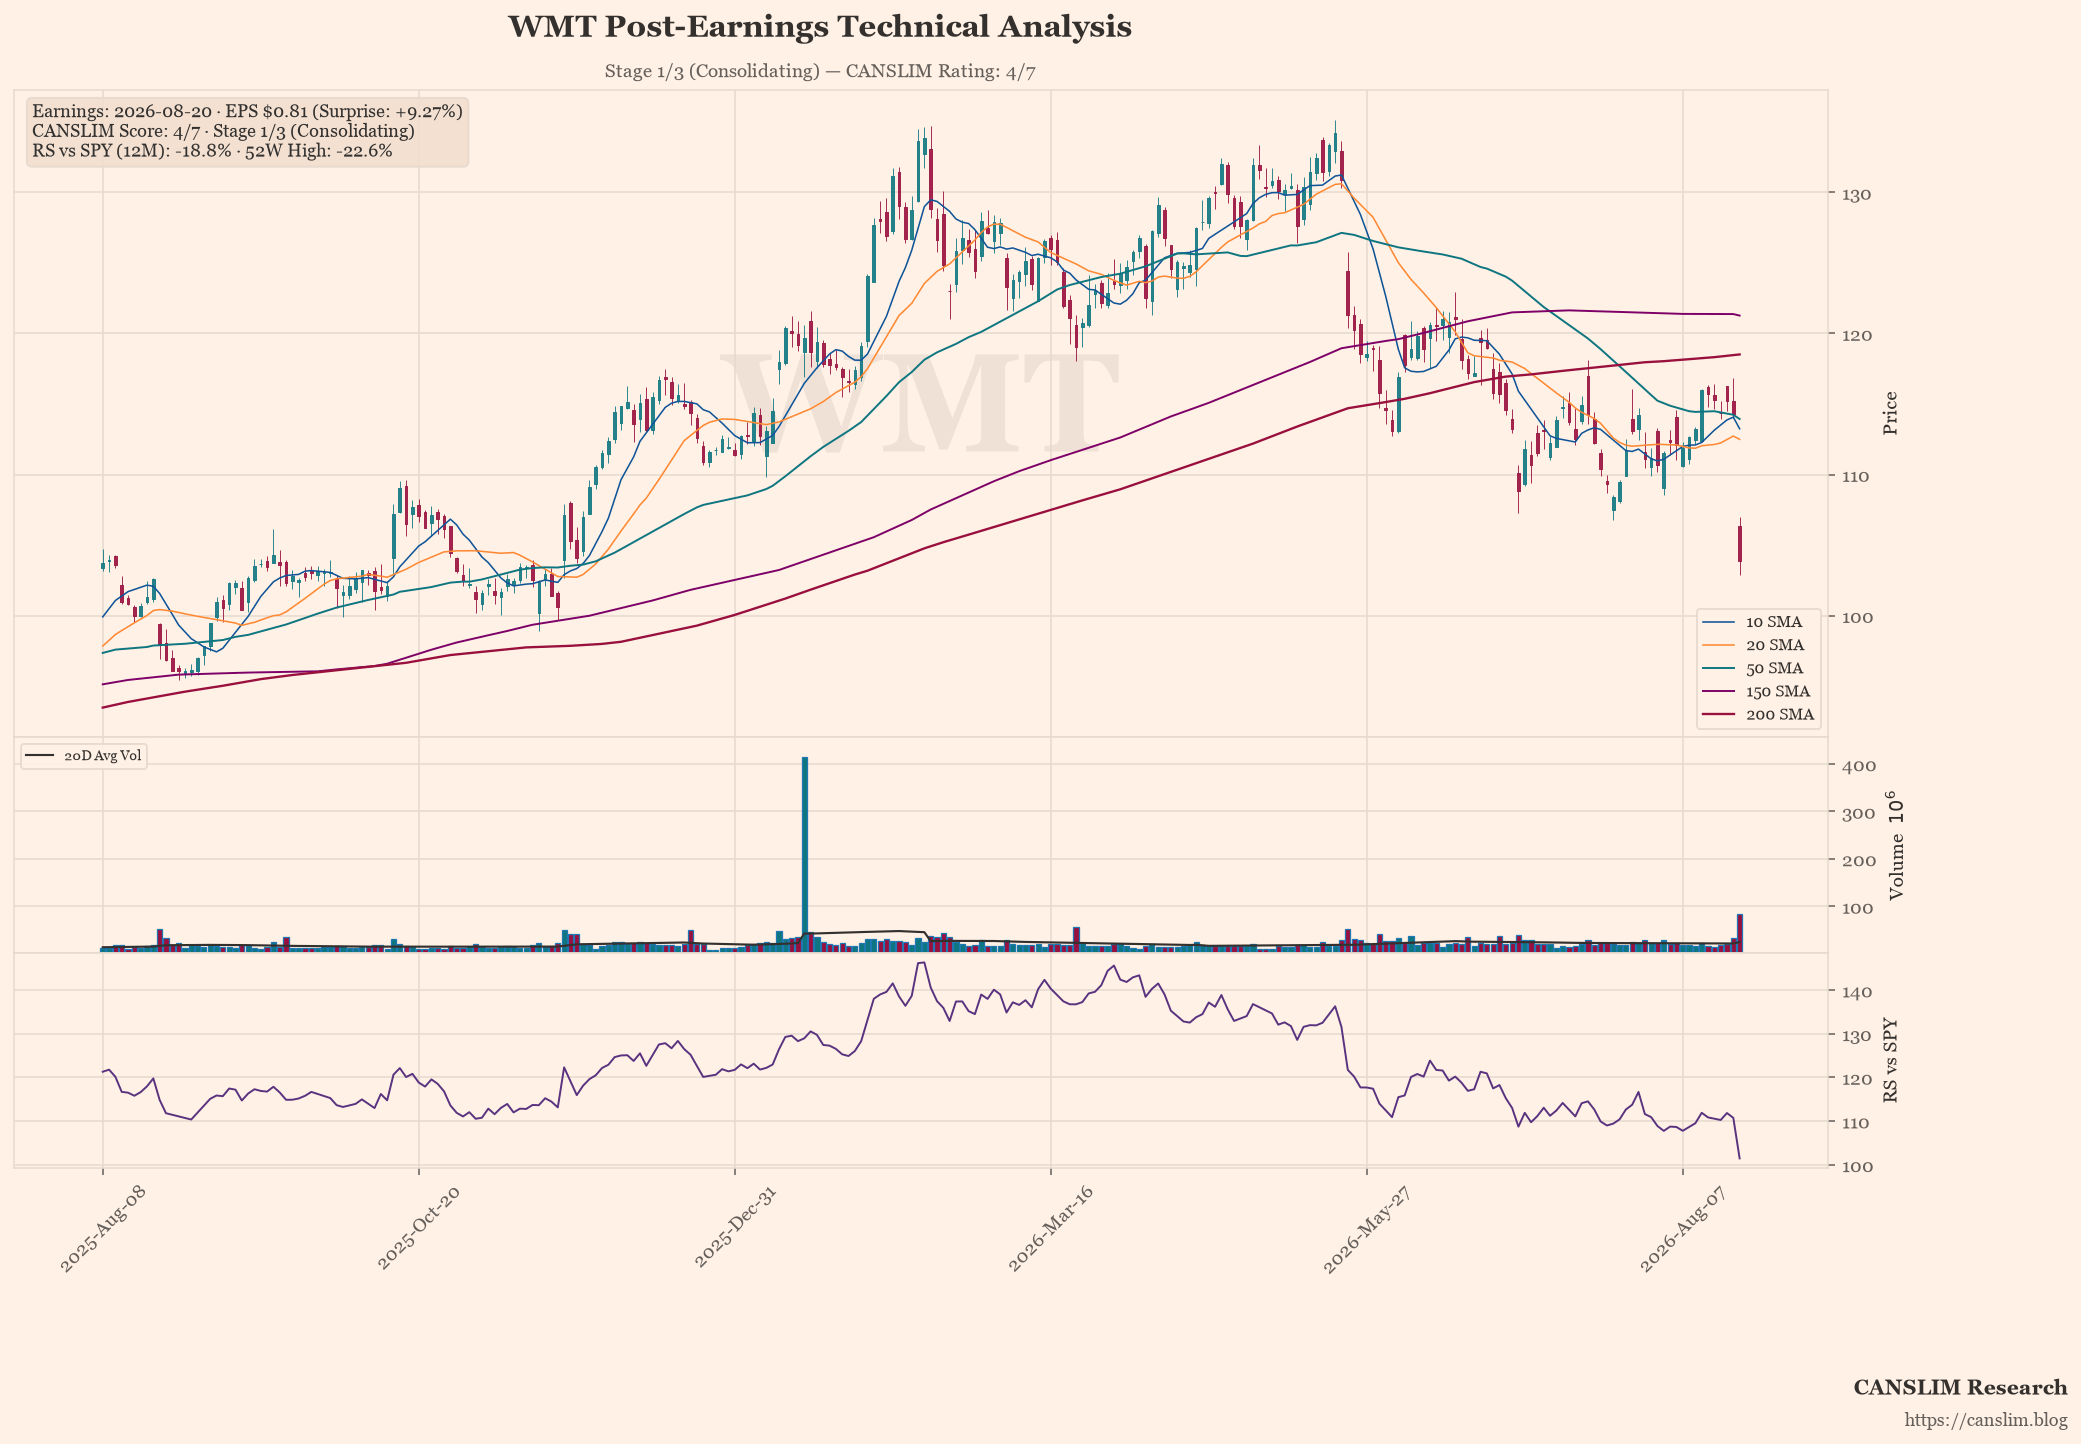
Walmart reported fiscal results that significantly outperformed Wall Street forecasts, with per-share profit reaching $0.81 against analyst consensus of $0.74—a positive deviation of over nine percent. Underlying revenue growth registered at approximately seven and a third year-on-year, indicating resilient consumer demand despite broader market headwinds. This performance demonstrates the retailer’s ability to maintain margin expansion while navigating inflationary pressures.
From a technical perspective, the current price action presents a challenging environment for bulls; trading at roughly $103.84 places shares approximately 22.6 per cent below their recent peak and significantly beneath both the fifty-day moving average of nearly $114 and the two-hundred-day line near $118.50. While fundamental data supports a long-term thesis, the immediate price structure indicates an ongoing correction typical of Stage One in a three-stage cycle, where institutional capital is currently favouring accumulation over aggressive deployment.
Institutional investors should view this period as one of strategic consolidation rather than terminal weakness, with forward catalysts including potential inventory optimisation and supply chain efficiency gains. However, traders must remain vigilant regarding operational risks such as labour cost volatility and geopolitical tensions that could impact the bottom line in subsequent quarters. The CANSLIM score of four out of seven suggests momentum is building but remains incomplete until price action reclaims key moving average support.
Earnings & Quantitative Scorecard
| Key Metric | Reported / Current | Benchmark / Consensus | Status |
|---|---|---|---|
| Quarterly EPS (C) | $0.81 (+19% YoY) | $0.74 (Surprise: +9.3%) | Pass |
| Quarterly Revenue | $177.75B (+7.3% YoY) | Top-line Growth | Pass |
| Annual EPS Growth (A) | +24%/yr | ≥25% Annual CAGR | Fail |
| 52-Week High Range (N) | -22.6% off high | Within 15% of High | Lagging |
| Relative Strength (L) | -18.8% vs SPY | Positive Alpha | Fail |
| Institutional Float (I) | 38% | 30% – 90% Float Ownership | Pass |
| Minervini Trend Template | 4 / 7 Criteria | Stage 2 Uptrend Alignment | Stage 1/3 (Consolidating) |
| Composite CANSLIM Rating | 4 / 7 Pillars | Institutional Quality Setup | 🟡 Developing / Watchlist |
Stage, pattern and sentiment labels are generated by rule-based approximations (Weinstein stage analysis, Minervini trend template and heuristic pattern detection), not by precise technical analysis. Data as of August 21, 2026. For informational and educational purposes only — not investment advice. Always verify against primary sources before making any investment decision.
Discover more from CANSLIM Research
Subscribe to get the latest posts sent to your email.