 Andrew@CANSLIM RESEARCH
As of August 08, 2026, 66 of 78 tracked ETFs and indexes closed higher on the day (average +1.2%), while 56 of 78 are up over the past month (average +1.7%). Across the universe, 42 instruments are in a Weinstein Stage 2 uptrend, 10 are in a Stage 4 decline, and 17 currently pass the full Minervini trend template. The tape is mixed: rotation between groups rather than a one-way move. Below are the charts the market is focused on right now, with the key patterns and levels annotated.
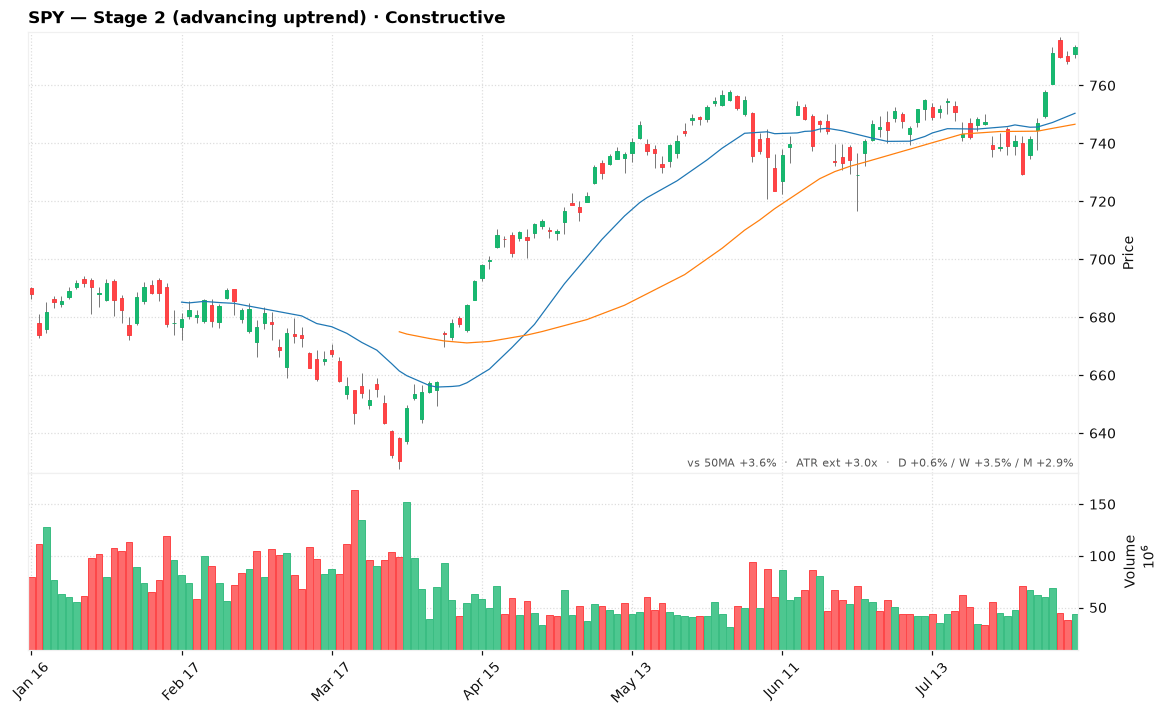
SPY · Broad Market Indexes — Constructive

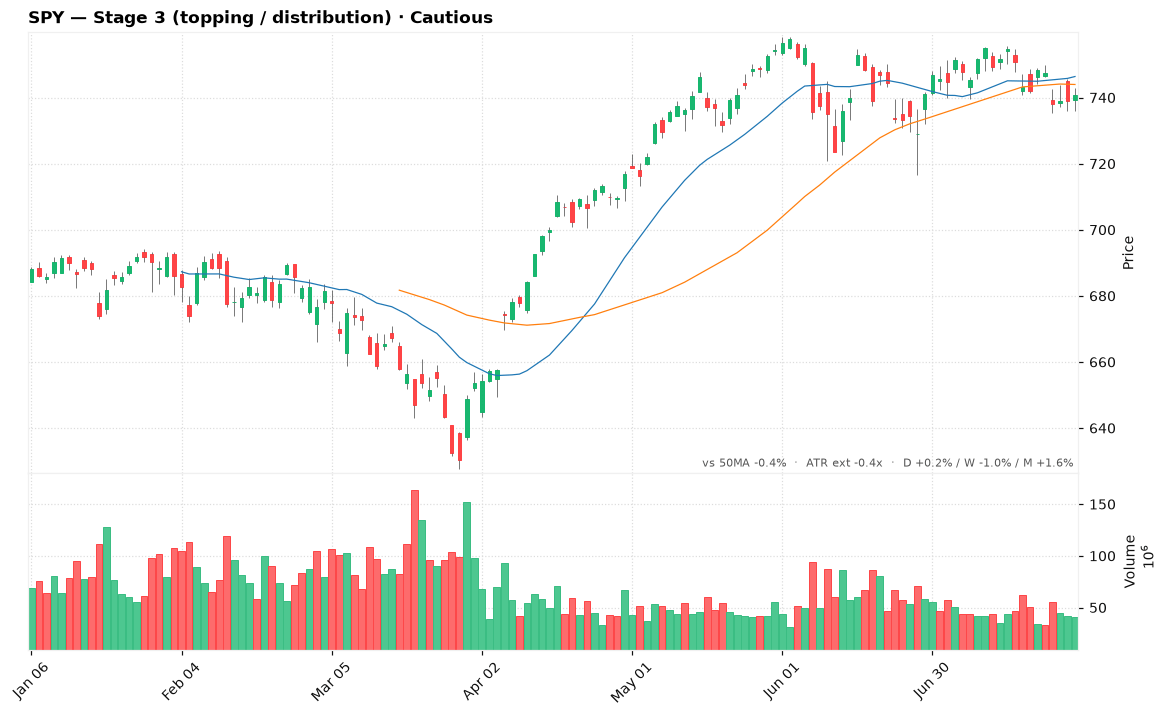
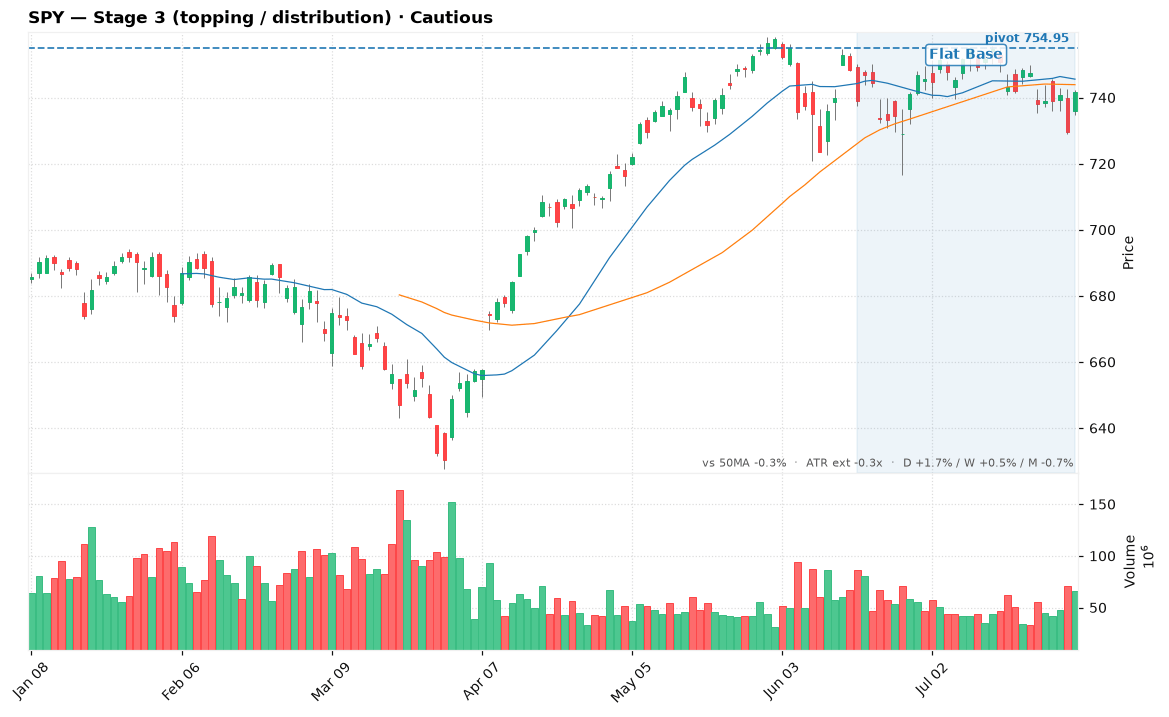
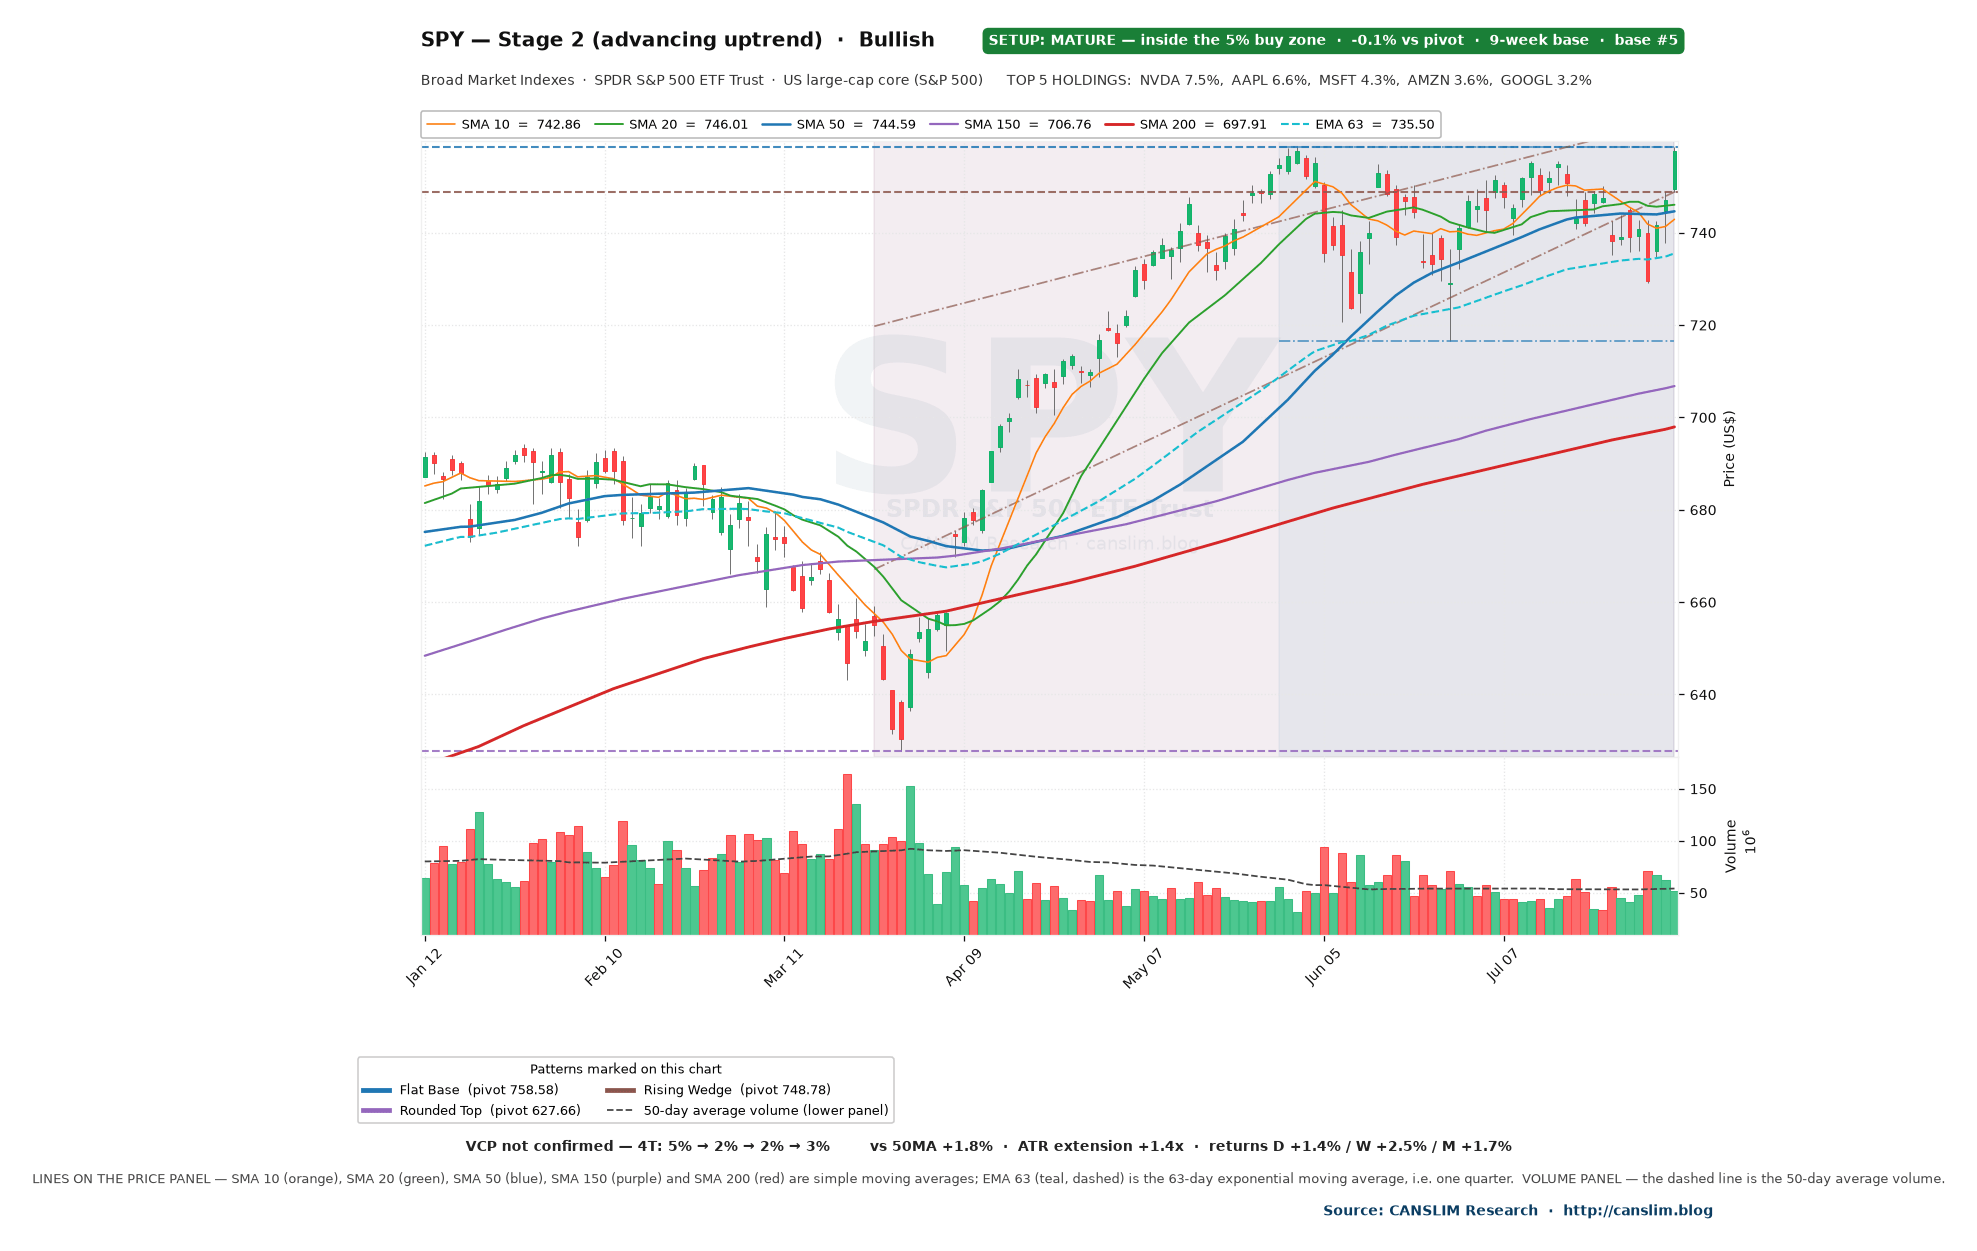
SPY is classified as Stage 2 (advancing uptrend) and is over-extended above the 50-day line. It trades +3.6% versus its 50-day moving average (+3.0x ATR extension), with returns of +0.6% on the day, +3.5% on the week and +2.9% on the month. Sentiment: Constructive. No classic base or flag pattern is currently detected.
QQQ · Broad Market Indexes — Constructive

QQQ is classified as Stage 2 (advancing uptrend) and is tightening just above the 50-day line (setup zone). It trades +1.2% versus its 50-day moving average (+0.6x ATR extension), with returns of +1.2% on the day, +5.1% on the week and -0.0% on the month. Sentiment: Constructive. Flat Base — ~6-week sideways range of 10% after a 24% advance; buy point at 736.40.
EPOL · International & Regional — Bullish

EPOL is classified as Stage 2 (advancing uptrend) and is over-extended above the 50-day line. It trades +9.4% versus its 50-day moving average (+6.1x ATR extension), with returns of +0.3% on the day, +3.2% on the week and +11.6% on the month. It passes the full Minervini trend template. Sentiment: Bullish. Double Bottom — W-shape with two lows within 3%; buy point at middle peak 40.69.
SCHD · Size & Style — Bullish

SCHD is classified as Stage 2 (advancing uptrend) and is over-extended above the 50-day line. It trades +4.2% versus its 50-day moving average (+3.2x ATR extension), with returns of +0.6% on the day, +1.3% on the week and +5.1% on the month. It passes the full Minervini trend template. Sentiment: Bullish. No classic base or flag pattern is currently detected.
ITA · US Sectors — Bullish

ITA is classified as Stage 2 (advancing uptrend) and is over-extended above the 50-day line. It trades +5.5% versus its 50-day moving average (+2.4x ATR extension), with returns of +0.3% on the day, +4.6% on the week and +4.6% on the month. It passes the full Minervini trend template. Sentiment: Bullish. Cup with Handle — cup depth 16%, handle drift 6%; buy point at 252.28 (handle high). Double Bottom — W-shape with two lows within 3%; buy point at middle peak 235.26.
TLT · Bonds & Defensives — Bearish

TLT is classified as Stage 4 (declining downtrend) and is over-sold below the 50-day line. It trades -1.9% versus its 50-day moving average (-2.7x ATR extension), with returns of +0.3% on the day, +1.0% on the week and -1.7% on the month. Sentiment: Bearish. No classic base or flag pattern is currently detected.
Sector money flow (1-month average)
- Commodities & Resources: +5.8% average one-month return
- International & Regional: +4.6% average one-month return
- Size & Style: +2.8% average one-month return
- Broad Market Indexes: +2.4% average one-month return
- US Sectors: +1.9% average one-month return
- Bonds & Defensives: -0.9% average one-month return
- Themes & Growth: -2.7% average one-month return
Stage, pattern and sentiment labels are generated by rule-based approximations (Weinstein stage analysis, Minervini trend template and heuristic pattern detection), not by precise technical analysis. For reference and education only — not investment advice.
Discover more from CANSLIM Research
Subscribe to get the latest posts sent to your email.