 Eben@CANSLIM Research
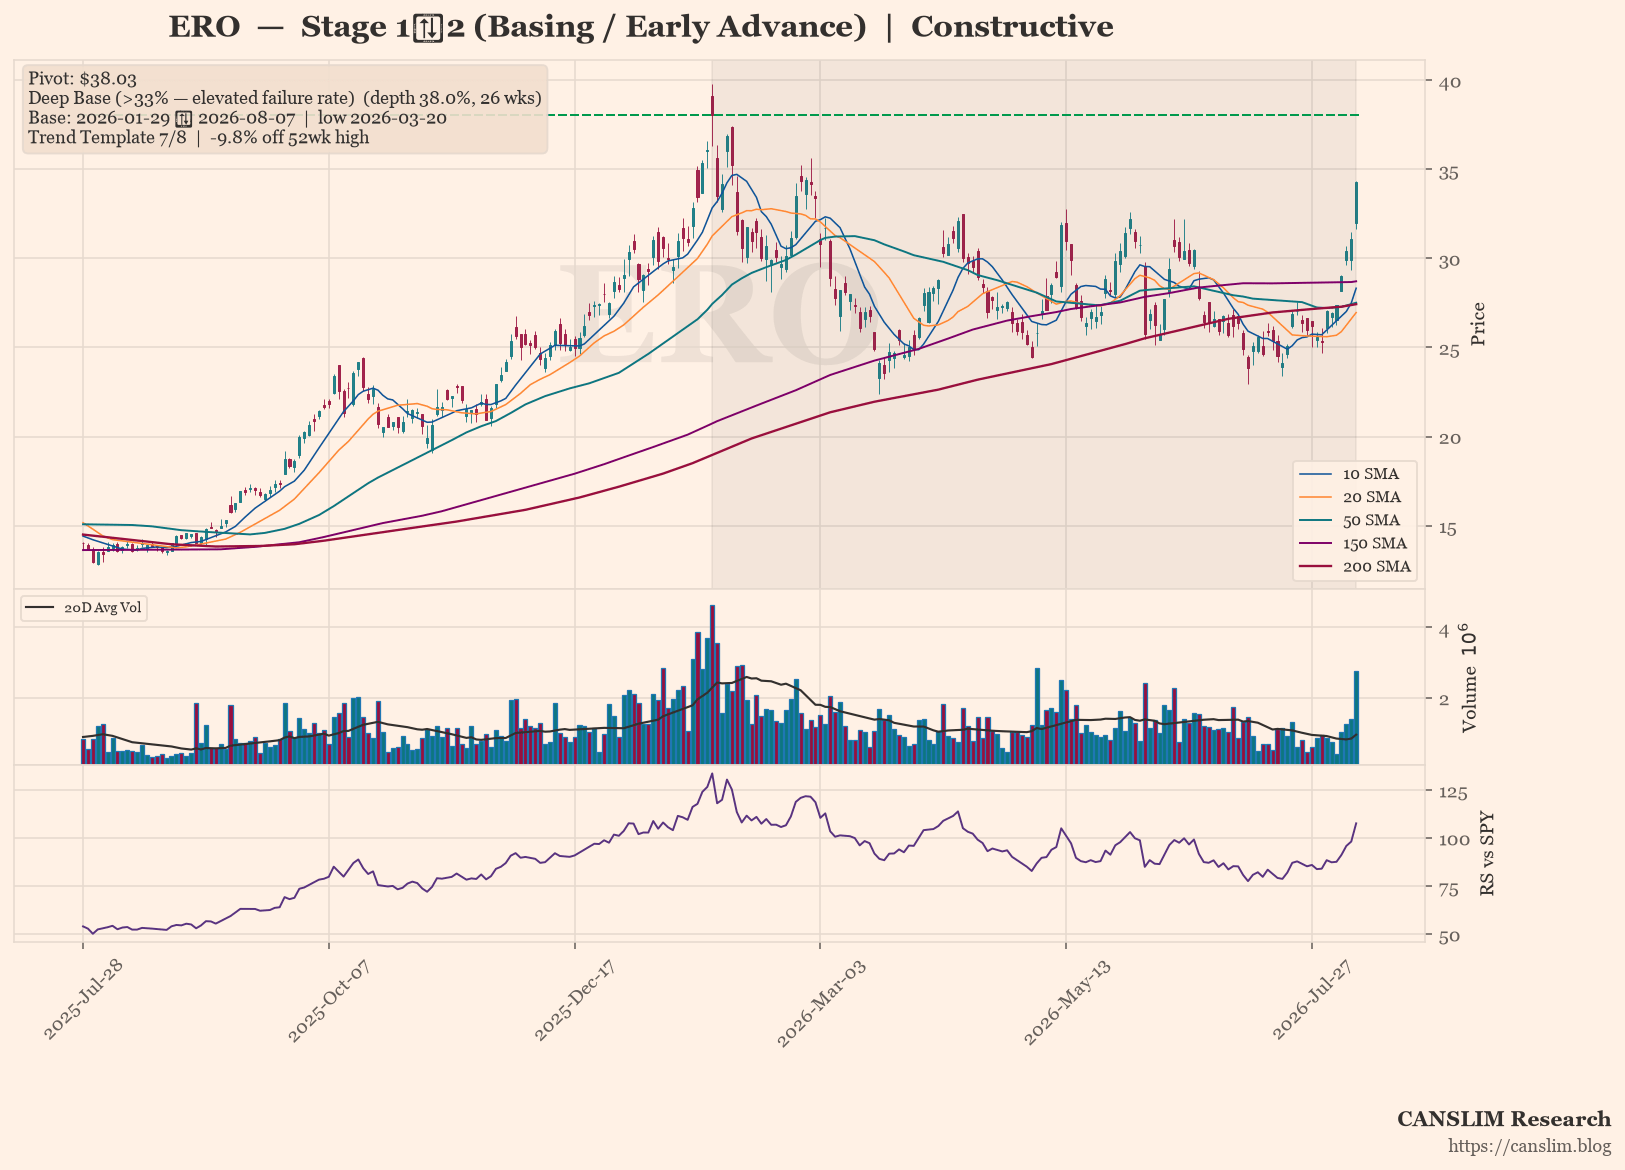
ERO is transitioning from a 26-week basing phase into an early advance, with the 30-week moving average flattening and price trading above it. The market is focused on the stock’s deep 38% base pattern, which carries an elevated failure rate, though the broader trend template remains constructive with 7 of 8 checks passing. Overall sentiment is favorable but cautious, as traders await a confirmed breakout above the 38.03 pivot to validate the next leg higher.
Technical Analysis
As of 2026-08-07 · Close $34.31
Stage Analysis
Stage 1→2 (Basing / Early Advance) — 30-week MA flattening with price above it — basing ahead of a potential advance
(30-week MA 6-week slope: -0.1%)
Detected Patterns — What the Market Is Watching
- Deep Base (>33% — elevated failure rate) — depth 38.0%, length 26 weeks, pivot $38.03. Base formed from 2026-01-29 (left-side high) to 2026-08-07, with the low of $23.59 set on 2026-03-20

Subscribe to continue reading
Become a paid subscriber to get access to the rest of this post and other exclusive content.