 Andrew@CANSLIM RESEARCH
As of August 04, 2026, 63 of 78 tracked ETFs and indexes closed higher on the day (average +1.4%), while 35 of 78 are up over the past month (average -0.8%). Across the universe, 31 instruments are in a Weinstein Stage 2 uptrend, 8 are in a Stage 4 decline, and 8 currently pass the full Minervini trend template. The tape is mixed: rotation between groups rather than a one-way move. Below are the charts the market is focused on right now, with the key patterns and levels annotated.
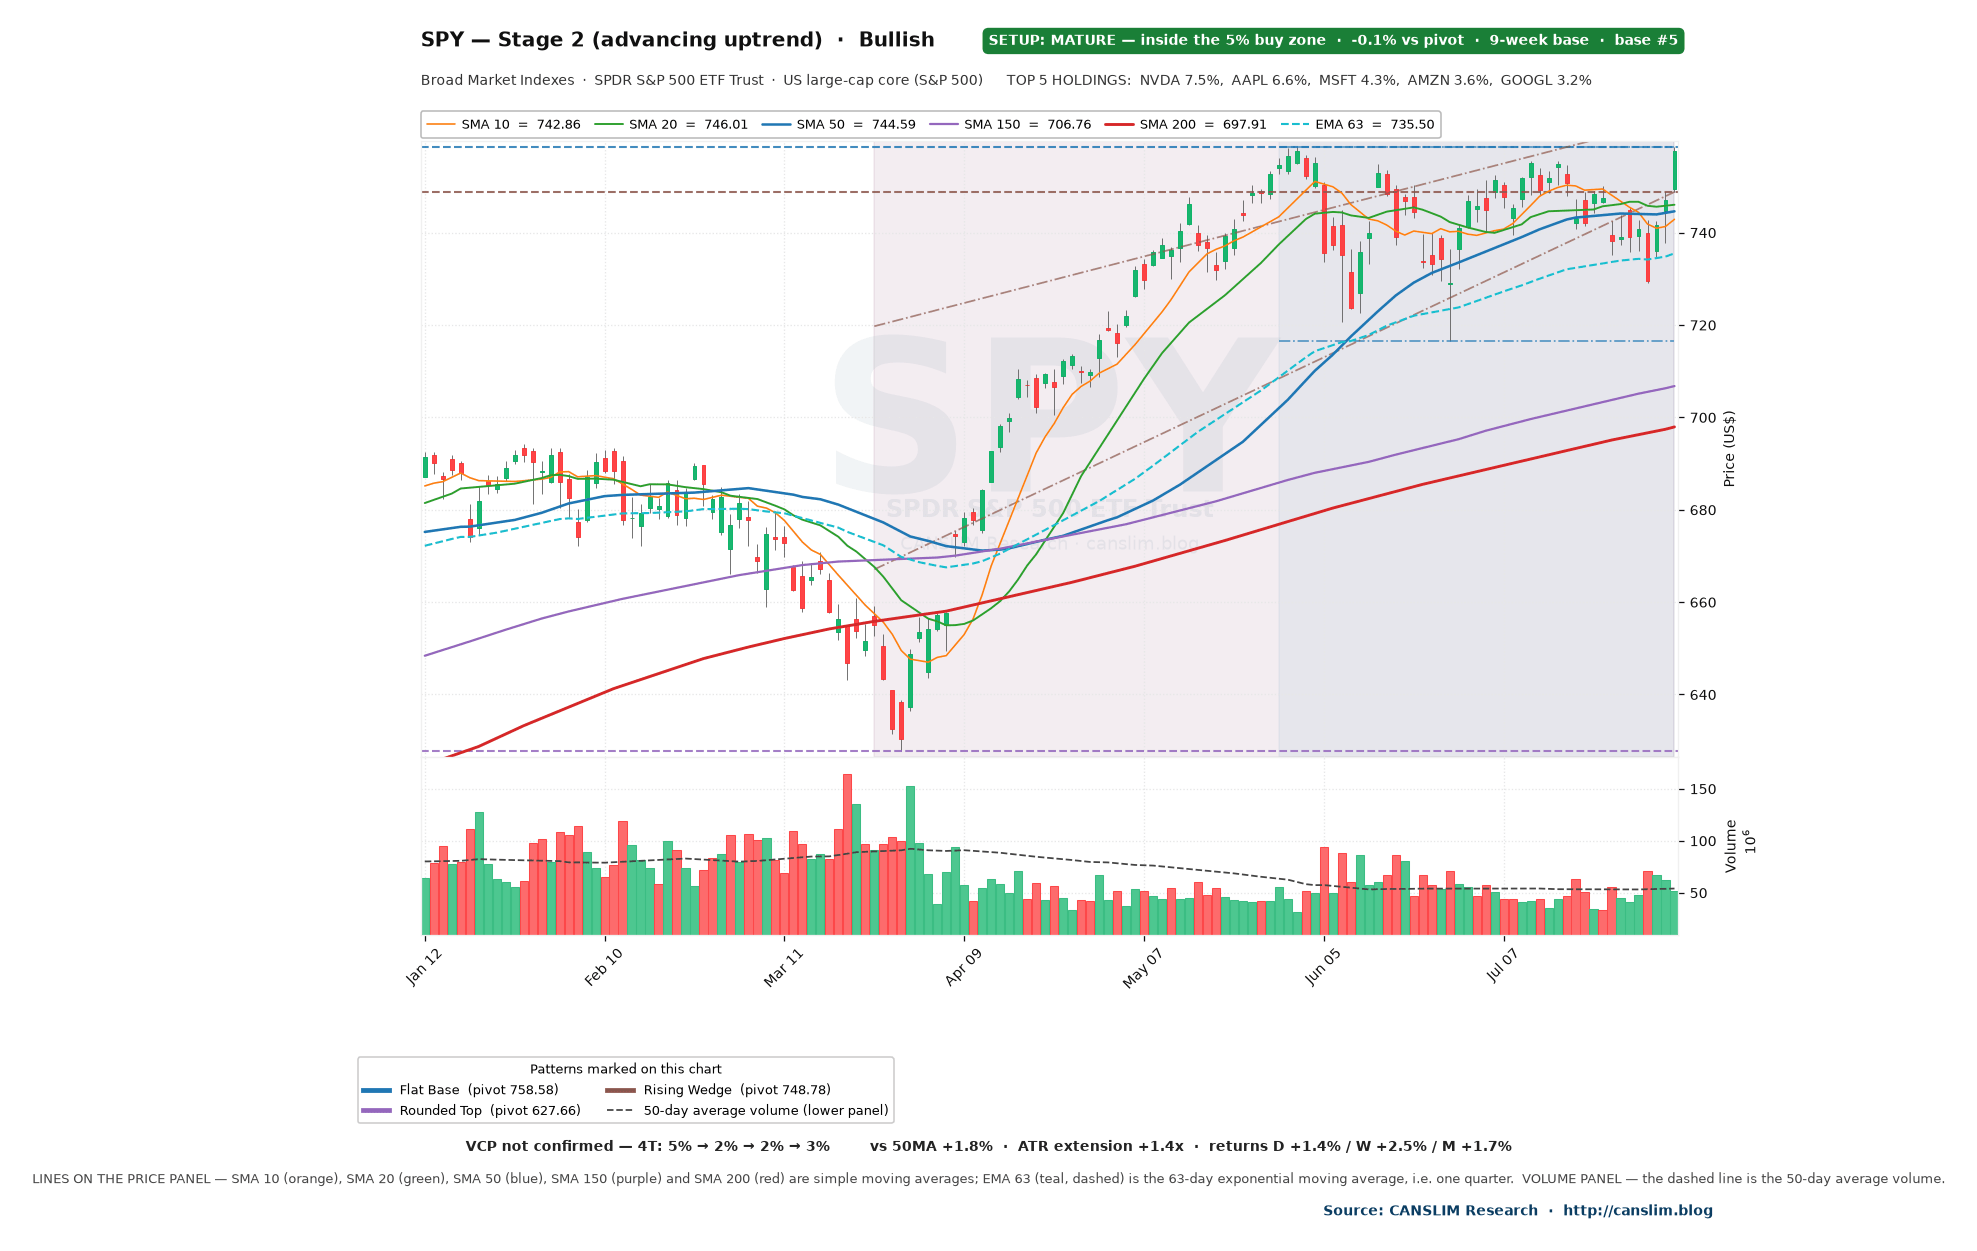
How to read the lines on every chart below
Each price panel carries exactly six overlays — five simple moving averages and one exponential moving average. They are named in the chart legend with their current values, and they are the same six on every chart in this report:
| Line | Type | Style | Why it is on the chart |
|---|---|---|---|
| SMA 10 | Simple | solid | short-term momentum / Minervini trailing stop reference |
| SMA 20 | Simple | solid | swing-trend line; breakouts should hold above it |
| SMA 50 | Simple | solid | institutional support — the classic O’Neil add/defend line |
| SMA 150 | Simple | solid | intermediate trend; part of the Minervini trend template |
| SMA 200 | Simple | solid | long-term trend; Weinstein Stage 2 requires price above a rising 200 |
| EMA 63 | Exponential | dashed | one-quarter exponential mean — where quarterly money is on average positioned |
The lower panel shows volume, with a dashed line marking the 50-day average volume. O’Neil’s rule of thumb is that a valid breakout should print volume at least 40% above that dashed line. All text sits outside the plotting area so that no candle, moving average or volume bar is obscured.
SPY · Broad Market Indexes — Bullish

Sector and top 5 holdings
SPY — SPDR S&P 500 ETF Trust, sits in the Broad Market Indexes bucket of this radar, and its mandate is US large-cap core (S&P 500).
| Symbol | Company | Weight |
|---|---|---|
| NVDA | NVIDIA Corp | 7.50% |
| AAPL | Apple Inc | 6.58% |
| MSFT | Microsoft Corp | 4.29% |
| AMZN | Amazon.com Inc | 3.61% |
| GOOGL | Alphabet Inc Class A | 3.24% |
The five largest positions account for roughly 25.2% of the fund, so the chart above is, to that extent, a chart of these names.
SPY is classified as Stage 2 (advancing uptrend) and is within a normal volatility band. It trades +1.8% versus its 50-day moving average (+1.4x ATR extension), with returns of +1.4% on the day, +2.5% on the week and +1.7% on the month. Sentiment: Bullish.
Setup maturity — Flat Base
Setup maturity — MATURE — inside the 5% buy zone: price has cleared the 758.58 pivot and sits -0.1% above it, still inside the classic 0–5% buy zone. 10-day volume is running -6% versus the 50-day average; the latest session traded 1.0x average volume — below the +40% o’neil wants on a breakout; this looks like base #5 of the advance — third- and fourth-stage bases fail far more often than first- and second-stage ones; the base is forming inside a weinstein stage 2 uptrend, which is the correct context for a continuation setup. The most recent session registered a volume-confirmed breakout, which is the trigger these bases are built for.
VCP study (Volatility Contraction)
VCP not confirmed — the 4 measurable contractions read 5% → 2% → 2% → 3% and 10-day volume is -6% vs its 50-day average. Missing: pullbacks are not getting progressively tighter; first contraction of 5% is outside the 6–40% window; volume has not dried up into the right side. Watch for the pattern to tighten further before it becomes actionable.
| Contraction | Window | Length | Depth | Volume trend |
|---|---|---|---|---|
| T1 | Jun 15 – Jul 06 | 13 sessions | 5% | contracting (-2%/session) |
| T2 | Jul 06 – Jul 15 | 7 sessions | 2% | contracting (-2%/session) |
| T3 | Jul 15 – Jul 22 | 5 sessions | 2% | contracting (-7%/session) |
| T4 | Jul 22 – Aug 03 | 8 sessions | 3% | expanding (+5%/session) |
Every pattern detected on this chart
Base / Setup (O’Neil–Minervini)
| Pattern | Bias | Key level | Reading |
|---|---|---|---|
| Flat Base | Bullish | 758.58 | a 9-week sideways range of only 6% following a 19% advance; the buy point is the 758.58 base high |
Reversal
| Pattern | Bias | Key level | Reading |
|---|---|---|---|
| Rounded Top | Bearish | 627.66 | price has traced a smooth dome over the past 18 weeks (curve fit R²=0.91) — a slow, grinding distribution top rather than a sharp reversal |
| Rising Wedge | Bearish | 748.78 | both boundaries slope up but the lows are rising faster than the highs — momentum is fading inside the advance; losing 748.78 resolves it lower |
Candlestick
| Pattern | Bias | Key level | Reading |
|---|---|---|---|
| Pin Bar (bullish) | Bullish | — | Jul 31 — a long lower tail with the close back near the high — intraday selling was fully rejected |
| Inside Bar | Two-sided | — | Jul 30 — the entire range sat inside the prior bar — a compression bar; the break of either extreme usually sets the short-term direction |
| Bullish Harami | Bullish | — | Jul 28 — a small body nested inside the previous large body — the prior trend bar failed to follow through |
Pattern balance: 3 bullish, 2 bearish and 1 two-sided formations — a mixed / two-sided read.
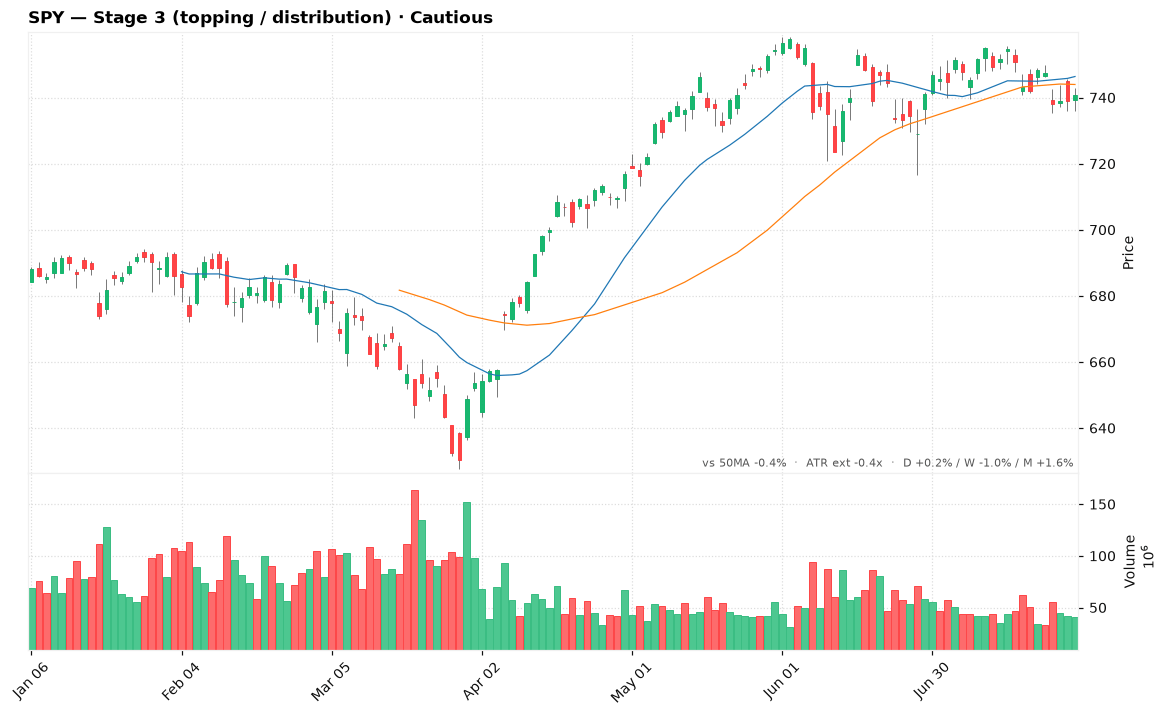
QQQ · Broad Market Indexes — Cautious

Sector and top 5 holdings
QQQ — Invesco QQQ Trust, sits in the Broad Market Indexes bucket of this radar, and its mandate is US large-cap growth (Nasdaq-100).
| Symbol | Company | Weight |
|---|---|---|
| NVDA | NVIDIA Corp | 7.58% |
| AAPL | Apple Inc | 6.66% |
| MU | Micron Technology Inc | 5.63% |
| MSFT | Microsoft Corp | 4.34% |
| AMD | Advanced Micro Devices Inc | 4.10% |
The five largest positions account for roughly 28.3% of the fund, so the chart above is, to that extent, a chart of these names.
QQQ is classified as Stage 3 (topping / distribution) and is within a normal volatility band. It trades -2.0% versus its 50-day moving average (-0.9x ATR extension), with returns of +1.8% on the day, +2.6% on the week and -1.8% on the month. Sentiment: Cautious.
Setup maturity — Flat Base
Setup maturity — BUILDING — approaching the pivot: price is 6% under the 747.83 pivot and is working up the right side; a handle or final contraction still needs to form. 10-day volume is running +1% versus the 50-day average; this looks like base #5 of the advance — third- and fourth-stage bases fail far more often than first- and second-stage ones; the broader structure is weinstein stage 3, so any base here is more likely to be distribution than accumulation.
VCP study (Vlatility Contraction)
VCP not confirmed — the 4 measurable contractions read 8% → 6% → 5% → 9% and 10-day volume is +1% vs its 50-day average. Missing: pullbacks are not getting progressively tighter; the final contraction (9%) is still too wide; volume has not dried up into the right side. Watch for the pattern to tighten further before it becomes actionable.
| Contraction | Window | Length | Depth | Volume trend |
|---|---|---|---|---|
| T1 | Jun 03 – Jun 22 | 12 sessions | 8% | contracting (-2%/session) |
| T2 | Jun 22 – Jun 30 | 6 sessions | 6% | contracting (-2%/session) |
| T3 | Jun 30 – Jul 10 | 7 sessions | 5% | contracting (-6%/session) |
| T4 | Jul 10 – Aug 03 | 16 sessions | 9% | expanding (+4%/session) |
Every pattern detected on this chart
Base / Setup (O’Neil–Minervini)
| Pattern | Bias | Key level | Reading |
|---|---|---|---|
| Flat Base | Bullish | 747.83 | a 9-week sideways range of only 12% following a 32% advance; the buy point is the 747.83 base high |
Reversal
| Pattern | Bias | Key level | Reading |
|---|---|---|---|
| Double Top | Bearish | 685.62 | two failed pushes into the 747.83 area with a 685.62 neckline between them; losing that neckline confirms the top |
| Triple Top | Bearish | 685.62 | three rejections from roughly 738.17 — heavy overhead supply; a break of the 685.62 neckline completes the reversal |
| Rounded Top | Bearish | 554.99 | price has traced a smooth dome over the past 18 weeks (curve fit R²=0.94) — a slow, grinding distribution top rather than a sharp reversal |
Continuation
| Pattern | Bias | Key level | Reading |
|---|---|---|---|
| Ascending Channel | Bullish | 770.88 | price is tracking inside a parallel rising channel; the upper rail is 770.88 and the lower rail 713.48 |
Harmonic
| Pattern | Bias | Key level | Reading |
|---|---|---|---|
| AB=CD (bullish) | Bullish | 686.76 | two equal legs — CD is 1.08x the length of AB and took 1.00x the time; completion at 686.76 |
| 3 Drives (bullish) | Bullish | 686.76 | three symmetrical drives to lower lows (702.81 → 700.91 → 686.76) — an exhaustion structure that typically resolves against the drive |
Candlestick
| Pattern | Bias | Key level | Reading |
|---|---|---|---|
| Hammer | Bullish | — | Jul 28 — a long lower tail with the close back near the high — intraday selling was fully rejected |
| Doji | Two-sided | — | Jul 28 — open and close were effectively the same — indecision, and after an extended run it often marks a pause or a turn |
Pattern balance: 5 bullish, 3 bearish and 1 two-sided formations — a net bullish read.
EPOL · International & Regional — Bullish

Sector and top 5 holdings
EPOL — iShares MSCI Poland ETF, sits in the International & Regional bucket of this radar, and its mandate is Focused Region.
| Symbol | Company | Weight |
|---|---|---|
| PKO.WA | PKO Bank Polski SA | 15.51% |
| PKN.WA | Orlen SA | 12.63% |
| PEO.WA | Bank Polska Kasa Opieki SA | 6.91% |
| PZU.WA | Powszechny Zaklad Ubezpieczen SA | 6.27% |
| ALE.WA | Allegro.EU SA Ordinary Shares | 6.01% |
The five largest positions account for roughly 47.3% of the fund, so the chart above is, to that extent, a chart of these names.
EPOL is classified as Stage 2 (advancing uptrend) and is over-extended above the 50-day line. It trades +7.1% versus its 50-day moving average (+4.6x ATR extension), with returns of +0.3% on the day, +4.6% on the week and +8.9% on the month. It passes the full Minervini trend template. Sentiment: Bullish.
Setup maturity — Ascending Triangle
Setup maturity — MATURE — inside the 5% buy zone: price has cleared the 41.45 pivot and sits +3.6% above it, still inside the classic 0–5% buy zone. 10-day volume is running +18% versus the 50-day average; the latest session traded 1.7x average volume — enough to confirm institutional demand; this looks like base #5 of the advance — third- and fourth-stage bases fail far more often than first- and second-stage ones; the base is forming inside a weinstein stage 2 uptrend, which is the correct context for a continuation setup. The most recent session registered a volume-confirmed breakout, which is the trigger these bases are built for.
VCP study (Volatility Contraction)
VCP not confirmed — the 4 measurable contractions read 4% → 8% → 3% → 2% and 10-day volume is +18% vs its 50-day average. Missing: pullbacks are not getting progressively tighter; first contraction of 4% is outside the 6–40% window; volume has not dried up into the right side. Watch for the pattern to tighten further before it becomes actionable.
| Contraction | Window | Length | Depth | Volume trend |
|---|---|---|---|---|
| T1 | Jun 04 – Jun 17 | 9 sessions | 4% | contracting (-3%/session) |
| T2 | Jun 17 – Jul 15 | 18 sessions | 8% | contracting (-3%/session) |
| T3 | Jul 15 – Jul 22 | 5 sessions | 3% | expanding (+6%/session) |
| T4 | Jul 22 – Aug 03 | 8 sessions | 2% | expanding (+9%/session) |
Every pattern detected on this chart
Continuation
| Pattern | Bias | Key level | Reading |
|---|---|---|---|
| Ascending Triangle | Bullish | 41.45 | a flat ceiling near 41.45 with 18 weeks of rising lows underneath — demand is stepping up into fixed supply; the breakout trigger is 41.45 |
Harmonic
| Pattern | Bias | Key level | Reading |
|---|---|---|---|
| 3 Drives (bearish) | Bearish | 41.53 | three symmetrical drives to higher highs (40.55 → 41.20 → 41.53) — an exhaustion structure that typically resolves against the drive |
Candlestick
| Pattern | Bias | Key level | Reading |
|---|---|---|---|
| Doji | Two-sided | — | Jul 29 — open and close were effectively the same — indecision, and after an extended run it often marks a pause or a turn |
Pattern balance: 1 bullish, 1 bearish and 1 two-sided formations — a mixed / two-sided read.
SCHD · Size & Style — Bullish

Sector and top 5 holdings
SCHD — Schwab U.S. Dividend Equity ETF, sits in the Size & Style bucket of this radar, and its mandate is Large Value.
| Symbol | Company | Weight |
|---|---|---|
| MRK | Merck & Co Inc | 4.52% |
| HD | The Home Depot Inc | 4.49% |
| UNH | UnitedHealth Group Inc | 4.46% |
| AMGN | Amgen Inc | 4.27% |
| ABT | Abbott Laboratories | 4.27% |
The five largest positions account for roughly 22.0% of the fund, so the chart above is, to that extent, a chart of these names.
SCHD is classified as Stage 2 (advancing uptrend) and is over-extended above the 50-day line. It trades +3.5% versus its 50-day moving average (+2.7x ATR extension), with returns of +0.3% on the day, +0.4% on the week and +3.6% on the month. It passes the full Minervini trend template. Sentiment: Bullish.
Setup maturity
There is no base or continuation setup with a definable pivot on this chart, so no maturity call can be made. Nothing here is actionable under O’Neil or Minervini entry rules.
VCP study (Volatility Contraction)
VCP not confirmed — the 4 measurable contractions read 4% → 2% → 3% → 4% and 10-day volume is +12% vs its 50-day average. Missing: pullbacks are not getting progressively tighter; first contraction of 4% is outside the 6–40% window; the final contraction (4%) is still too wide; volume has not dried up into the right side. Watch for the pattern to tighten further before it becomes actionable.
| Contraction | Window | Length | Depth | Volume trend |
|---|---|---|---|---|
| T1 | Jun 12 – Jun 26 | 9 sessions | 4% | contracting (-2%/session) |
| T2 | Jun 26 – Jul 17 | 14 sessions | 2% | contracting (-1%/session) |
| T3 | Jul 17 – Jul 28 | 7 sessions | 3% | expanding (+4%/session) |
| T4 | Jul 28 – Aug 03 | 4 sessions | 4% | contracting (-4%/session) |
Every pattern detected on this chart
Harmonic
| Pattern | Bias | Key level | Reading |
|---|---|---|---|
| 3 Drives (bearish) | Bearish | 34.24 | three symmetrical drives to higher highs (32.53 → 32.66 → 34.24) — an exhaustion structure that typically resolves against the drive |
Candlestick
| Pattern | Bias | Key level | Reading |
|---|---|---|---|
| Pin Bar (bullish) | Bullish | — | Jul 30 — a long lower tail with the close back near the high — intraday selling was fully rejected |
| Shooting Star | Bearish | — | Jul 28 — a long upper tail after an advance — buyers pushed higher and were sold into before the close |
| Doji | Two-sided | — | Aug 03 — open and close were effectively the same — indecision, and after an extended run it often marks a pause or a turn |
| Inside Bar | Two-sided | — | Jul 29 — the entire range sat inside the prior bar — a compression bar; the break of either extreme usually sets the short-term direction |
Pattern balance: 1 bullish, 2 bearish and 2 two-sided formations — a net bearish read.
CIBR · Themes & Growth — Bullish

Sector and Top 5 holdings
CIBR — First Trust NASDAQ Cybersecurity ETF, sits in the Themes & Growth bucket of this radar, and its mandate is Theme — cybersecurity.
| Symbol | Company | Weight |
|---|---|---|
| PANW | Palo Alto Networks Inc | 9.61% |
| FTNT | Fortinet Inc | 8.84% |
| CRWD | CrowdStrike Holdings Inc Class A | 8.29% |
| CSCO | Cisco Systems Inc | 7.75% |
| AVGO | Broadcom Inc | 6.72% |
The five largest positions account for roughly 41.2% of the fund, so the chart above is, to that extent, a chart of these names.
CIBR is classified as Stage 2 (advancing uptrend) and is over-extended above the 50-day line. It trades +6.1% versus its 50-day moving average (+2.2x ATR extension), with returns of +2.3% on the day, +5.4% on the week and +3.6% on the month. It passes the full Minervini trend template. Sentiment: Bullish.
Setup maturity — Flat Base
Setup maturity — ACTIONABLE SOON — at the pivot: price is within 2.1% of the 95.96 pivot — the setup is complete and the breakout is the trigger, not the entry. 10-day volume is running -14% versus the 50-day average (constructive dry-up); the latest session traded 0.9x average volume — below the +40% o’neil wants on a breakout; this looks like base #3 of the advance — third- and fourth-stage bases fail far more often than first- and second-stage ones; the base is forming inside a weinstein stage 2 uptrend, which is the correct context for a continuation setup.
VCP study (Minervini volatility contraction)
VCP not confirmed — the 4 measurable contractions read 5% → 14% → 5% → 10% and 10-day volume is -14% vs its 50-day average. Missing: pullbacks are not getting progressively tighter; first contraction of 5% is outside the 6–40% window; the final contraction (10%) is still too wide. Watch for the pattern to tighten further before it becomes actionable.
| Contraction | Window | Length | Depth | Volume trend |
|---|---|---|---|---|
| T1 | Apr 22 – Jun 02 | 28 sessions | 5% | expanding (+2%/session) |
| T2 | Jun 02 – Jun 15 | 9 sessions | 14% | contracting (-6%/session) |
| T3 | Jun 15 – Jul 15 | 20 sessions | 5% | expanding (+1%/session) |
| T4 | Jul 15 – Aug 03 | 13 sessions | 10% | contracting (-2%/session) |
Every pattern detected on this chart
Base / Setup (O’Neil–Minervini)
| Pattern | Bias | Key level | Reading |
|---|---|---|---|
| Flat Base | Bullish | 95.96 | a 5-week sideways range of only 10% following a 28% advance; the buy point is the 95.96 base high |
Continuation
| Pattern | Bias | Key level | Reading |
|---|---|---|---|
| Stair-Step Continuation | Bullish | 95.96 | three successively higher lows and higher highs — a base-on-base staircase; the next step trigger is 95.96 |
Candlestick
| Pattern | Bias | Key level | Reading |
|---|---|---|---|
| Pin Bar (bullish) | Bullish | — | Jul 28 — a long lower tail with the close back near the high — intraday selling was fully rejected |
| Inside Bar | Two-sided | — | Jul 30 — the entire range sat inside the prior bar — a compression bar; the break of either extreme usually sets the short-term direction |
Pattern balance: 3 bullish, 0 bearish and 1 two-sided formations — a net bullish read.
ARKK · Themes & Growth — Bearish

Sector and top 5 holdings
ARKK — ARK Innovation ETF, sits in the Themes & Growth bucket of this radar, and its mandate is Theme — disruptive innovation, actively managed.
| Symbol | Company | Weight |
|---|---|---|
| TSLA | Tesla Inc | 10.19% |
| TEM | Tempus AI Inc Class A common stock | 5.58% |
| AMD | Advanced Micro Devices Inc | 4.98% |
| CRSP | CRISPR Therapeutics AG | 4.87% |
| HOOD | Robinhood Markets Inc Class A | 4.49% |
The five largest positions account for roughly 30.1% of the fund, so the chart above is, to that extent, a chart of these names.
ARKK is classified as Stage 4 (declining downtrend) and is within a normal volatility band. It trades -5.0% versus its 50-day moving average (-1.5x ATR extension), with returns of +3.2% on the day, +1.4% on the week and -9.5% on the month. Sentiment: Bearish.
Setup maturity
There is no base or continuation setup with a definable pivot on this chart, so no maturity call can be made. Nothing here is actionable under O’Neil or Minervini entry rules.
VCP study (Minervini volatility contraction)
VCP not confirmed — the 4 measurable contractions read 10% → 13% → 7% → 17% and 10-day volume is -21% vs its 50-day average. Missing: pullbacks are not getting progressively tighter; the final contraction (17%) is still too wide; price is still far below the pivot. Watch for the pattern to tighten further before it becomes actionable.
| Contraction | Window | Length | Depth | Volume trend |
|---|---|---|---|---|
| T1 | May 11 – May 29 | 13 sessions | 10% | contracting (-2%/session) |
| T2 | May 29 – Jun 17 | 13 sessions | 13% | expanding (+3%/session) |
| T3 | Jun 17 – Jul 06 | 11 sessions | 7% | contracting (-4%/session) |
| T4 | Jul 06 – Aug 03 | 20 sessions | 17% | expanding (+0%/session) |
Every pattern detected on this chart
Reversal
| Pattern | Bias | Key level | Reading |
|---|---|---|---|
| Double Top | Bearish | 72.10 | two failed pushes into the 84.34 area with a 72.10 neckline between them; losing that neckline confirms the top |
Continuation
| Pattern | Bias | Key level | Reading |
|---|---|---|---|
| Ascending Channel | Bullish | 86.90 | price is tracking inside a parallel rising channel; the upper rail is 86.90 and the lower rail 77.65 |
Harmonic
| Pattern | Bias | Key level | Reading |
|---|---|---|---|
| AB=CD (bearish) | Bearish | 84.34 | two equal legs — CD is 0.96x the length of AB and took 0.83x the time; completion at 84.34 |
Candlestick
| Pattern | Bias | Key level | Reading |
|---|---|---|---|
| Bullish Engulfing | Bullish | — | Aug 03 — today’s real body completely swallowed yesterday’s down bar — buyers took control of the whole prior session’s range |
| Bearish Engulfing | Bearish | — | Jul 31 — today’s real body completely swallowed yesterday’s up bar — sellers reclaimed the entire prior session |
| Bullish Harami | Bullish | — | Jul 27 — a small body nested inside the previous large body — the prior trend bar failed to follow through |
| Tweezer Bottom | Bullish | — | Jul 27 — two consecutive sessions held an identical low — a precise demand shelf |
Pattern balance: 4 bullish, 3 bearish and 0 two-sided formations — a mixed / two-sided read.
Sector money flow (1-month average)
- International & Regional: +2.9% average one-month return
- Broad Market Indexes: +1.4% average one-month return
- US Sectors: +0.9% average one-month return
- Size & Style: +0.8% average one-month return
- Bonds & Defensives: -2.6% average one-month return
- Themes & Growth: -3.5% average one-month return
- Commodities & Resources: -4.3% average one-month return
Stage, pattern, maturity and sentiment labels are generated by rule-based approximations (Weinstein stage analysis, the Minervini trend template and VCP logic, O’Neil base and volume rules, plus heuristic geometric and candlestick pattern matching), not by precise technical analysis. Pattern recognition of this kind produces both false positives and misses. Fund holdings are as reported by the data provider and change over time. For reference and education only — not investment advice.
Source: CANSLIM Research — http://canslim.blog
Discover more from CANSLIM Research
Subscribe to get the latest posts sent to your email.