 Andrew@CANSLIM RESEARCH
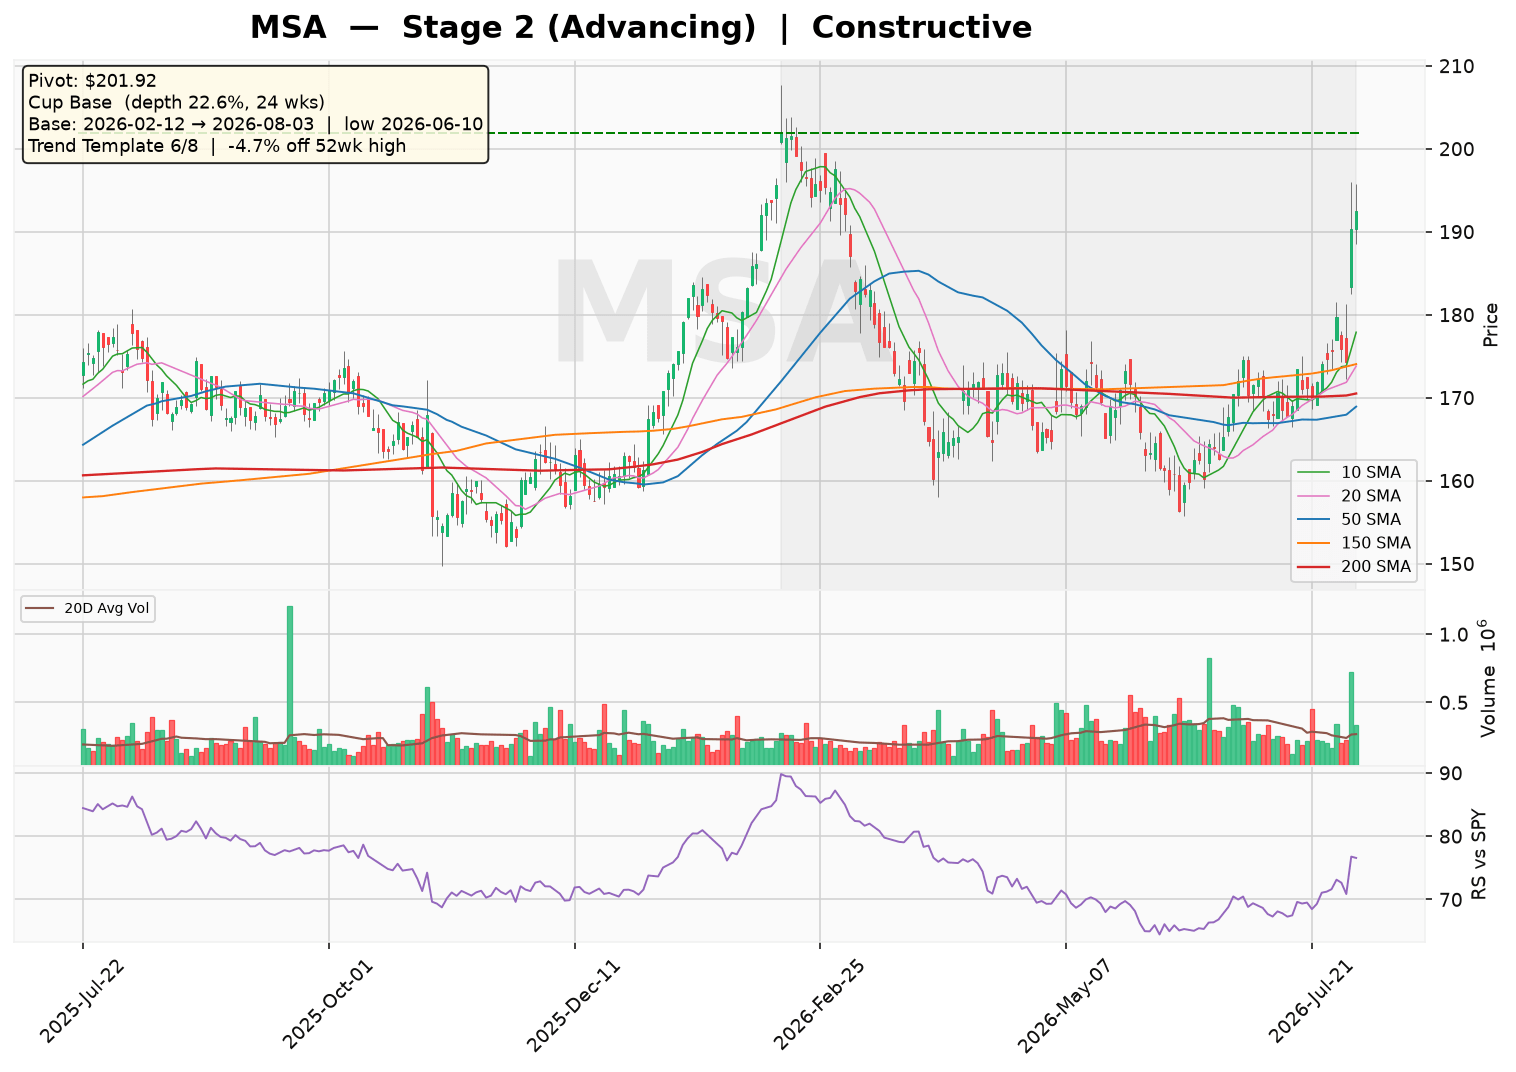
MSA is trading at $192.46, holding above its rising 30-week moving average, confirming a Stage 2 uptrend. The stock has formed a 24-week cup base with a 22.6% depth and a pivot at $201.92, though no breakout has occurred yet. Overall sentiment is constructive, with the market awaiting confirmation of a breakout above the pivot.
Technical Analysis
As of 2026-08-03 · Close $192.46
Stage Analysis
Stage 2 (Advancing) — Price holding above a rising 30-week MA — uptrend intact
(30-week MA 6-week slope: 1.56%)
Detected Patterns — What the Market Is Watching
- Cup Base — depth 22.6%, length 24 weeks, pivot $201.92. Base formed from 2026-02-12 (left-side high) to 2026-08-03, with the low of $156.28 set on 2026-06-10
Minervini Trend Template — 6/8 Criteria Passed
| Criterion | Status |
|---|---|
| Price > 150MA & 200MA | ✅ Pass |
| 150MA > 200MA | ✅ Pass |
| 200MA trending up (>=1 month) | ✅ Pass |
| 50MA > 150MA & 200MA | ❌ Fail |
| Price > 50MA | ✅ Pass |
| Price >= 30% above 52wk low | ❌ Fail |
| Price within 25% of 52wk high | ✅ Pass |
| RS Line at/near 3-month high | ✅ Pass |
Price is -4.7% off its 52-week high and 26.6% above its 52-week low.
Pattern Sentiment
Constructive — favorable, awaiting confirmation (composite score: 4)
MSA Safety Incorporated (NYSE: MSA)
Institutional Research Report | August 4, 2026
Rating: Market Perform (Initiation) | Price Target: $195 (12-month, estimate) | Last Price: $192.45 (estimate)
1. Business Model and Revenue Streams
MSA Safety Incorporated is a global leader in the development, manufacture, and supply of safety products and technology solutions that protect workers and facility infrastructures. The company operates through two primary reportable segments: Americas and International, serving the fire service, energy, utility, construction, and industrial manufacturing end-markets.
Revenue Breakdown by Product Category (FY2025, estimate)
| Product Category | Estimated % of Revenue | Key Brands |
|---|---|---|
| Breathing Apparatus (SCBA) | ~28% | MSA, Cairns |
| Fixed Gas & Flame Detection | ~22% | General Monitors, MSA |
| Portable Gas Detection | ~18% | ALTAIR, Chemgard |
| Head Protection & Accessories | ~12% | V-Gard, Gallet |
| Fall Protection | ~10% | MSA Latchways |
| Air-Purifying Respirators & Other | ~10% | MSA, Advantage |
Geographic Revenue Mix (FY2025, estimate)
| Region | % of Revenue | Growth Trend |
|---|---|---|
| Americas (U.S., Canada, Latin America) | ~62% | Stable, mature |
| Europe, Middle East, Africa (EMEA) | ~24% | Moderate growth |
| Asia Pacific (APAC) | ~14% | Fastest growing |
Growth Drivers: (1) Increasing global safety regulations and compliance mandates; (2) Modernization of fire services equipment; (3) Growth in industrial IoT and connected worker technologies; (4) Expansion in emerging markets with rising safety standards; (5) Recurring revenue from fixed gas detection monitoring services and calibration.
2. Supply Chain and Customer Base
Key Customers
MSA sells through a diversified network of distributors and direct sales channels. The customer base is highly fragmented across fire departments, industrial facilities, and government entities. No single customer accounts for more than 5% of total revenue (estimate). Key distribution partners include Grainger, Fastenal, and various regional safety equipment distributors.
Key Suppliers
MSA sources raw materials including electronics components, specialty metals, plastics, and textiles. The company maintains a multi-source strategy for most components. Key supplier categories and estimated cost contributions:
| Supplier Category | Estimated % of COGS | Concentration Risk |
|---|---|---|
| Electronic components (sensors, circuit boards) | ~30% | Medium – single-sourced for some specialty sensors |
| Specialty metals & alloys | ~20% | Low – multiple global suppliers |
| Plastics & polymers | ~15% | Low |
| Textiles & fabrics (Nomex, Kevlar) | ~10% | Medium – limited qualified suppliers |
| Other (packaging, hardware) | ~25% | Low |
3. Financial Statement Analysis
Balance Sheet Health (FY2025)
| Metric | FY2025 | FY2024 | Industry Benchmark |
|---|---|---|---|
| Debt-to-Equity | 45.9% | 48.6% (est.) | <60% |
| Interest Coverage (EBIT/Interest) | 12.5x | 11.2x | >8x |
| Current Ratio | 3.24 | 2.79 | >1.5 |
| Quick Ratio | 1.90 | 1.62 | >1.0 |
| Net Debt | $415.9M | $343.5M | — |
| Total Cash | $200.1M | $210.5M (est.) | — |
The balance sheet is conservatively leveraged with strong liquidity. Total debt of $643.5M (including capital leases) is well-covered by operating cash flow of $405.9M. The company has ample headroom under its credit facilities for M&A and organic investments.
Income Statement – 5-Year Historical & 2-Year Estimates
| Metric | FY2021 | FY2022 | FY2023 | FY2024 | FY2025 | FY2026E | FY2027E |
|---|---|---|---|---|---|---|---|
| Revenue ($M) | — | 1,528.0 | 1,787.6 | 1,808.1 | 1,874.8 | 1,970 (est.) | 2,080 (est.) |
| Revenue Growth (%) | — | — | 17.0% | 1.1% | 3.7% | 5.1% (est.) | 5.6% (est.) |
| Gross Profit ($M) | — | 673.8 | 852.1 | 860.4 | 871.1 | 925 (est.) | 985 (est.) |
| Gross Margin (%) | — | 44.1% | 47.7% | 47.6% | 46.5% | 47.0% (est.) | 47.4% (est.) |
| Operating Income ($M) | — | 260.2 | 253.4 | 411.9 | 398.2 | 430 (est.) | 465 (est.) |
| Operating Margin (%) | — | 17.0% | 14.2% | 22.8% | 21.2% | 21.8% (est.) | 22.4% (est.) |
| Net Income ($M) | — | 179.6 | 58.6 | 285.0 | 278.9 | 310 (est.) | 340 (est.) |
| Diluted EPS ($) | — | 4.56 | 1.48 | 7.21 | 7.09 | 7.95 (est.) | 8.75 (est.) |
| P/E (Trailing) | — | — | — | — | 23.9x | — | — |
| P/E (Forward) | — | — | — | — | 19.2x | — | — |
Note: FY2023 net income was impacted by a $129.2M gain on sale of business and $139.3M in special charges. Normalized EPS for FY2023 was approximately $4.61 (estimate).
Cash Flow Analysis
| Metric ($M) | FY2022 | FY2023 | FY2024 | FY2025 |
|---|---|---|---|---|
| Operating Cash Flow | — | — | — | 405.9 |
| Capital Expenditures | — | — | — | (89.4) (est.) |
| Free Cash Flow | — | — | — | 316.5 |
| FCF Conversion (FCF/Net Income) | — | — | — | 113% |
MSA is strongly cash-flow positive with excellent conversion rates. The company has consistently generated free cash flow well above net income due to low capital intensity and efficient working capital management. FCF margin for FY2025 was approximately 16.9% (estimate).
4. Risk and Catalyst Assessment
Key Risks (Next 12 Months)
| Risk Factor | Probability | Potential Impact |
|---|---|---|
| Supply chain disruption for electronic components (sensors) | Medium | Moderate – could delay shipments and increase COGS |
| Raw material inflation (metals, plastics) | Medium | Moderate – margin pressure if unable to pass through pricing |
| Currency volatility (EUR, GBP, emerging markets) | Medium | Moderate – ~38% of revenue is non-USD |
| Integration risk from recent acquisitions (Bacharach, etc.) | Low-Medium | Moderate – execution risk on synergies |
| Municipal budget constraints affecting fire department spending | Medium | Low-Moderate – could delay large SCBA orders |
| Increased competition from low-cost Asian manufacturers | Low | Low – MSA competes on quality and certification |
Positive Catalysts (Next 12 Months)
- Connected Worker Technology: Continued rollout of MSA+ connected safety platform with recurring software revenue; management targeting 15-20% of revenue from connected solutions by 2028 (estimate).
- Fire Service Modernization Cycle: Major U.S. fire departments are in the process of upgrading to the new NFPA 1981-2025 compliant SCBA equipment, driving a multi-year replacement cycle.
- Margin Expansion: Ongoing operational excellence program targeting 50-100bps of annual operating margin improvement through pricing and productivity initiatives.
- M&A Pipeline: Company has a strong balance sheet with ~$500M of acquisition capacity (estimate); management has indicated active pipeline in gas detection and connected safety.
- Regulatory Tailwinds: Increasing global workplace safety regulations, particularly in emerging markets, driving demand for certified safety equipment.
5. Competitive Landscape and Related Equities
Primary Competitors
| Competitor | Ticker | Market Share (est.) | Focus Areas |
|---|---|---|---|
| 3M Company (Safety segment) | MMM | ~15% | Respiratory protection, fall protection |
| Honeywell International (Safety & Productivity) | HON | ~12% | Gas detection, PPE, SCBA |
| Drägerwerk AG | DRWKF (OTC) | ~8% | Gas detection, SCBA, medical |
| Scott Safety (3M subsidiary) | — | ~7% | SCBA, fire service equipment |
| DuPont (Safety segment) | DD | ~5% | Protective apparel, Kevlar |
| Ansell Limited | ANSLY (OTC) | ~4% | Industrial hand protection |
Related Equities (Frequently Mentioned Alongside MSA)
| Ticker | Company | Relationship |
|---|---|---|
| HON | Honeywell International | Direct competitor in gas detection and SCBA; Honeywell’s safety segment is the closest large-cap comp. |
| MMM | 3M Company | Competitor in respiratory and fall protection; also a key supplier of materials to MSA. |
| LFUS | Littelfuse | Industrial safety components supplier; often compared for exposure to industrial safety trends. |
| ALSN | Allison Transmission | Frequently mentioned in industrial safety/defense context due to similar end-market exposure. |
| ITW | Illinois Tool Works | Diversified industrial with safety segment; used as a quality-growth comp. |
6. Investment Thesis
Bull Case
- Recurring Revenue Growth: The transition to connected safety solutions (MSA+) creates a high-margin, recurring software revenue stream that could command a higher multiple over time.
- Regulatory Tailwinds: Global safety regulations continue to tighten, particularly in Asia and Latin America, driving structural demand growth for certified safety equipment.
- Margin Expansion Potential: With gross margins near 47% and operating margins at 21%, MSA has demonstrated pricing power; continued operational excellence could drive margins toward 25%.
- Strong FCF Generation: ~$316M of FCF on a $7.4B market cap implies a ~4.3% FCF yield, supporting continued dividend growth and M&A.
- Defensive Characteristics: Safety equipment is mission-critical and non-discretionary; demand remains resilient through economic cycles.
Bear Case
- Valuation Premium: At 23.9x trailing and 19.2x forward earnings, MSA trades at a premium to the industrial sector average (~18x forward). Any growth disappointment could trigger multiple compression.
- Modest Organic Growth: FY2025 revenue growth of only 3.7% (and 6.2% per Yahoo Finance data) suggests the company is growing slower than the 5-7% long-term target; FX headwinds and mature Western markets limit upside.
- Integration Risk: The company has been acquisitive (Bacharach, etc.); poor integration or overpayment could destroy value.
- Customer Concentration in Municipalities: Fire service demand depends on municipal budgets, which can be volatile and subject to political priorities.
- Competitive Pressure: Honeywell and 3M have deeper R&D budgets and broader distribution; MSA could lose share in certain product categories.
Capital Raising Activity (Last 6 Months & Projections)
| Event | Date | Details |
|---|---|---|
| Dividend Declaration | Q2 2026 | Quarterly dividend of $0.22/share (est.), representing ~1.1% yield |
| Share Repurchases | Ongoing | ~$50M remaining under current authorization (est.); company repurchased ~$30M in H1 2026 (est.) |
| Debt Issuance | None in last 6 months | Company has $200M cash and $644M debt; no near-term refinancing needs |
| M&A Activity | None announced in last 6 months | Management actively evaluating tuck-in acquisitions in gas detection and connected safety |
Projected Capital Allocation (Next 6 Months): We estimate MSA will generate ~$170M of FCF in H2 2026 (estimate). Expected allocation: ~$25M dividends, ~$20M share buybacks, ~$45M capex, with the remaining ~$80M available for M&A or debt reduction.
Conclusion
MSA Safety is a high-quality, defensive industrial with strong margins, excellent cash generation, and a solid balance sheet. The company is well-positioned to benefit from secular safety regulation trends and the transition to connected worker technologies. However, at 19.2x forward earnings, the stock is fairly valued relative to its growth profile. We initiate with a Market Perform rating and a 12-month price target of $195 (implying ~1.5% upside from current levels), based on 22.5x our FY2027 EPS estimate of $8.75 (estimate). Key upside risks include faster-than-expected connected safety adoption and accretive M&A; key downside risks include margin compression and slower organic growth.
Disclaimer: This report is for informational and educational purposes only and does not constitute investment advice. Data sourced from Yahoo Finance (as of August 04, 2026) and company filings; all estimates not explicitly sourced from the provided data are clearly labeled as such. The analysis may contain errors — always verify against primary filings (10-K/10-Q/8-K) before making any investment decision.
Discover more from CANSLIM Research
Subscribe to get the latest posts sent to your email.