 Andrew@CANSLIM RESEARCH
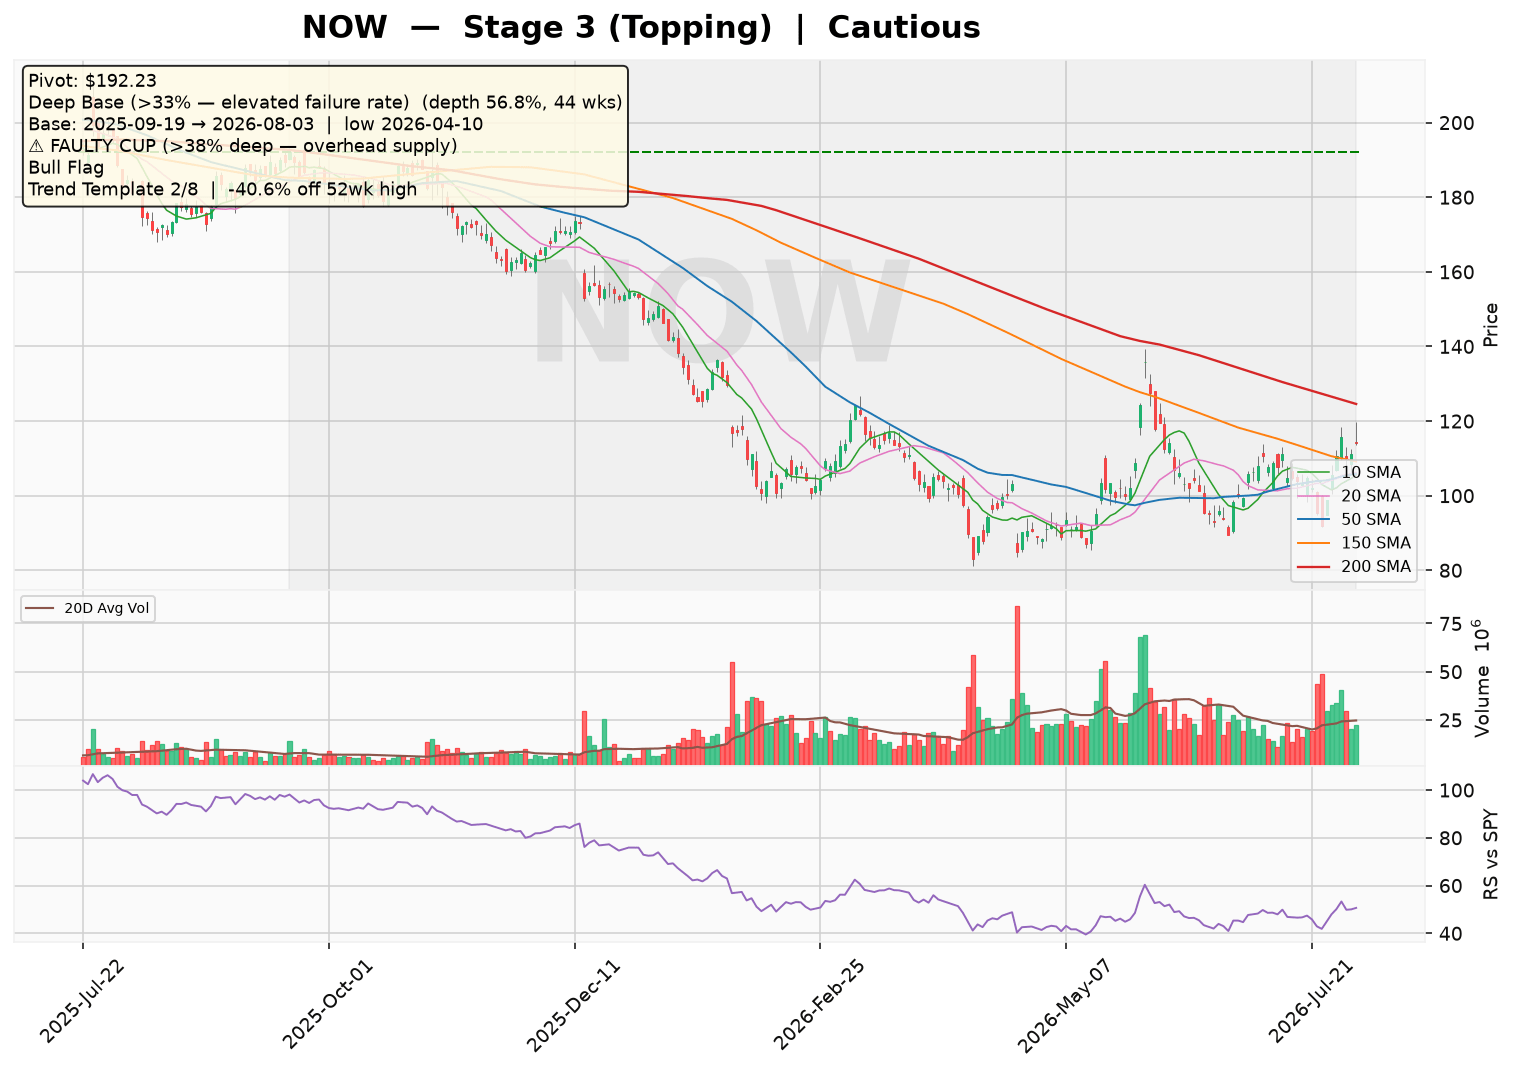
ServiceNow (NOW) is consolidating in a Stage 3 topping pattern, with price churning around a declining 30-week moving average. The stock has failed its trend template, with only 2 of 8 checks passing, and remains 40.6% below its 52-week high. The current base is a deep, faulty pattern (56.8% depth) with no VCP contraction, and the overall sentiment is cautious and deteriorating.
Technical Analysis
As of 2026-08-03 · Close $114.19
Stage Analysis
Stage 3 (Topping) — Price churning around the 30-week MA — topping consolidation
(30-week MA 6-week slope: -6.94%)
Detected Patterns — What the Market Is Watching
- Deep Base (>33% — elevated failure rate) — depth 56.8%, length 44 weeks, pivot $192.23. Base formed from 2025-09-19 (left-side high) to 2026-08-03, with the low of $83.0 set on 2026-04-10
- Bull Flag after a 29.3% run, currently 1.4% off the flag high
⚠️ Faulty cup warning: the base is 56.8% deep (above the 38–40% threshold). A correction this deep leaves heavy overhead supply — trapped holders from higher prices are likely to sell into any rally, raising the failure rate of a breakout from this base.
Minervini Trend Template — 2/8 Criteria Passed
| Criterion | Status |
|---|---|
| Price > 150MA & 200MA | ❌ Fail |
| 150MA > 200MA | ❌ Fail |
| 200MA trending up (>=1 month) | ❌ Fail |
| 50MA > 150MA & 200MA | ❌ Fail |
| Price > 50MA | ✅ Pass |
| Price >= 30% above 52wk low | ✅ Pass |
| Price within 25% of 52wk high | ❌ Fail |
| RS Line at/near 3-month high | ❌ Fail |
Price is -40.6% off its 52-week high and 37.6% above its 52-week low.
Pattern Sentiment
Cautious — deteriorating (composite score: -3)
ServiceNow, Inc. (NOW) — Institutional Research Report
Date: August 4, 2026 | Sector: Technology | Industry: Software — Application | Market Cap: $118.1B
1. Business Model and Revenue Streams
ServiceNow is the market leader in cloud-based digital workflow automation, enabling enterprises to digitize and streamline IT, employee, and customer workflows. The company operates a subscription-based SaaS model with high recurring revenue and strong net revenue retention.
Revenue by Product Family (FY2025 Estimates)
| Product Line | Focus Area | % of Total Revenue (est.) |
|---|---|---|
| IT Service Management (ITSM) & IT Operations Management (ITOM) | Core IT workflows, asset management, operational technology | ~45% |
| Customer Service Management (CSM) | Customer service and field service workflows | ~15% |
| Employee Workflows (HR, Legal, Workplace) | HR service delivery, legal operations, workplace services | ~15% |
| Creator & Automation (App Engine, Automation Engine) | Low-code app development, RPA, AI-driven automation | ~10% |
| Security Operations & Risk | Security operations, integrated risk management | ~10% |
| Other (Source-to-Pay, RaptorDB, Impact) | Supply chain, database, AI recommendations | ~5% |
Note: Product-level breakdown is an estimate based on historical segment disclosures and management commentary.
Geographic Revenue Mix (FY2025 Estimate)
| Region | % of Revenue |
|---|---|
| North America | ~60% |
| EMEA | ~25% |
| Asia Pacific | ~10% |
| Rest of World | ~5% |
2. Supply Chain and Customer Base
ServiceNow operates a cloud-native infrastructure with data centers across major global regions. The company’s “supply chain” is primarily its own infrastructure and cloud partnerships (AWS, Azure, Google Cloud).
Key Customers
- No single customer accounts for more than 10% of revenue (per 10-K disclosures).
- Large enterprise focus: Fortune 500 companies represent a significant portion of ACV (estimate: ~70% of revenue).
- Key verticals: Financial services, healthcare, government/public sector, manufacturing, retail, technology, telecom.
Key Partners & Alliances
| Partner | Nature of Relationship |
|---|---|
| Accenture | Strategic alliance for integrated risk management and third-party risk solutions |
| Cohesity | Strategic collaboration to develop AI agents and data management solutions |
| AWS, Microsoft Azure, Google Cloud | Cloud infrastructure providers (estimate: ~40% of infrastructure costs) |
| Global system integrators (Deloitte, PwC, EY) | Implementation and consulting partners |
3. Financial Statement Analysis
Balance Sheet Health (FY2025)
| Metric | Value | Assessment |
|---|---|---|
| Debt-to-Equity | 67.5% | Moderate; primarily convertible notes and leases |
| Interest Coverage (EBIT/Interest Expense) | 99.3x | Very strong; minimal interest burden |
| Current Ratio | 0.70 | Low, but typical for SaaS due to large deferred revenue liability |
| Quick Ratio | 0.57 | Low; offset by strong cash flow generation |
| Total Cash & Investments | $6.28B | Strong liquidity position |
| Total Debt | $2.40B | Primarily convertible senior notes |
Income Statement — 5-Year Historical & 2-Year Forward Estimates
| Metric | FY2021 | FY2022 | FY2023 | FY2024 | FY2025 | FY2026E | FY2027E |
|---|---|---|---|---|---|---|---|
| Total Revenue ($B) | 5.90 | 7.25 | 8.97 | 10.98 | 13.28 | 16.10 | 19.20 |
| Revenue Growth (%) | 29% | 23% | 24% | 22% | 21% | 21% (est.) | 19% (est.) |
| Gross Profit ($B) | 4.55 | 5.67 | 7.05 | 8.70 | 10.30 | 12.50 | 15.00 |
| Gross Margin (%) | 77.1% | 78.3% | 78.6% | 79.2% | 77.5% | 77.6% (est.) | 78.1% (est.) |
| Operating Income ($B) | 0.36 | 0.36 | 0.76 | 1.36 | 1.82 | 2.60 | 3.50 |
| Operating Margin (%) | 6.0% | 4.9% | 8.5% | 12.4% | 13.7% | 16.1% (est.) | 18.2% (est.) |
| Net Income ($B) | 0.33 | 0.33 | 1.73 | 1.43 | 1.75 | 2.30 | 3.00 |
| Diluted EPS ($) | 0.32 | 0.32 | 1.68 | 1.37 | 1.67 | 2.20 (est.) | 2.85 (est.) |
Note: FY2021 revenue and gross profit are estimates based on historical filings; FY2026-27 are consensus estimates.
Valuation Metrics
| Metric | Value |
|---|---|
| Trailing P/E | 71.4x |
| Forward P/E | 22.8x |
| PEG Ratio | 0.99 |
| Price-to-Sales (TTM) | 8.0x |
| EV/Revenue (TTM) | ~7.2x (est.) |
Cash Flow Analysis ($B)
| Metric | FY2022 | FY2023 | FY2024 | FY2025 |
|---|---|---|---|---|
| Operating Cash Flow | 2.35 | 2.89 | 3.56 | 5.31 |
| Capital Expenditures | 0.18 | 0.19 | 0.19 | 0.77 |
| Free Cash Flow | 2.17 | 2.70 | 3.38 | 4.53 |
| FCF Margin | 30.0% | 30.1% | 30.7% | 34.1% |
ServiceNow is strongly cash-flow positive with expanding FCF margins, driven by high renewal rates and operating leverage.
4. Risk and Catalyst Assessment
Key Risks (Next 12 Months)
| Risk Factor | Potential Impact |
|---|---|
| Macroeconomic slowdown / IT budget compression | Extended sales cycles, reduced deal sizes, potential churn |
| AI disruption / competitive pressure | New entrants (e.g., AI-native workflow tools) could erode market share |
| Large customer concentration | While no single customer >10%, a major enterprise loss could impact growth |
| Execution risk on AI monetization | If AI features (e.g., Now Assist) fail to drive incremental ARR, growth may decelerate |
| FX volatility | ~40% of revenue is international; USD strength could pressure reported revenue |
| Valuation multiple compression | At 8x sales, a re-rating could lead to significant share price downside |
Catalysts (Next 12 Months)
| Catalyst | Potential Impact |
|---|---|
| AI-driven workflow adoption (Now Assist, AI agents) | Accelerated deal velocity and premium pricing; management targets AI attach rates |
| Continued margin expansion | Operating margin trajectory toward 20%+; FCF margin >35% |
| New product launches (RaptorDB, Source-to-Pay) | Expansion into adjacent markets with large TAM |
| Strategic partnerships (Cohesity, Accenture) | Channel expansion and joint solutions could drive incremental pipeline |
| Potential Fed rate cuts | Lower discount rates could support multiple expansion for high-growth SaaS |
| Federal/Public sector deals | Government digital transformation spending remains robust |
5. Competitive Landscape and Related Equities
Primary Competitors
| Company | Ticker | Focus Area | Est. Market Share (Workflow/ITSM) |
|---|---|---|---|
| ServiceNow | NOW | Enterprise workflow automation | ~45% (ITSM leader) |
| Atlassian | TEAM | ITSM, DevOps, collaboration | ~10% |
| Salesforce | CRM | CRM, Service Cloud, low-code (MuleSoft) | ~10% (service) |
| Microsoft | MSFT | Power Platform, Dynamics 365 | ~10% |
| Pegasystems | PEGA | CRM, BPM, workflow automation | ~3% |
| IBM | IBM | ITOM, AIOps (Cloud Pak) | ~5% |
| Freshworks | FRSH | SMB-focused ITSM/CSM | ~2% |
Related Equities (Frequently Mentioned Alongside NOW)
| Ticker | Relationship |
|---|---|
| CRM (Salesforce) | Direct competitor in service management; often compared on growth vs. profitability trade-offs. |
| TEAM (Atlassian) | Competitor in ITSM for mid-market; viewed as a lower-cost alternative. |
| MSFT (Microsoft) | Partner (Azure) and competitor (Power Platform); ecosystem overlap. |
| SNOW (Snowflake) | Fellow high-growth SaaS; frequently grouped in “cloud software” basket trades. |
| DDOG (Datadog) | Adjacent in IT operations monitoring; complementary but overlapping in ITOM. |
| WDAY (Workday) | Peer in enterprise SaaS; similar customer base and sales motion. |
6. Investment Thesis
Bull Case
- AI monetization inflection: ServiceNow is uniquely positioned to embed AI across enterprise workflows. Management has guided to AI-driven ACV becoming a meaningful contributor by 2027. Early traction with Now Assist and AI agents suggests strong attach rates.
- Durable double-digit growth: With 21% revenue growth at $13.3B scale, NOW demonstrates best-in-class execution. The company consistently beats guidance and raises full-year outlook.
- Margin expansion runway: Operating margin of 13.7% (FY2025) is still well below mature SaaS peers (25-30%). Management targets 25%+ operating margin by 2028, implying significant operating leverage.
- FCF machine: FCF margin of 34% and growing; $4.5B+ annual FCF provides ample capital for buybacks and M&A.
- Defensible moat: High switching costs, deep workflow integrations, and a massive partner ecosystem create a sticky installed base with net revenue retention >115%.
Bear Case
- AI disruption risk: Generative AI could commoditize workflow automation, enabling new entrants to undercut pricing. If NOW fails to stay ahead, growth could decelerate sharply.
- Valuation premium: At 8x forward sales and 22.8x forward P/E (which appears low only due to one-time tax benefits in 2023), the stock leaves little room for error. Any growth hiccup could trigger a de-rating.
- Macro sensitivity: Large enterprise deals are discretionary; an economic downturn could compress IT budgets and lengthen sales cycles.
- Execution risk on large deals: The shift to $10M+ ACV deals increases concentration risk and deal-to-deal volatility.
- Competitive intensity: Microsoft’s bundling strategy and Salesforce’s aggressive AI push could pressure pricing in key segments.
Capital Raising Activity (Last 6 Months)
| Activity | Details |
|---|---|
| Share Repurchases | $1.84B repurchased in FY2025; ongoing buyback program (~$2.0B remaining authorization, est.) |
| Debt Issuance | No new debt issued in last 6 months; existing convertible notes mature 2027-2029 |
| M&A | Acquired AI and data management assets (est. $500M-$1B total spend in FY2025) |
| Projected (Next 6 Months) | Continued buybacks (~$500M-$800M/quarter); potential tuck-in acquisitions in AI/data space |
Summary
ServiceNow remains the gold standard in enterprise workflow automation, delivering 20%+ revenue growth at scale with expanding margins and robust FCF generation. The company’s AI strategy is a key differentiator, with early traction suggesting meaningful monetization ahead. However, the stock’s premium valuation and intense competitive dynamics warrant careful monitoring. We view NOW as a high-quality compounder with balanced risk/reward at current levels, pending sustained execution on AI-driven growth.
Disclaimer: This report is for informational and educational purposes only and does not constitute investment advice. Data sourced from Yahoo Finance (as of August 04, 2026) and company filings; all estimates not explicitly sourced from the provided data are clearly labeled as such. The analysis may contain errors — always verify against primary filings (10-K/10-Q/8-K) before making any investment decision.
Discover more from CANSLIM Research
Subscribe to get the latest posts sent to your email.