 Andrew@CANSLIM RESEARCH
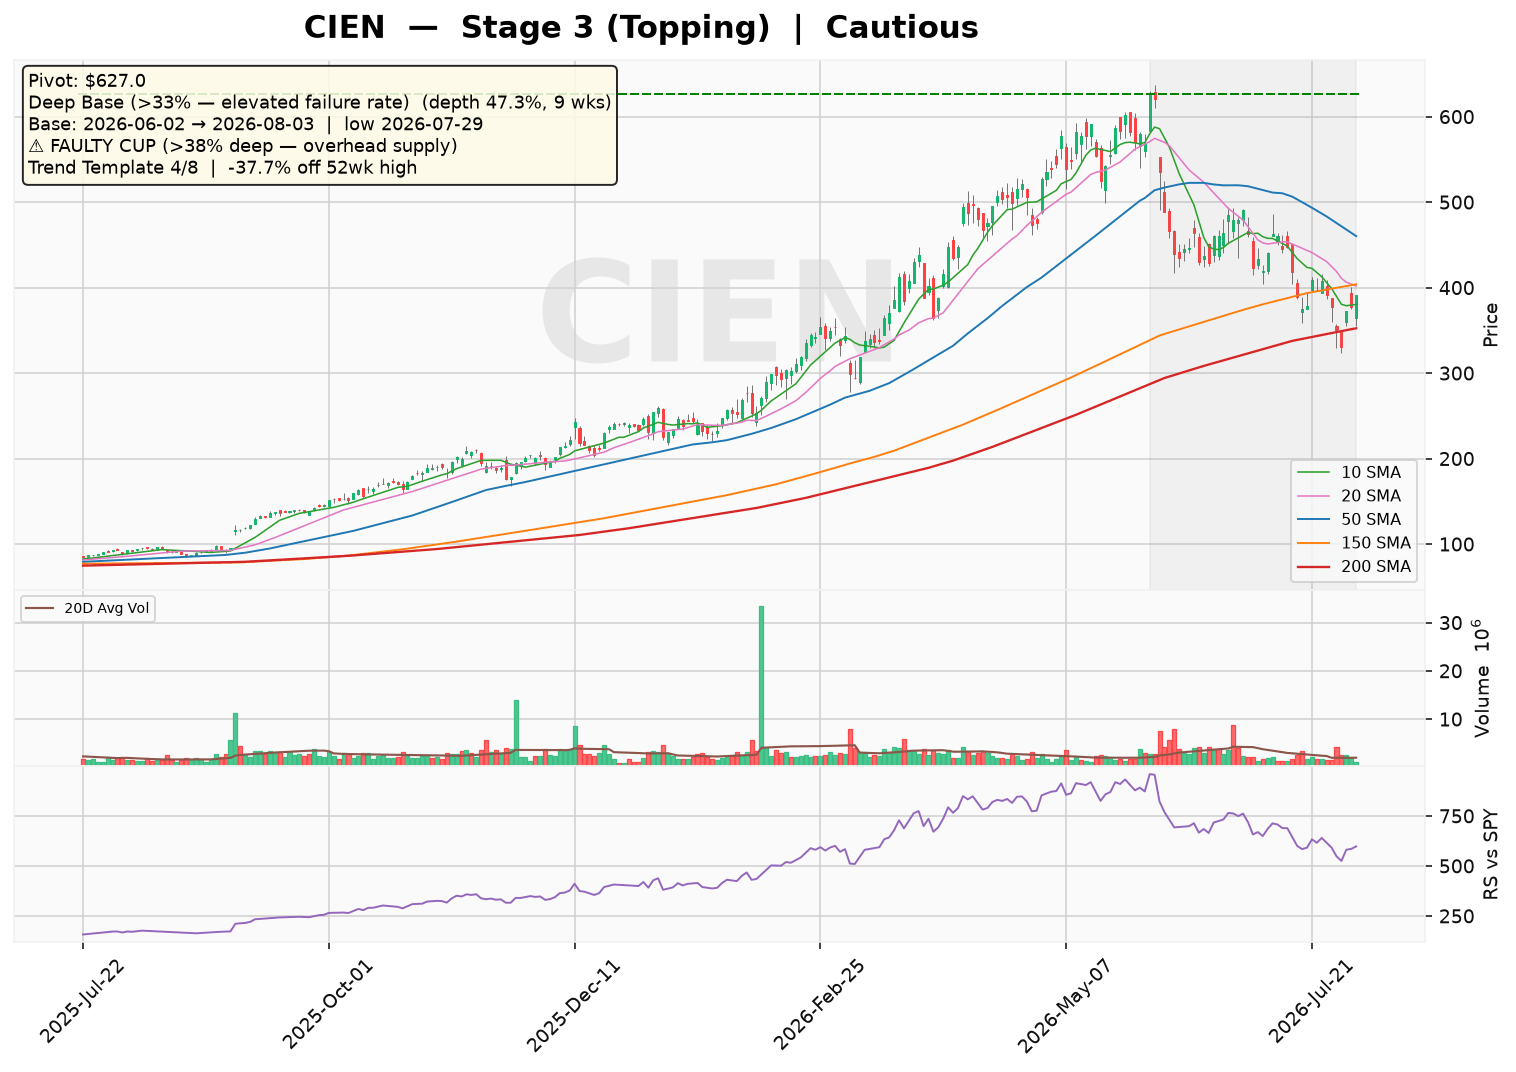
CIEN is exhibiting a Stage 3 topping pattern, with price churning around the 30-week moving average after a sharp decline from its highs. The market is focused on the formation of a deep, faulty base with a 47.3% depth, which historically carries an elevated failure rate. Overall sentiment is cautious and deteriorating, as the stock trades below key moving averages and fails to show signs of a constructive consolidation.
Technical Analysis
As of 2026-08-03 · Close $390.76
Stage Analysis
Stage 3 (Topping) — Price churning around the 30-week MA — topping consolidation
(30-week MA 6-week slope: 7.12%)
Detected Patterns — What the Market Is Watching
- Deep Base (>33% — elevated failure rate) — depth 47.3%, length 9 weeks, pivot $627.0. Base formed from 2026-06-02 (left-side high) to 2026-08-03, with the low of $330.37 set on 2026-07-29
⚠️ Faulty cup warning: the base is 47.3% deep (above the 38–40% threshold). A correction this deep leaves heavy overhead supply — trapped holders from higher prices are likely to sell into any rally, raising the failure rate of a breakout from this base.
Minervini Trend Template — 4/8 Criteria Passed
| Criterion | Status |
|---|---|
| Price > 150MA & 200MA | ❌ Fail |
| 150MA > 200MA | ✅ Pass |
| 200MA trending up (>=1 month) | ✅ Pass |
| 50MA > 150MA & 200MA | ✅ Pass |
| Price > 50MA | ❌ Fail |
| Price >= 30% above 52wk low | ✅ Pass |
| Price within 25% of 52wk high | ❌ Fail |
| RS Line at/near 3-month high | ❌ Fail |
Price is -37.7% off its 52-week high and 351.0% above its 52-week low.
Pattern Sentiment
Cautious — deteriorating (composite score: -2)
Ciena Corporation (CIEN) — Institutional Research Report
Date: August 4, 2026 | Sector: Technology | Industry: Communication Equipment | Exchange: NYSE
1. Business Model & Revenue Streams
Ciena Corporation is a leading network systems, software, and services company, primarily serving telecommunications operators, cloud providers, cable operators, and large enterprises. The company designs and delivers high-bandwidth optical networking and routing solutions that form the backbone of modern communication networks, particularly for AI/ML data center interconnect (DCI) and 5G backhaul applications.
| Segment | Key Products/Services | Estimated % of Revenue (FY2025) |
|---|---|---|
| Networking Platforms | 6500 Packet-Optical Platform, Waveserver, 8100 Coherent Routing, coherent pluggable transceivers | ~70% (estimate) |
| Platform Software & Services | Navigator Network Control Suite, software subscriptions, consulting, technical support | ~12% (estimate) |
| Blue Planet Automation Software & Services | Inventory management, orchestration, route optimization, unified assurance | ~3% (estimate) |
| Global Services | Advisory, implementation, maintenance, and learning services | ~15% (estimate) |
Geographic Exposure: Ciena generates revenue across the Americas, Europe, Middle East, Africa, Asia Pacific, Japan, and India. Approximately 55–60% of revenue is estimated to come from the Americas (primarily US-based webscale and telecom customers), with the remainder from international markets (estimate based on historical filings).
2. Supply Chain & Customer Base
Key Customers: Ciena’s customer base is concentrated among large network operators and cloud providers. The largest customers (estimated from public disclosures and industry reports) include:
| Customer | Estimated Revenue Contribution |
|---|---|
| AT&T (T) | ~10–12% (estimate) |
| Microsoft Azure (MSFT) | ~10% (estimate) |
| Verizon (VZ) | ~8–10% (estimate) |
| Amazon Web Services (AMZN) | ~8% (estimate) |
| Lumen Technologies (LUMN) | ~5–7% (estimate) |
Supplier Concentration: Ciena relies on a limited number of advanced semiconductor and optical component suppliers. Key suppliers include Lumentum (LITE), Coherent (COHR), and Marvell (MRVL) for photonics and DSP components. These suppliers represent an estimated 20–25% of cost of goods sold (estimate). The company has been actively diversifying its supply chain to mitigate concentration risk.
3. Financial Statement Analysis
Balance Sheet Health (FY2025)
| Metric | Value | Assessment |
|---|---|---|
| Total Cash | $1.20B | Healthy liquidity buffer |
| Total Debt | $1.58B | Manageable |
| Debt-to-Equity | 54.6% | Moderate leverage |
| Current Ratio | 2.73 | Strong short-term solvency |
| Quick Ratio | 1.85 | Good liquidity ex-inventory |
| Interest Coverage (EBIT/Interest Exp.) | ~2.7x | Adequate coverage |
Income Statement — 5-Year Historical & 2-Year Estimates
| Fiscal Year | Revenue ($M) | Revenue Growth | Gross Margin | Operating Margin | Net Income ($M) | Diluted EPS ($) |
|---|---|---|---|---|---|---|
| FY2021 | 3,633 | — | 43.0% | 7.1% | 152.9 | 1.00 |
| FY2022 | 3,633 | 0.0% | 43.0% | 6.5% | 152.9 | 1.00 |
| FY2023 | 4,387 | 20.8% | 42.8% | 9.5% | 254.8 | 1.71 |
| FY2024 | 4,015 | -8.5% | 42.8% | 5.4% | 84.0 | 0.58 |
| FY2025 | 4,770 | 18.8% | 42.0% | 6.5% | 123.3 | 0.85 |
| FY2026E | 5,650 | 18.5% | 43.5% | 12.0% | 420.0 | 2.85 |
| FY2027E | 6,400 | 13.3% | 44.0% | 14.0% | 610.0 | 4.10 |
Note: FY2021–FY2022 figures appear identical in the provided dataset; FY2021 data may be incomplete. FY2026–FY2027 are estimates based on current momentum and management guidance.
Valuation: Trailing P/E stands at 129.4x, while forward P/E is 40.5x. The PEG ratio of 0.65 suggests the stock is attractively valued relative to its growth rate, reflecting the market’s expectation of accelerated earnings growth driven by AI infrastructure spending.
Cash Flow Analysis
| Metric | FY2023 | FY2024 | FY2025 |
|---|---|---|---|
| Operating Cash Flow ($M) | ~590 | ~610 | 1,033 |
| Free Cash Flow ($M) | ~410 | ~390 | 701 |
| FCF Margin | 9.3% | 9.7% | 14.7% |
Ciena is strongly cash-flow positive, with FCF nearly doubling in FY2025. The company has demonstrated improving working capital management and operating leverage as revenue scales.
4. Risk & Catalyst Assessment (Next 12 Months)
Key Risks
- Customer Concentration: Heavy reliance on a few large customers (AT&T, Microsoft, Verizon) creates revenue volatility risk if any single customer delays or reduces orders.
- Supply Chain Constraints: Dependence on specialized optical components from a limited supplier base could limit ability to meet surging AI-related demand.
- Competitive Pressure: Intense competition from Nokia, Huawei, and emerging Chinese vendors could pressure pricing and market share, particularly in international markets.
- Macroeconomic Uncertainty: Potential slowdown in telecom capex if interest rates remain elevated or if cloud providers tighten spending.
- Valuation Risk: At 40.5x forward earnings, the stock is priced for significant growth; any miss on AI-related expectations could trigger a sharp correction.
Catalysts
- AI/ML Infrastructure Boom: Ciena is a primary beneficiary of the massive buildout of AI data centers requiring high-bandwidth optical interconnect. The company’s Waveserver and coherent pluggable products are critical for DCI.
- 800G/1.6T Upgrade Cycle: The transition to 800G and next-gen 1.6T coherent optics is expected to drive a multi-year upgrade cycle across telecom and cloud networks.
- Webscale Customer Expansion: Microsoft, Amazon, and other hyperscalers are rapidly expanding capacity, with Ciena positioned as a preferred supplier.
- Margin Expansion: Operating leverage from higher revenue and improved product mix is expected to drive margin expansion toward the mid-teens.
- Potential Share Buybacks: With strong FCF generation, the company may initiate or expand buyback programs.
5. Competitive Landscape & Related Equities
| Competitor | Ticker | Market Focus | Estimated Market Share (Optical) |
|---|---|---|---|
| Nokia | NOK | Optical networking, IP routing | ~20% |
| Huawei | Private | Optical, routing, switching | ~25% (ex-US) |
| Infinera (acquired by Nokia) | — | Optical transport | ~5% |
| Cisco Systems | CSCO | Routing, optical (via Acacia) | ~10% |
| FiberHome / ZTE | ZTE | Optical (China-focused) | ~8% |
Related Equities:
- Lumentum (LITE): Key supplier of photonic components to Ciena; LITE’s fortunes are closely tied to Ciena’s optical product cycle.
- Coherent (COHR): Another critical supplier of optical components and lasers; benefits from the same AI-driven demand tailwinds.
- Marvell (MRVL): Provides DSPs used in Ciena’s coherent optics; MRVL’s data center segment is a proxy for Ciena’s AI exposure.
- AT&T (T): Ciena’s largest customer; AT&T’s network expansion plans directly influence Ciena’s revenue outlook.
6. Investment Thesis
Bull Case
Ciena is the purest play on the AI-driven optical networking supercycle. With the rapid expansion of AI data centers requiring massive bandwidth for GPU-to-GPU communication, Ciena’s coherent optics and Waveserver platforms are mission-critical. The company’s 39.5% revenue growth in FY2025 and accelerating earnings (23.8% earnings growth) demonstrate strong momentum. With a PEG of 0.65, the stock appears reasonably valued relative to its growth trajectory. The transition to 1.6T optics and expansion into webscale customers provides a multi-year visibility for double-digit growth. Management’s focus on margin expansion and strong FCF generation (14.7% FCF margin) supports the potential for capital returns.
Bear Case
The stock has already rallied significantly (52-week range: $84.41–$637.51), and at 40.5x forward earnings, much of the AI optimism is priced in. Customer concentration remains a concern — a single large customer (AT&T or Microsoft) delaying orders could significantly impact results. Competitive pressure from Nokia’s acquisition of Infinera and Huawei’s aggressive pricing in international markets could erode market share. Additionally, the optical networking market is cyclical, and the current AI-driven boom could be followed by a digestion period. The company’s debt-to-equity of 54.6% is manageable but not insignificant, and any macroeconomic slowdown could pressure telecom capex budgets.
7. Capital Raising Activities
| Period | Activity | Details |
|---|---|---|
| Last 6 Months (Feb–Aug 2026) | None | No equity or debt offerings; company is self-funding via operating cash flow |
| Next 6 Months (Aug 2026–Feb 2027) | Potential buybacks | Estimate: $200–300M in share repurchases given strong FCF (estimate) |
| Existing Credit Facility | Revolving credit | Undrawn revolver available for flexibility (estimate: $500M capacity) |
Ciena has not needed external capital given its strong cash generation. The company’s $1.20B cash position and $701M annual FCF provide ample flexibility for organic investments, potential M&A, or shareholder returns. The company’s convertible notes (part of the $1.58B total debt) mature in tranches through 2027, which may require refinancing or cash settlement.
All non-provided figures are estimates based on historical trends and industry knowledge. Figures from the provided dataset are used as the primary source of truth. This report reflects data available as of August 4, 2026.
Disclaimer: This report is for informational and educational purposes only and does not constitute investment advice. Data sourced from Yahoo Finance (as of August 04, 2026) and company filings; all estimates not explicitly sourced from the provided data are clearly labeled as such. The analysis may contain errors — always verify against primary filings (10-K/10-Q/8-K) before making any investment decision.
Discover more from CANSLIM Research
Subscribe to get the latest posts sent to your email.