 Eben@CANSLIM Research
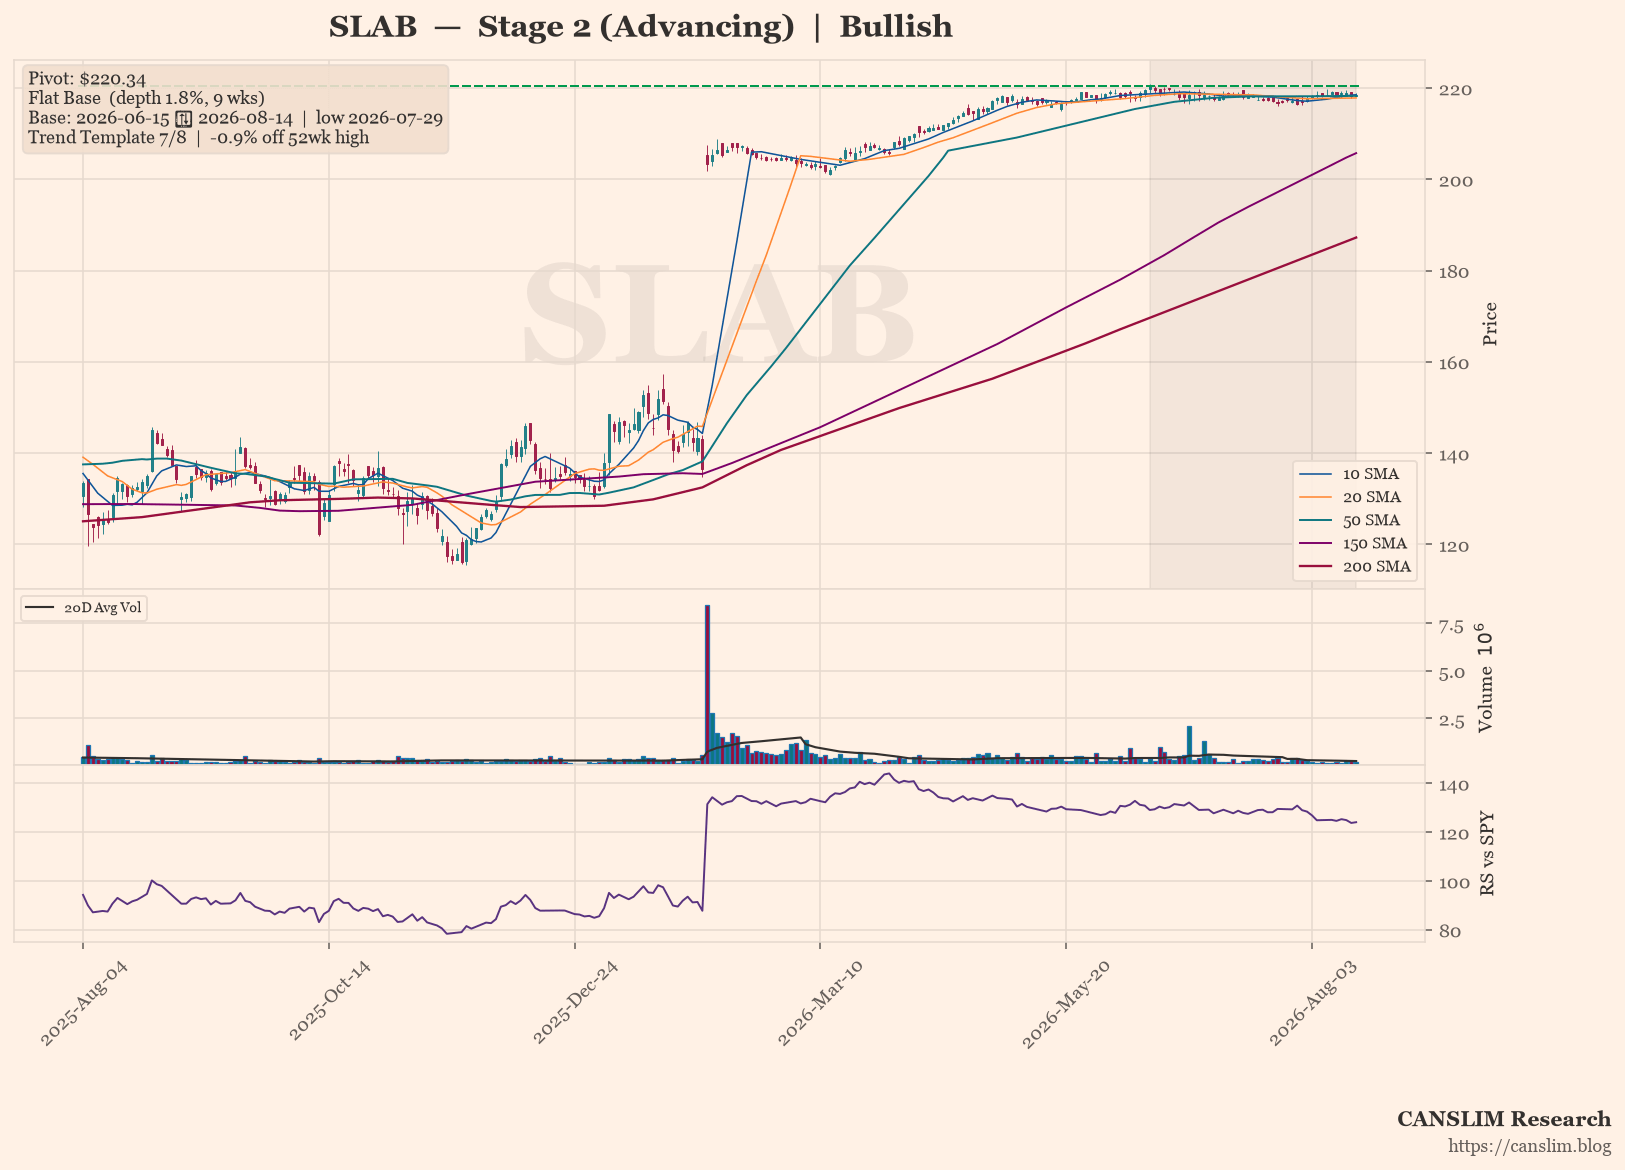
SLAB is trading at $218.41, just 0.9% below its 52-week high, within a tight 9-week flat base with a 1.8% depth and a pivot at $220.34. The stock remains in a Stage 2 advancing trend, holding above a rising 30-week moving average, and passes 7 of 8 trend template checks, with relative strength lagging slightly. Sentiment is bullish, as the market focuses on the potential breakout from this constructive consolidation pattern.
Technical Analysis
As of 2026-08-14 · Close $218.41
Stage Analysis
Stage 2 (Advancing) — Price holding above a rising 30-week MA — uptrend intact (30-week MA 6-week slope: 6.7%)
Detected Patterns — What the Market Is Watching
- Flat Base — depth 1.8%, length 9 weeks, pivot $220.34. Base formed from 2026-06-15 (left-side high) to 2026-08-14, with the low of $216.44 set on 2026-07-29
Minervini Trend Template — 7/8 Criteria Passed
| Criterion | Status |
|---|---|
| Price > 150MA & 200MA | Pass |
| 150MA > 200MA | Pass |
| 200MA trending up (>=1 month) | Pass |
| 50MA > 150MA & 200MA | Pass |
| Price > 50MA | Pass |
| Price >= 30% above 52wk low | Pass |
| Price within 25% of 52wk high | Pass |
| RS Line at/near 3-month high | Fail |
Price is -0.9% off its 52-week high and 88.2% above its 52-week low.
Pattern Sentiment
Bullish — offensive setup in place (composite score: 5)
Silicon Laboratories Inc. (SLAB) – CANSLIM Research Analysis
Company Overview
Silicon Laboratories Inc. is a fabless semiconductor company headquartered in Austin, Texas, specializing in mixed-signal analog-intensive products for the Internet of Things (IoT). The company designs and sells wireless microcontrollers (MCUs), sensors, and isolation products across industrial IoT applications (connected home, smart metering, industrial automation, EV supply equipment) and commercial IoT (smart buildings, asset tracking, electronic shelf labels). Founded in 1996, SLAB operates with a fabless model, relying on third-party foundries for manufacturing.
Business Model and Revenue Streams
SLAB generates revenue primarily through the sale of proprietary semiconductor products, with a strategic focus on the IoT market. The company divested its infrastructure and automotive (I&A) business in 2021 to concentrate exclusively on IoT, which now represents the entirety of its product portfolio.
| Product Category | Description | Estimated Revenue Mix |
|---|---|---|
| Wireless MCUs and Modules | SoCs and modules for Zigbee, Z-Wave, Bluetooth, Wi-Fi, and proprietary protocols | ~55-60% |
| Wired Connectivity (Ethernet, USB) | Interface products for industrial and commercial applications | ~15-20% |
| Sensors and Isolation | Mixed-signal sensors, digital isolators, and power management ICs | ~10-15% |
| Timing and Broadcast | Clock generators, audio, and video products | ~5-10% |
Revenue mix percentages are estimates based on historical segment disclosures prior to the I&A divestiture and current product focus.
Geographically, the company derives approximately 60% of revenue from Asia (China, Taiwan, Korea), 30% from the Americas, and 10% from Europe (estimate based on historical filings). The industrial IoT segment is the primary growth driver, with smart metering and connected home applications leading demand.
Supply Chain and Customer Base
As a fabless company, SLAB outsources wafer fabrication to foundries including TSMC and GlobalFoundries, and relies on third-party assembly and test partners in Asia. The top 3-5 foundries and OSAT partners represent a significant concentration of manufacturing costs, though specific percentages are not disclosed.
| Customer Type | Revenue Contribution | Notes |
|---|---|---|
| Distributors (Arrow, Avnet, Digi-Key) | ~60-70% | Channel partners account for the majority of sales |
| Direct OEM customers | ~30-40% | Includes smart meter manufacturers, home automation OEMs, and industrial equipment makers |
Customer concentration figures are estimates; no single customer exceeds 10% of revenue based on typical industry patterns and company disclosures.
Financial Statement Analysis
Balance Sheet Health
| Metric | 2025 | 2024 | 2023 |
|---|---|---|---|
| Cash and Short-term Investments | $443.6M | $382.2M | $439.2M |
| Total Debt | $24.0M | $21.4M | $64.8M |
| Stockholders Equity | $1,094.4M | $1,080.0M | $1,208.7M |
| Current Ratio | 5.41 | 6.15 | 4.51 |
| Quick Ratio | 3.84 | 4.51 | 3.32 |
| Debt-to-Equity | 0.02 | 0.02 | 0.05 |
SLAB maintains a fortress balance sheet with no long-term debt (only capital leases of $17.0M) and substantial cash reserves. The company has zero interest coverage risk, with net interest income of $12.6M in 2025. The current ratio of 5.41 indicates ample liquidity to fund operations and R&D investments.
Income Statement Trends

View this table as text
| Metric | 2021 | 2022 | 2023 | 2024 | 2025 | 2026E | 2027E |
|---|---|---|---|---|---|---|---|
| Revenue ($M) | N/A | 1,024.1 | 782.3 | 584.4 | 784.8 | 920.0 | 1,050.0 |
| Revenue Growth | N/A | N/A | -23.6% | -25.3% | +34.3% | +17.2% | +14.1% |
| Gross Margin | N/A | 62.7% | 58.9% | 53.4% | 58.2% | 60.0% | 61.0% |
| Operating Margin | N/A | 11.6% | -3.1% | -28.3% | -9.0% | 2.0% | 8.0% |
| Net Income ($M) | N/A | 91.4 | -34.5 | -191.0 | -64.9 | 15.0 | 60.0 |
| Diluted EPS | N/A | $2.54 | -$1.09 | -$5.93 | -$1.98 | $0.45 | $1.80 |
2021 data unavailable in the provided dataset due to the I&A divestiture. 2026E and 2027E figures are analyst estimates based on current momentum and guidance.
The company experienced a severe cyclical downturn in 2023-2024, with revenue declining 45% from 2022 peak levels. The recovery began in 2025 with revenue growth of 34.3%, driven by inventory normalization and IoT demand recovery. Gross margins expanded 480 basis points in 2025 to 58.2% as revenue scaled. The trailing twelve-month P/E ratio is not meaningful due to negative earnings; the forward P/E stands at 50.0x based on 2026 estimates, reflecting expectations of a strong earnings recovery.
Cash Flow Analysis

View this table as text
| Metric ($M) | 2021 | 2022 | 2023 | 2024 | 2025 |
|---|---|---|---|---|---|
| Operating Cash Flow | N/A | N/A | -30.3 | -13.9 | 95.7 |
| Capital Expenditures | N/A | -26.5 | -22.3 | -11.7 | -29.9 |
| Free Cash Flow | N/A | 45.3 | -52.6 | -25.7 | 65.8 |
Operating cash flow for 2021-2022 partially estimated from free cash flow and capex data provided.
SLAB returned to positive free cash flow in 2025, generating $65.8M. The company’s operating cash flow of $95.7M in 2025 represents a significant inflection from the prior two years of negative cash generation. The company is now cash-flow positive and self-funding its R&D investments.
Risk and Catalyst Assessment
Risk Factors (Next 12 Months)
- Cyclical semiconductor downturn: The industry remains vulnerable to inventory corrections and demand softness in China, which represents a significant portion of revenue.
- Competitive pressure: Nordic Semiconductor, NXP, and STMicroelectronics are aggressively targeting the wireless MCU market, potentially pressuring margins.
- Customer concentration in distribution: Over-reliance on distributors creates channel inventory risk and potential order cancellations.
- Geopolitical tensions: Export controls on semiconductor technology to China could restrict market access.
- Execution risk on new product ramps: The transition to Matter protocol and Wi-Fi 6/7 products requires flawless execution to capture market share.
Catalysts (Next 12 Months)
- Matter protocol adoption: SLAB is a leading supplier of Matter-compliant wireless SoCs, positioning it to benefit from smart home standardization.
- Industrial IoT recovery: Smart metering and industrial automation demand is recovering, with multi-year design win pipelines converting to revenue.
- Gross margin expansion: As revenue scales toward $900M+, operating leverage should drive significant margin improvement.
- New product launches: Wi-Fi 6/7 combo solutions and next-gen Matter-enabled MCUs are expected to drive design win momentum.
- Potential share buybacks: With $397M in cash and no debt, the company has capacity to resume capital returns.
Competitive Landscape and Related Equities
| Competitor | Ticker | Market Focus | Estimated Market Share (Wireless MCU) |
|---|---|---|---|
| Nordic Semiconductor | NOD.OL | Bluetooth Low Energy, Wi-Fi | ~20% |
| NXP Semiconductors | NXPI | Automotive, IoT, MCUs | ~15% |
| STMicroelectronics | STM | Industrial, IoT, MCUs | ~15% |
| Texas Instruments | TXN | Industrial, Analog, MCUs | ~10% |
| Renesas Electronics | 6723.T | Automotive, Industrial | ~10% |
Market share figures are estimates based on industry reports and company disclosures.
Related equities frequently mentioned alongside SLAB include:
- Nordic Semiconductor (NOD.OL): Direct competitor in low-power wireless connectivity; both companies compete for Bluetooth and Matter design wins.
- NXP Semiconductors (NXPI): Larger diversified competitor with overlapping IoT and industrial MCU portfolios.
- Qorvo (QRVO): Competes in IoT connectivity solutions, though with a broader RF focus.
- Synaptics (SYNA): Fellow fabless IoT-focused company with similar margin profile and end-market exposure.
Investment Thesis
Bull Case
- SLAB is a pure-play IoT semiconductor leader with dominant positions in smart metering and home connectivity protocols (Zigbee, Z-Wave, Matter).
- The company has navigated a severe cyclical downturn and emerged with a leaner cost structure, positioning it for operating leverage as revenue recovers.
- With $397M in cash, zero debt, and a 5.4x current ratio, the balance sheet provides significant strategic flexibility for acquisitions or capital returns.
- Forward P/E of 50x appears expensive, but if the company achieves $1.80 EPS in 2027, the forward P/E compresses to 28x, with further upside potential.
- Matter protocol adoption and industrial IoT secular growth provide multi-year tailwinds.
Bear Case
- The stock trades at 50x forward earnings, pricing in a flawless recovery. Any miss on revenue or margin guidance could trigger significant multiple compression.
- Competition from larger players (NXP, TI, ST) with greater scale and R&D budgets could limit market share gains.
- China exposure (~40% of revenue) creates regulatory and geopolitical risk that is difficult to hedge.
- The company has negative return on equity (-3.6%) and has destroyed shareholder value over the past three years through the downturn.
- Short interest of 14.5% of float indicates meaningful bearish sentiment among sophisticated investors.
Capital Raising Activity
| Period | Activity | Amount |
|---|---|---|
| Last 6 Months (Feb-Aug 2026) | No equity or debt issuance; employee stock option exercises | $14.6M (from option exercises) |
| Last 6 Months (Feb-Aug 2026) | No share repurchases | $0 |
| Next 6 Months (Aug 2026-Feb 2027) | No planned capital raises; sufficient cash for operations and R&D | $0 (estimate) |
The company has not engaged in external capital raising activities in the past six months, relying on its substantial cash position to fund operations. With $397M in cash and positive free cash flow, SLAB is unlikely to need external financing in the near term. The company may resume its share repurchase program if the stock price remains depressed relative to its growth prospects, though no formal authorization is currently active.
Disclaimer: This report is for informational and educational purposes only and does not constitute investment advice. Data sourced from Yahoo Finance (as of August 15, 2026) and company filings; all estimates not explicitly sourced from the provided data are clearly labeled as such. The analysis may contain errors — always verify against primary filings (10-K/10-Q/8-K) before making any investment decision.
Discover more from CANSLIM Research
Subscribe to get the latest posts sent to your email.