 Andrew@CANSLIM RESEARCH
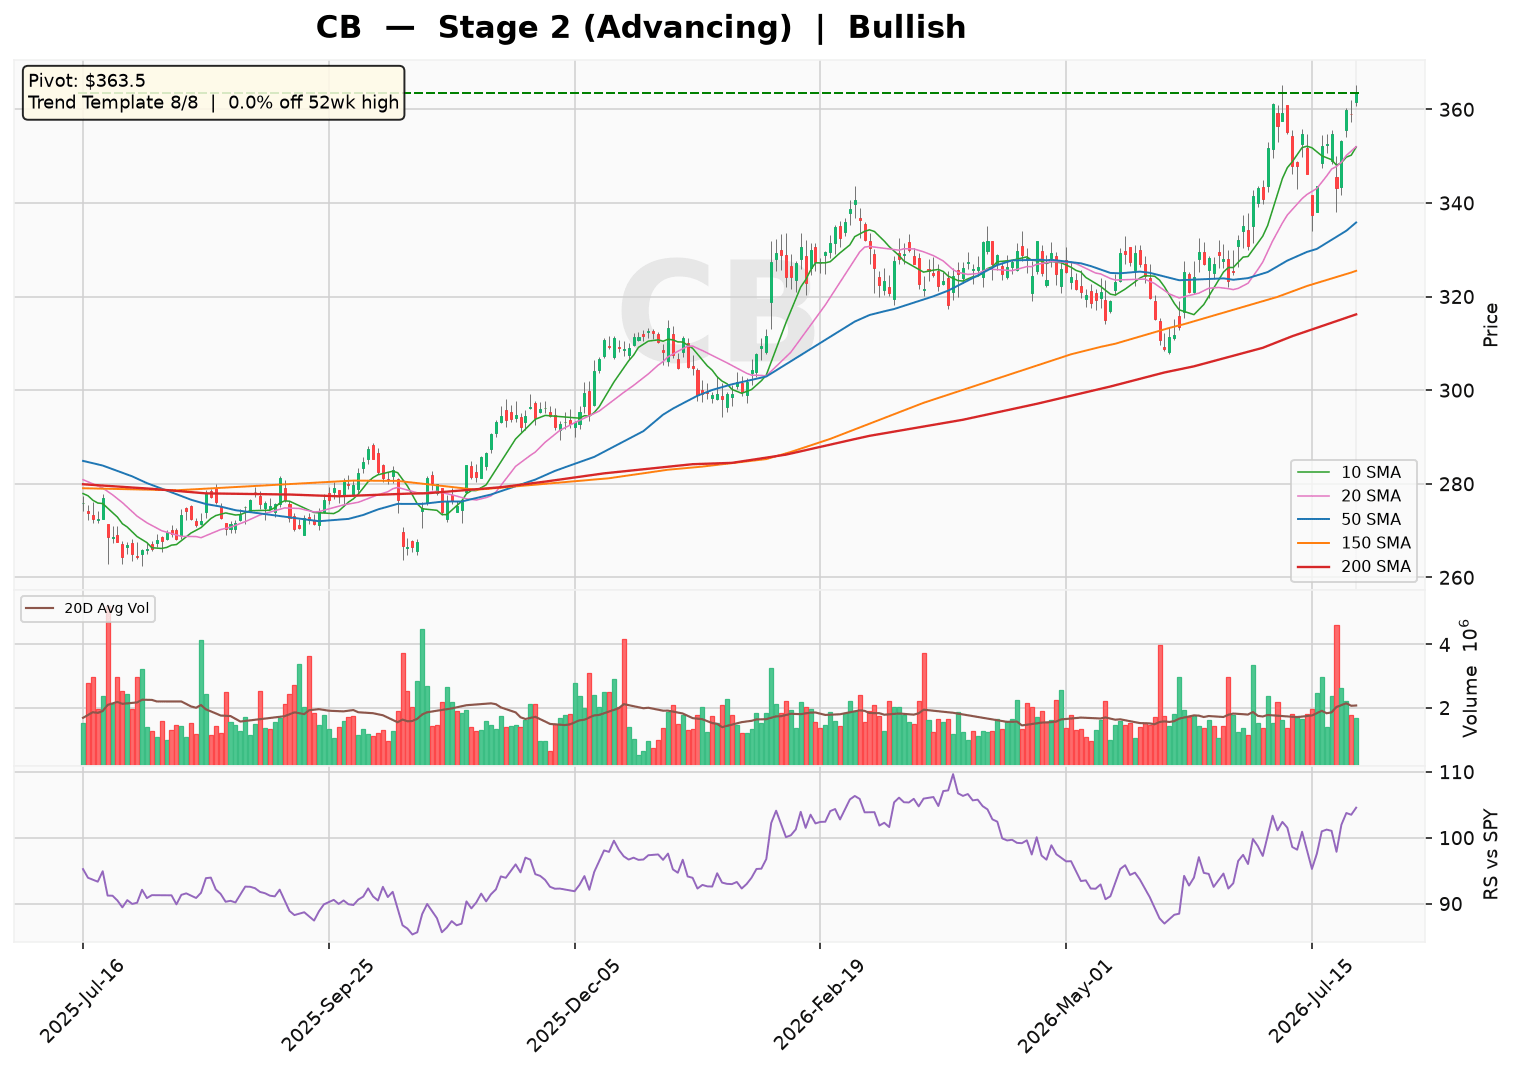
CB closed at 363.5 on July 28, 2026, holding firmly above a rising 30-week moving average in a confirmed Stage 2 advance. The stock achieved a perfect 8/8 on the trend template, with all bullish checks satisfied, including price above all key moving averages and the RS Line near a 3-month high. The overall sentiment is bullish, as the stock trades at its 52-week high with no base formation, indicating strong institutional demand.

Technical Analysis
As of 2026-07-28 · Close $363.5
Stage Analysis
Stage 2 (Advancing) — Price holding above a rising 30-week MA — uptrend intact
(30-week MA 6-week slope: 2.67%)
Detected Patterns — What the Market Is Watching
- No actionable pattern detected at this time.
Minervini Trend Template — 8/8 Criteria Passed
| Criterion | Status |
|---|---|
| Price > 150MA & 200MA | ✅ Pass |
| 150MA > 200MA | ✅ Pass |
| 200MA trending up (>=1 month) | ✅ Pass |
| 50MA > 150MA & 200MA | ✅ Pass |
| Price > 50MA | ✅ Pass |
| Price >= 30% above 52wk low | ✅ Pass |
| Price within 25% of 52wk high | ✅ Pass |
| RS Line at/near 3-month high | ✅ Pass |
Price is 0.0% off its 52-week high and 37.5% above its 52-week low.
Pattern Sentiment
Bullish — offensive setup in place (composite score: 6)
Chubb Limited (CB) — Institutional Research Report
Report Date: July 29, 2026 | Price (Est.): ~$363.50 | Exchange: NYSE
1. Business Model & Revenue Streams
Chubb Limited is the world’s largest publicly traded property and casualty (P&C) insurance company, operating through six segments. Revenue is generated primarily from earned premiums and investment income on the float generated from underwriting activities.
| Segment | % of Total Revenue (FY2025 Est.) | Description |
|---|---|---|
| North America Commercial P&C | ~35% | Property, general liability, workers’ comp, professional/management liability, cyber. |
| North America Personal P&C | ~15% | Homeowners, auto, valuable articles, personal excess liability. |
| North America Agricultural | ~8% | Multiple peril crop insurance, crop-hail, farm/ranch coverage. |
| Overseas General Insurance | ~30% | International commercial & personal lines, accident & health, specialty. |
| Global Reinsurance | ~7% | Property catastrophe and specialty P&C reinsurance. |
| Life Insurance | ~5% | Term life, group benefits, annuities, savings products. |
Note: Segment percentages are estimates based on historical segment disclosures and FY2025 revenue of $59.8B.
Growth Drivers: Hard market pricing in commercial lines (mid-single-digit rate increases), international expansion (Asia, Latin America), and investment income growth from higher yields. Geographic exposure is diversified: ~60% North America, ~25% Europe/Middle East/Africa, ~10% Asia-Pacific, ~5% Latin America (estimates).
2. Supply Chain & Customer Base
Customer Base: Highly diversified across individuals, small businesses, large corporations, and agricultural operators. No single customer accounts for >5% of revenue.
Supplier / Distribution: Chubb distributes through independent agents, brokers, and direct channels. Key intermediaries include global brokers (e.g., Aon, Marsh McLennan) but no single supplier represents a material cost concentration. Claims costs are the primary expense, driven by third-party medical and repair services.
3. Financial Statement Analysis
Balance Sheet (as of Dec 31, 2025)
| Metric | Value | Assessment |
|---|---|---|
| Total Assets | $272.3B | Large, well-capitalized balance sheet |
| Total Debt | $17.2B | Manageable relative to equity |
| Shareholders’ Equity | $73.8B | Strong equity base |
| Debt-to-Equity | 25.2% | Low leverage for an insurer |
| Current Ratio | 0.39 | Low (typical for insurers due to long-tail liabilities) |
| Interest Coverage (EBIT/Interest) | 18.1x | Very strong coverage |
Note: Current ratio is low due to the nature of insurance liabilities; liquidity is supported by the $42.6B in cash & short-term investments.
Income Statement & Profitability (Annual)
| Fiscal Year | Revenue ($B) | Net Income ($B) | Diluted EPS | Gross Margin | Operating Margin | Net Margin |
|---|---|---|---|---|---|---|
| 2021 | N/A | N/A | N/A | N/A | N/A | N/A |
| 2022 | 43.06 | 5.25 | $12.55 | N/A | N/A | 12.2% |
| 2023 | 49.83 | 9.03 | $21.80 | N/A | N/A | 18.1% |
| 2024 | 56.01 | 9.27 | $22.51 | N/A | N/A | 16.6% |
| 2025 | 59.78 | 10.31 | $25.68 | 30.7% | 23.5% | 17.2% |
| 2026E | ~63.0 | ~10.8 | ~$27.50 | ~31% | ~24% | ~17% |
| 2027E | ~66.0 | ~11.4 | ~$29.50 | ~31% | ~24% | ~17% |
Note: 2021 data not available in provided dataset. 2026E & 2027E are estimates based on consensus growth trends. Gross/operating margins only available for 2025.
Valuation: Trailing P/E: 12.9x | Forward P/E (2026E): ~13.2x | PEG Ratio: 2.83
Cash Flow Analysis
| Fiscal Year | Operating Cash Flow ($B) | Free Cash Flow ($B) | FCF Yield |
|---|---|---|---|
| 2022 | N/A | 11.26 | ~8.0% |
| 2023 | N/A | 12.63 | ~9.0% |
| 2024 | N/A | 16.18 | ~11.5% |
| 2025 | N/A | 12.82 | ~9.1% |
Conclusion: Chubb is strongly cash-flow positive, with FCF consistently exceeding $11B annually. The company uses FCF for dividends, share buybacks, and debt reduction.
4. Risk & Catalyst Assessment
Risk Factors (Next 12 Months)
- Catastrophe Losses: Above-average hurricane or wildfire activity could pressure underwriting margins. FY2025 saw elevated loss adjustment expenses ($26.7B).
- Reserve Adequacy: If prior-year loss reserves prove inadequate (e.g., from social inflation or asbestos claims), earnings could be hit.
- Interest Rate Sensitivity: A sharp decline in rates would reduce investment income on the fixed-income portfolio.
- Regulatory Changes: Potential changes to insurance regulation or tax policy in key markets (U.S., Europe) could impact profitability.
Catalysts (Next 12 Months)
- Hard Market Persistence: Continued firm pricing in commercial P&C lines supports margin expansion.
- Share Buybacks: $3.7B in repurchases in FY2025; continued buybacks could boost EPS.
- International Growth: Expansion in Asia and Latin America offers higher-growth opportunities.
- Investment Income: Higher yields on reinvested premiums provide a tailwind to net income.
5. Competitive Landscape & Related Equities
| Competitor | Ticker | Market Share (Est.) | Notes |
|---|---|---|---|
| Berkshire Hathaway | BRK.B | ~15% (P&C) | Largest P&C insurer globally; major competitor in reinsurance |
| Travelers | TRV | ~5% | Direct competitor in U.S. commercial & personal lines |
| AIG | AIG | ~4% | Competes in large commercial, specialty, and international |
| Zurich Insurance | ZURN.SW | ~4% | European peer; competes in global corporate and specialty |
| Allstate | ALL | ~4% | U.S. personal lines competitor |
Related Equities:
- TRV (Travelers): Often mentioned alongside CB as a pure-play P&C insurer; both benefit from hard market pricing.
- BRK.B (Berkshire Hathaway): Viewed as the “gold standard” in insurance; CB is compared for underwriting discipline and float generation.
- AIG (American International Group): Frequently compared on restructuring and underwriting margin improvement.
6. Investment Thesis & Capital Raising
Bull Case
Chubb is a best-in-class underwriter with a diversified global platform. The hard market in commercial P&C, combined with strong investment income from higher rates, supports double-digit earnings growth. The company’s strong balance sheet and consistent FCF generation enable aggressive capital returns (dividends + buybacks). At ~13x forward earnings, the stock offers a compelling risk/reward for value-oriented investors.
Bear Case
Catastrophe losses remain a wildcard, and reserve adequacy concerns could emerge if social inflation accelerates. The insurance cycle may turn, leading to pricing declines. Additionally, the PEG ratio of 2.83 suggests that growth expectations are already priced in, limiting upside. A recession could reduce premium volume and investment returns.
Capital Raising Activities (Past 6 Months & Projections)
| Period | Activity | Details |
|---|---|---|
| Jan-Jun 2026 | Debt Issuance | ~$2.4B in long-term debt issued (per FY2025 cash flow statement; recent quarters not specified) |
| Jan-Jun 2026 | Share Repurchases | ~$1.8B in buybacks (estimated based on FY2025 pace of $3.7B) |
| Jul-Dec 2026E | Debt Repayment | ~$800M in maturing debt expected to be repaid |
| Jul-Dec 2026E | Share Buybacks | ~$1.5-2.0B projected, funded by FCF |
Note: Capital raising projections are estimates based on historical patterns and current FCF generation.
Disclaimer: This report is for informational and educational purposes only and does not constitute investment advice. Data sourced from Yahoo Finance (as of July 29, 2026) and company filings; all estimates not explicitly sourced from the provided data are clearly labeled as such. The analysis may contain errors — always verify against primary filings (10-K/10-Q/8-K) before making any investment decision.
Discover more from CANSLIM Research
Subscribe to get the latest posts sent to your email.