 Andrew
General educational commentary only, generated automatically with AI. Not investment advice or a recommendation to buy, sell or hold any security. Capital is at risk.
Tech Shares Slip as Nvidia Uncertainty Weighs on Futures
US stock futures traded lower ahead of inflation data, with technology shares under pressure after a leadership shock at Nvidia. The Wall Street Journal reported the futures move. CNBC and other outlets tied the tech weakness to uncertainty around the company and to crowded AI trades. The brief describes sentiment as bearish.
The same risk-off tone appeared elsewhere. Bitcoin fell below $70,000, according to The Wall Street Journal, as investors pulled back from speculative assets. One reading is that crypto and high-multiple tech shares are being treated as similar risk exposures by some participants. That is interpretation, not a reported fact.
Treasury Yields Rise as Rate Expectations Shift
CNBC reported that Treasury yields rose as traders increased bets on a possible Fed hike. Fed officials said inflation remains too high. French inflation reached 3.7% in October, the brief notes. CNBC also reported that the Fed had expected rate cuts this year and is now bracing for another inflation fight.
Higher yields raise the bar for stock valuations, especially for growth shares. This is a common framing in the source material. The brief lists it as a bearish factor. The next test is US inflation data, which could shift rate expectations and shape whether yields keep climbing.
European Funds Draw Demand as US Tech Loses Ground
Reuters reported that US tech pain has been a gain for European stock markets. Reuters also reported that demand for European funds helped push global equity fund inflows to a seven-week high. The brief calls this a rotation rather than a wholesale exit from equities.
One reading is that money is looking beyond US technology leaders. This may suggest a broadening of participation rather than a full retreat. It is uncertain whether the pattern persists. The source does not give figures for the inflows beyond the seven-week reference.
Oil Supply Moves above Demand after Russian Rebound
CNBC reported that the IEA said global oil supply moved above demand in October as Russian output rebounded. The brief notes that a sustained surplus could ease energy-price pressure. That would matter for the inflation picture and for rate expectations.
The source does not say how long a surplus might last. It also does not give a size for the surplus. The item is listed as bullish in the brief, but it is conditional on the surplus persisting.
Earnings Beats Normalize While Online Sentiment Stays Cautious
MarketWatch reported that Citi strategists see profit surprises normalizing and argue this may signal a healthier stock market. The brief says earnings beats are still common but less dramatic than in recent quarters. Strategists cited in the source say the market may absorb slower growth if leadership broadens.
Online sentiment, based on unverified posts by anonymous retail users, has leaned cautious on growth and AI-themed trades, according to those posts. This material may include rumour or speculation and has not been checked. It is not institutional flow or confirmed positioning. The brief's bearish label is consistent with that tone, but the two are separate inputs.
Chart Screen Flags Nasdaq Weakness on Several Measures
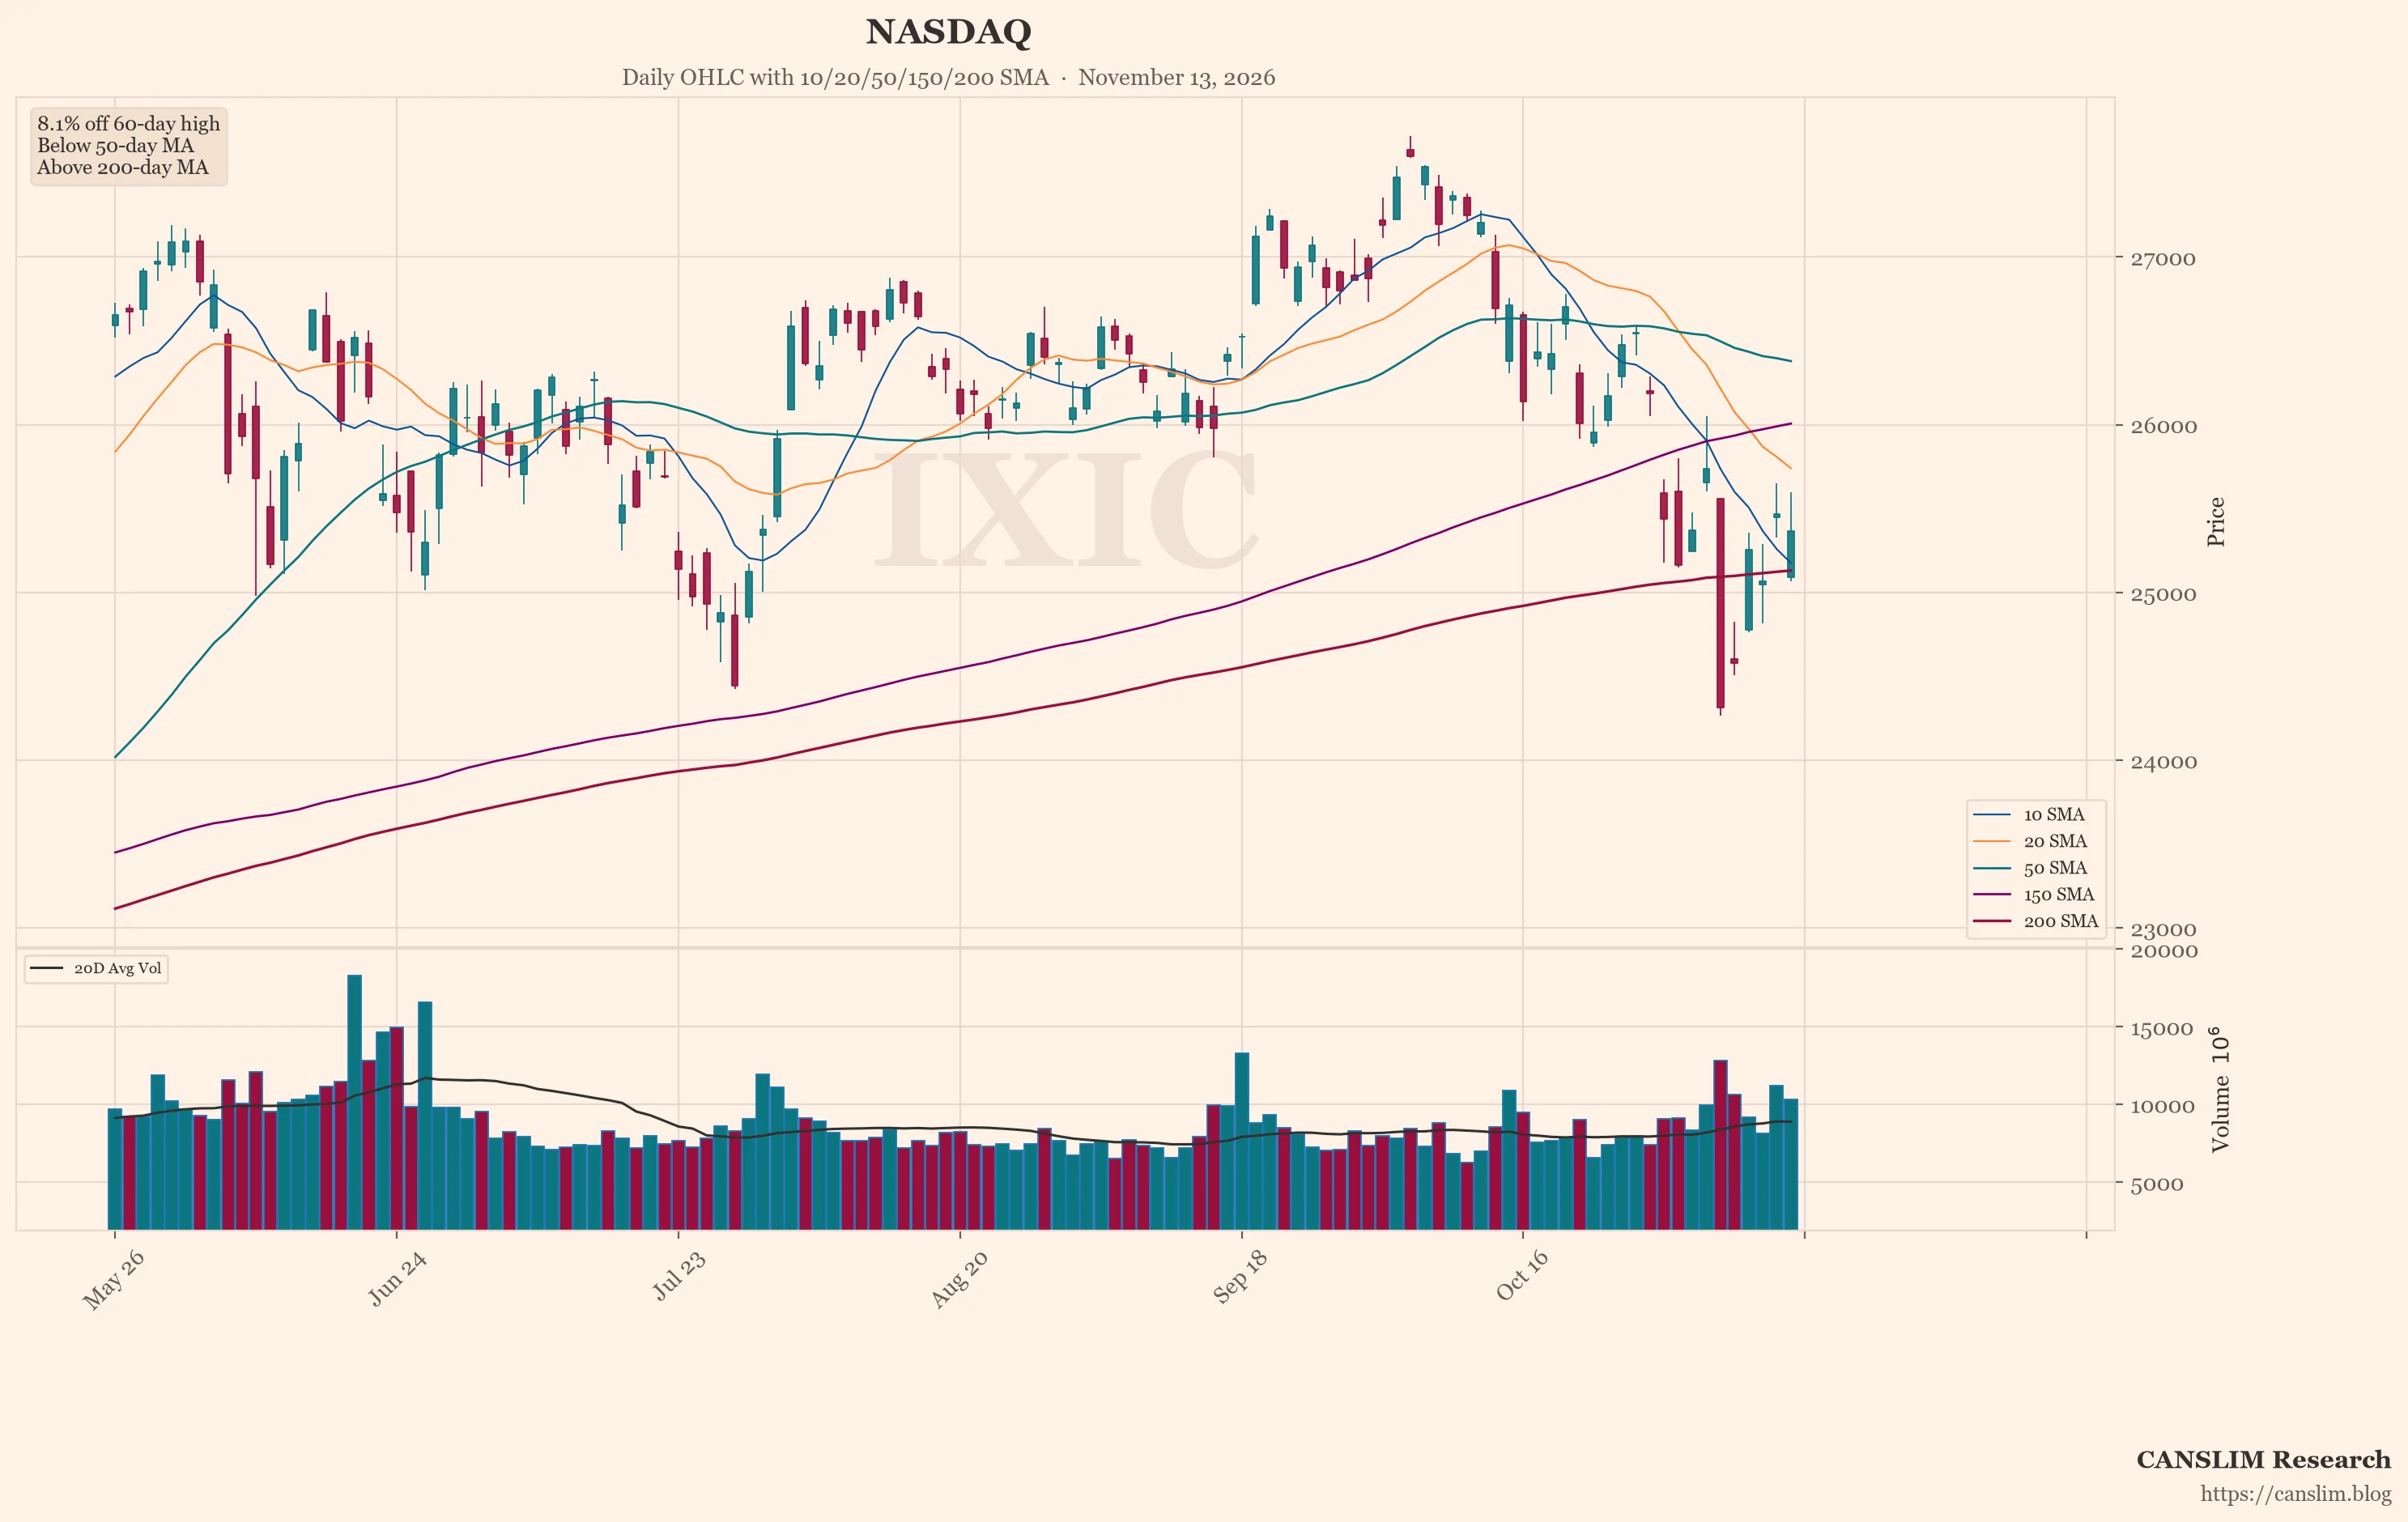
The featured chart shows the Nasdaq Composite (^IXIC). An automated technical screen selected it because, among the indices and stocks it checked, it showed the most weakness on a few measures. These were distance from its recent high, position versus its 50-day and 200-day moving averages, and down days on higher volume.
This is one screen, not a full view of the market. Past price patterns do not predict future results. The reading is factual and does not imply anything about the index's prospects.
Mixed Signals Leave Direction Dependent on Inflation Data
Conditions are mixed. Tech shares are under pressure, yields are higher, and rate expectations have shifted. European funds are drawing demand, oil supply has moved above demand, and earnings beats continue at a more normal pace. Online sentiment among anonymous retail users leans cautious on growth themes, though such posts are unverified.
The main uncertainty is inflation data and the bond market's response. A hot reading could keep pressure on valuations. A softer one could ease it. Breadth, leadership and volume patterns remain worth tracking as descriptions of what has happened. Risks include crowded AI trades, rising yields and a rotation that may or may not broaden.
Sources: a third-party AI-generated market news summary, and an AI summary of unverified posts by anonymous retail users online. This article was written by an AI language model from those summaries and published automatically without human review. Updated 2026-11-13 22:00 HKT.
CANSLIM Research (canslim.blog) is an independent educational publisher. It is not licensed or registered as a broker, investment adviser, research analyst or asset manager in any jurisdiction. This article is general information for education only. It is not investment advice, a research report, an investment recommendation, or an offer or solicitation to buy or sell any security, and it does not consider any reader's objectives, financial situation or needs. No ticker, chart, heading or technical comment is a suggestion to buy, sell, hold or short. Figures come from third-party sources, are not independently verified, and may be incomplete, out of date or wrong. Online sentiment may include rumour, speculation or coordinated posting. Past performance and past price patterns do not predict future results. Investing involves risk, including the loss of capital. This article is not updated after publication. Laws differ by country; seek advice from a licensed professional in your jurisdiction before making any investment decision.


