 Andrew
General educational commentary only, generated automatically with AI. Not investment advice or a recommendation to buy, sell or hold any security. Capital is at risk.
Technology Shares Remain under Pressure after Midterm Selloff
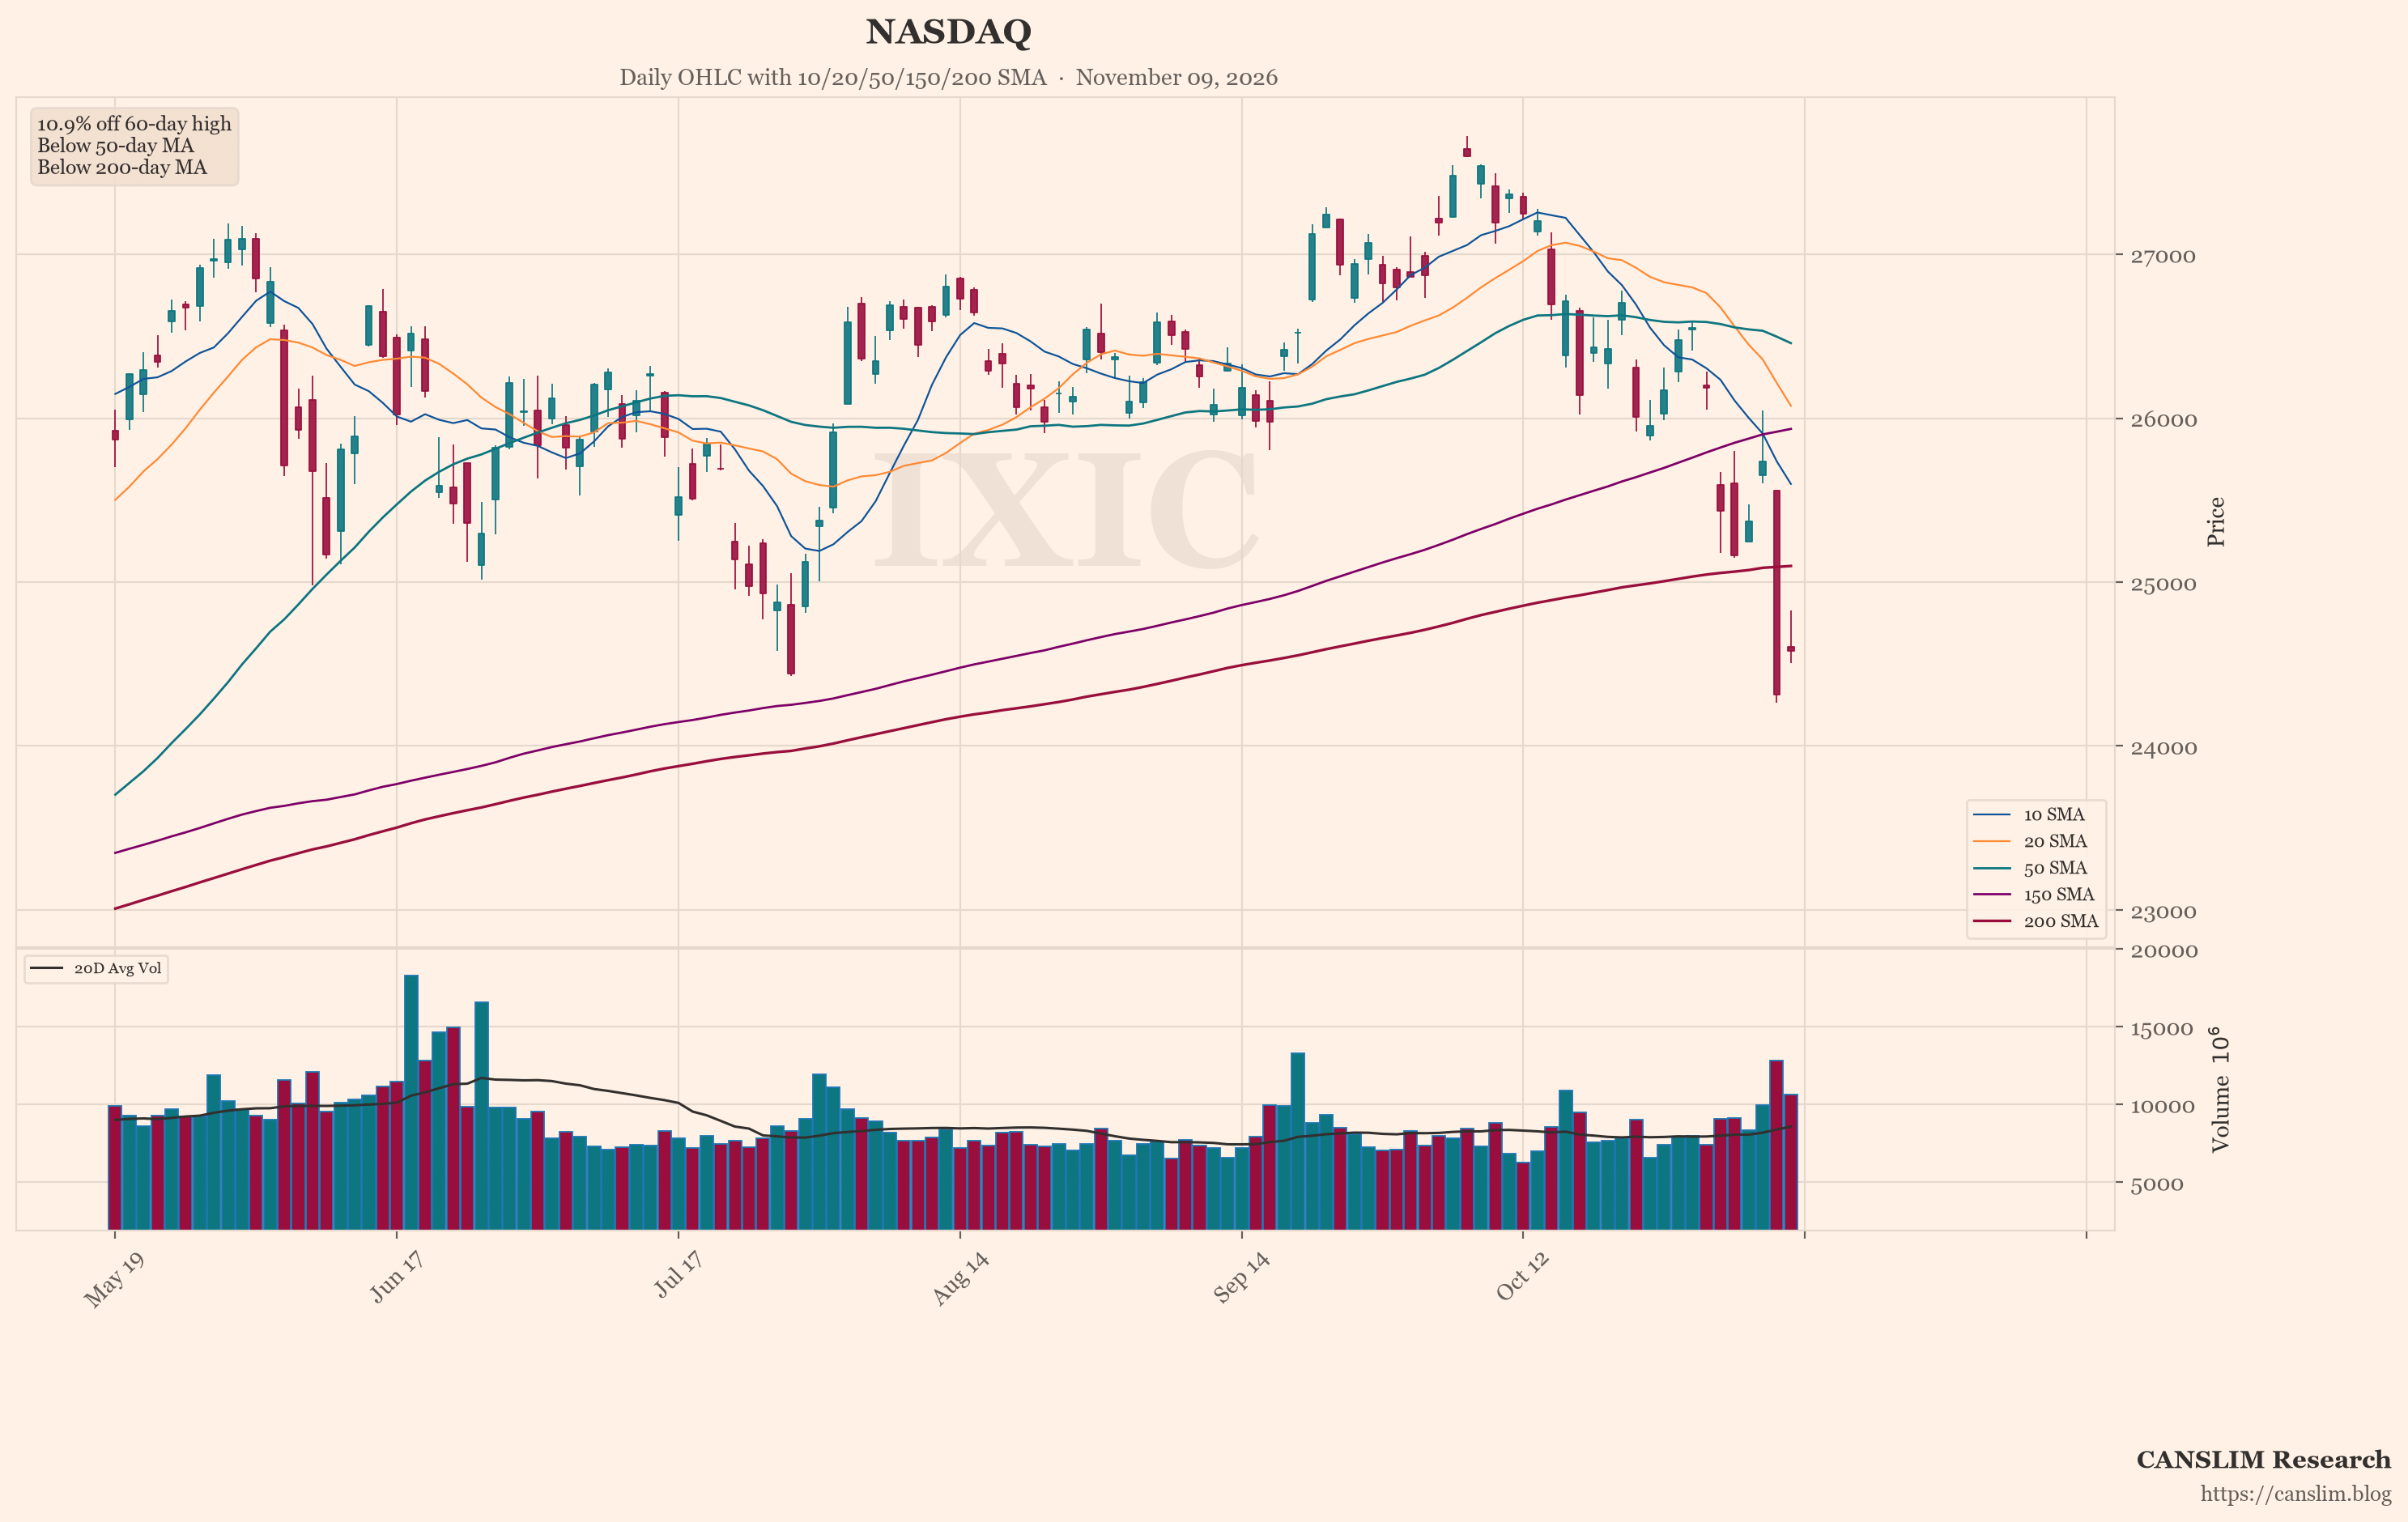
U.S. stocks enter the week on weak footing. A sharp selloff followed the midterm elections, and technology and AI-linked shares led the decline. The Nasdaq remained in correction territory after Friday’s partial rebound, according to the market brief. Investors are asking whether political pushback could slow data-center construction and AI spending. Concerns about credit conditions and stretched valuations added to the strain.
Earnings Cushion Thins as Beats Narrow
S&P 500 companies are mostly beating estimates, the brief reports. But the margin of those beats is the narrowest in roughly four years, according to MarketWatch. One reading is that the earnings cushion under high valuations has become thin. Friday’s stronger-than-expected jobs data and a rebound in some tech names offered limited relief. They did not reverse the broader downturn.
Inflation Reports Could Reset Rate Expectations
October CPI and PPI are due this week. FXEmpire describes the period as a test for a fragile stock market. The brief says these reports could reset rate expectations. CoreWeave, Cisco and Applied Materials are also set to report. Their results may show whether concern about data-center investment is reaching business outlooks, not just share prices. The brief notes that evidence of actual project delays would matter more than repricing alone.
Overseas Data Complicate the Inflation Picture
China’s factory-gate inflation rose to 5.7%, above expectations, CNBC reports. Its consumer inflation measure slowed at the same time. The brief calls this split complicating for the global inflation picture. Oil eased after comments reduced the likelihood of fresh U.S. attacks on Iran, Reuters reports. Middle East tensions still leave room for sharp price swings. Japan spent a record $50 billion in a single day to support the yen, The Wall Street Journal reports. The brief says this highlights foreign-exchange risk.
Online Sentiment Skews Cautious on Growth Themes
Online sentiment is cautious toward technology and AI-related themes, based on unverified posts by anonymous retail users. These posts may include rumour or speculation and have not been checked. They are not a measure of institutional flow or confirmed positioning. Some posts question whether AI spending plans will hold. Others focus on rate uncertainty ahead of the inflation reports. This may suggest retail attention is fixed on the same questions the news brief raises. It does not confirm any view or direction.
Chart Screen Flags Nasdaq Weakness on Several Measures
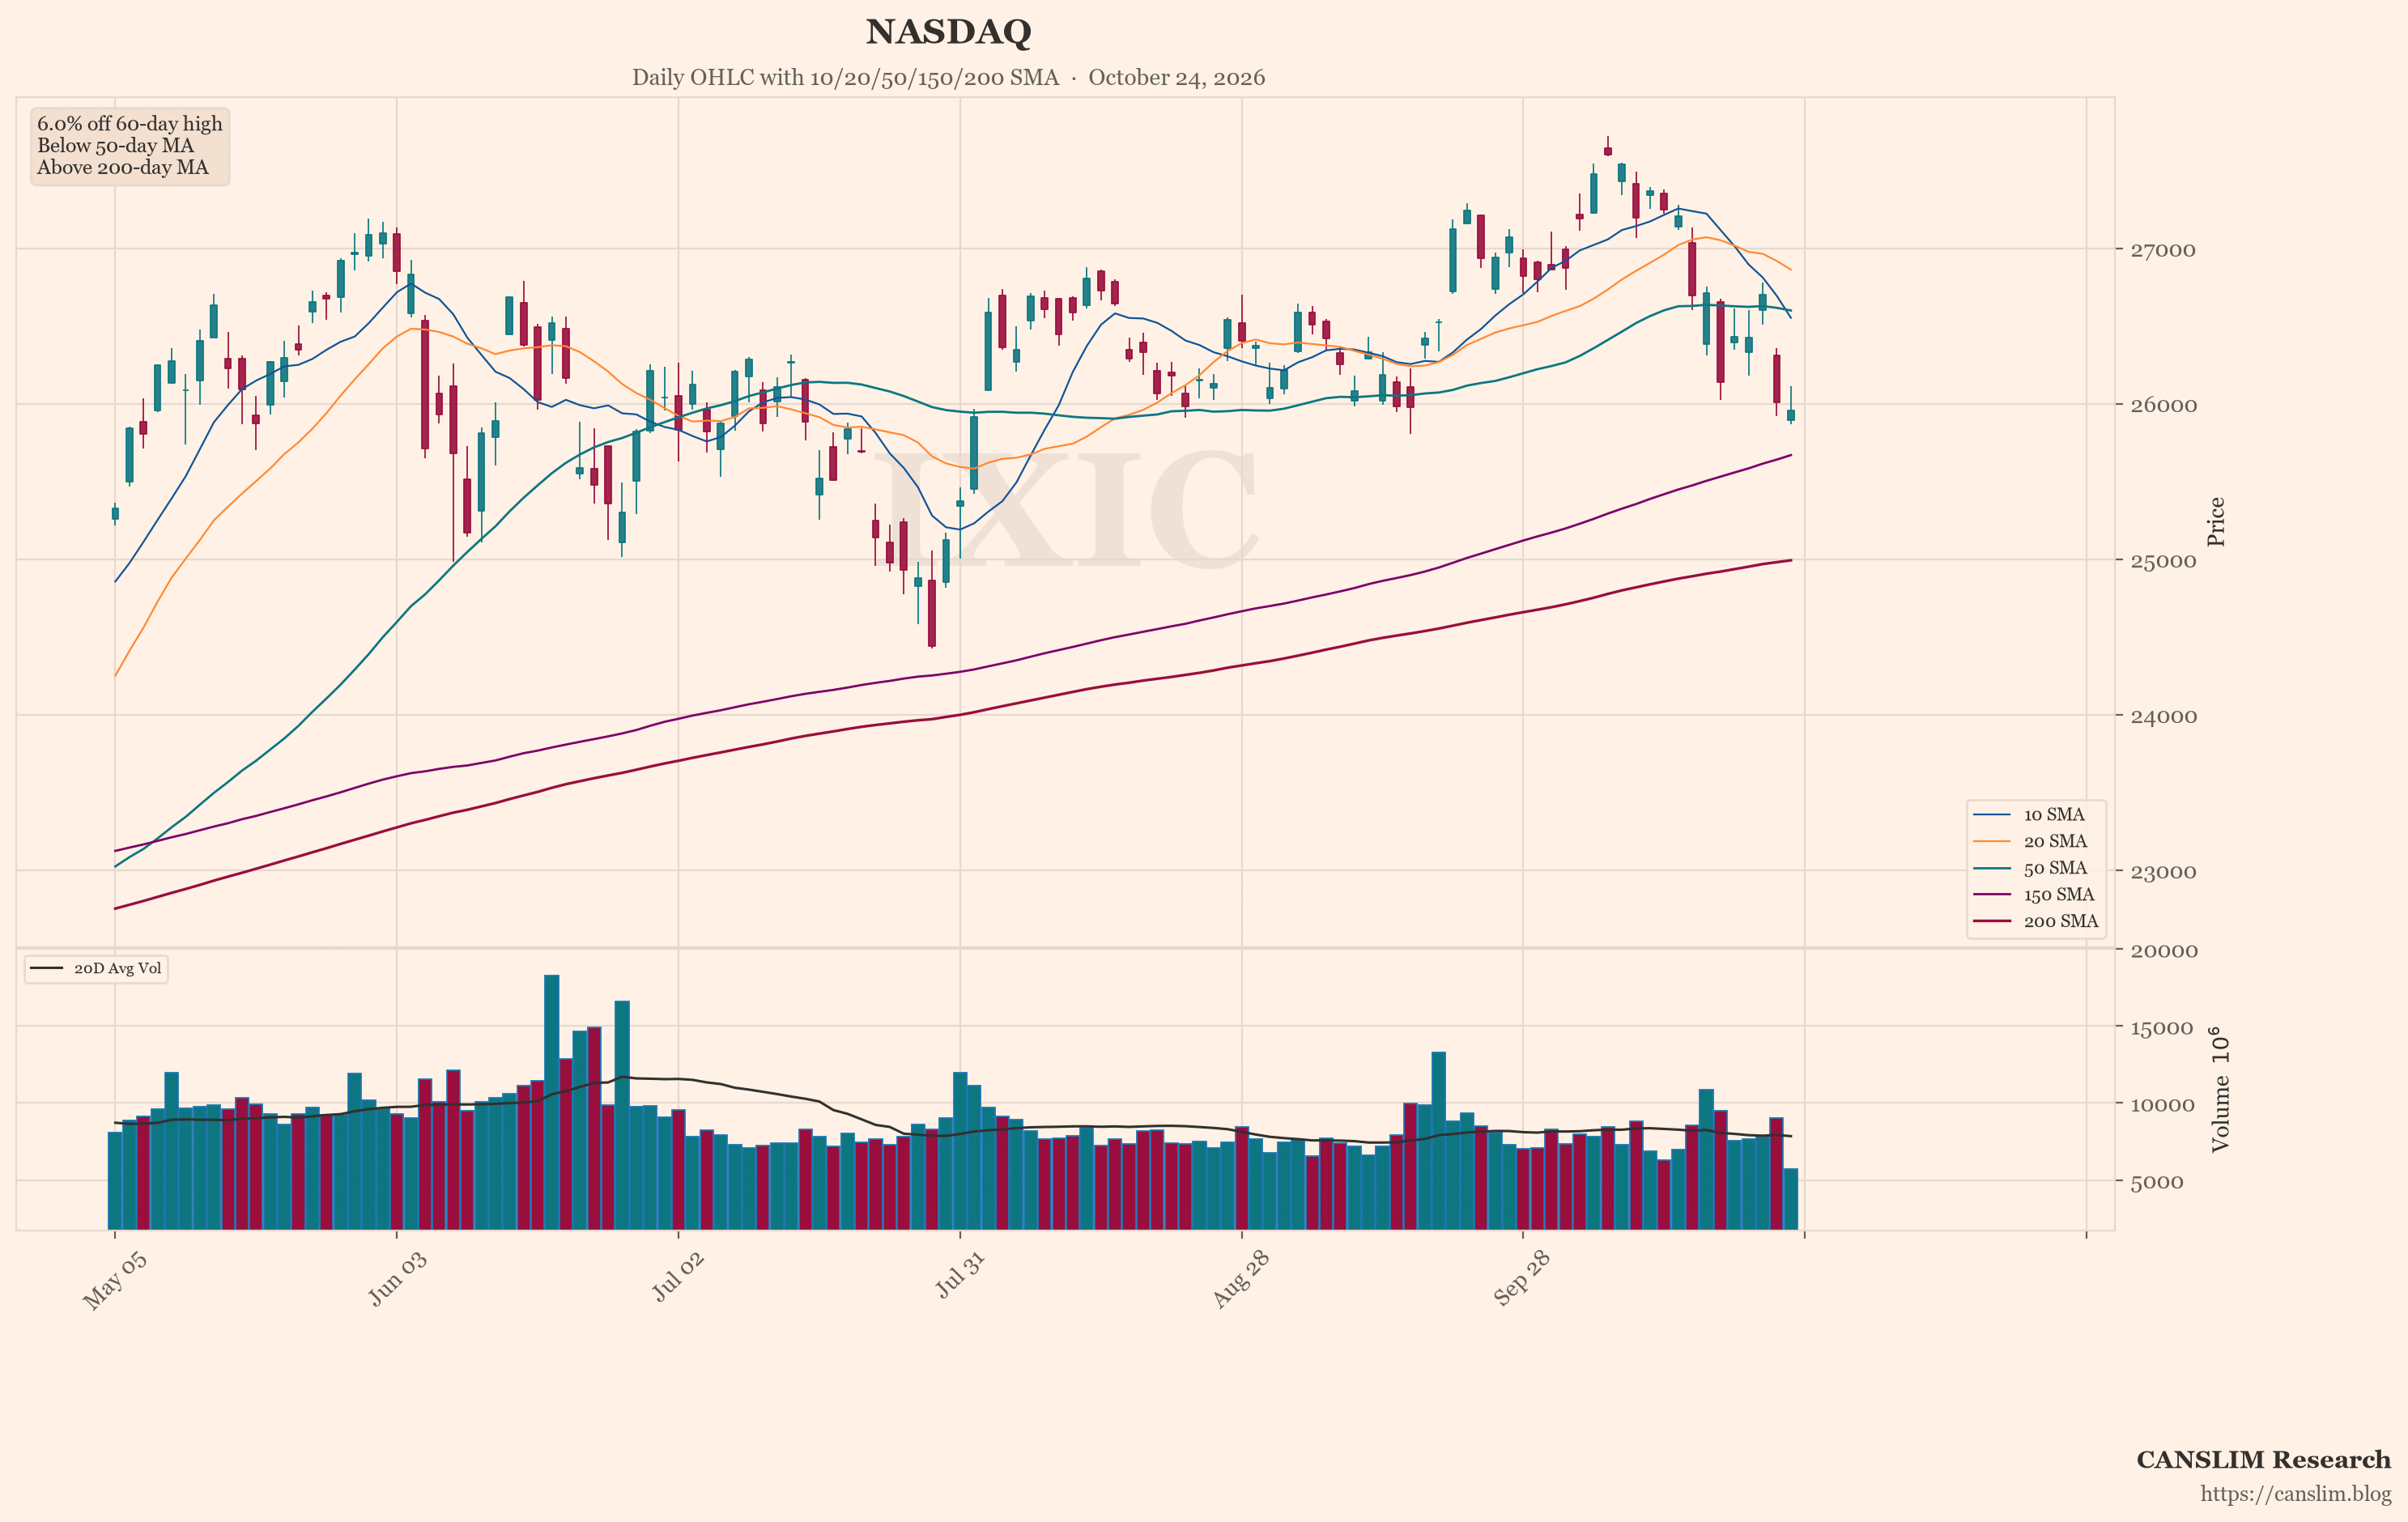
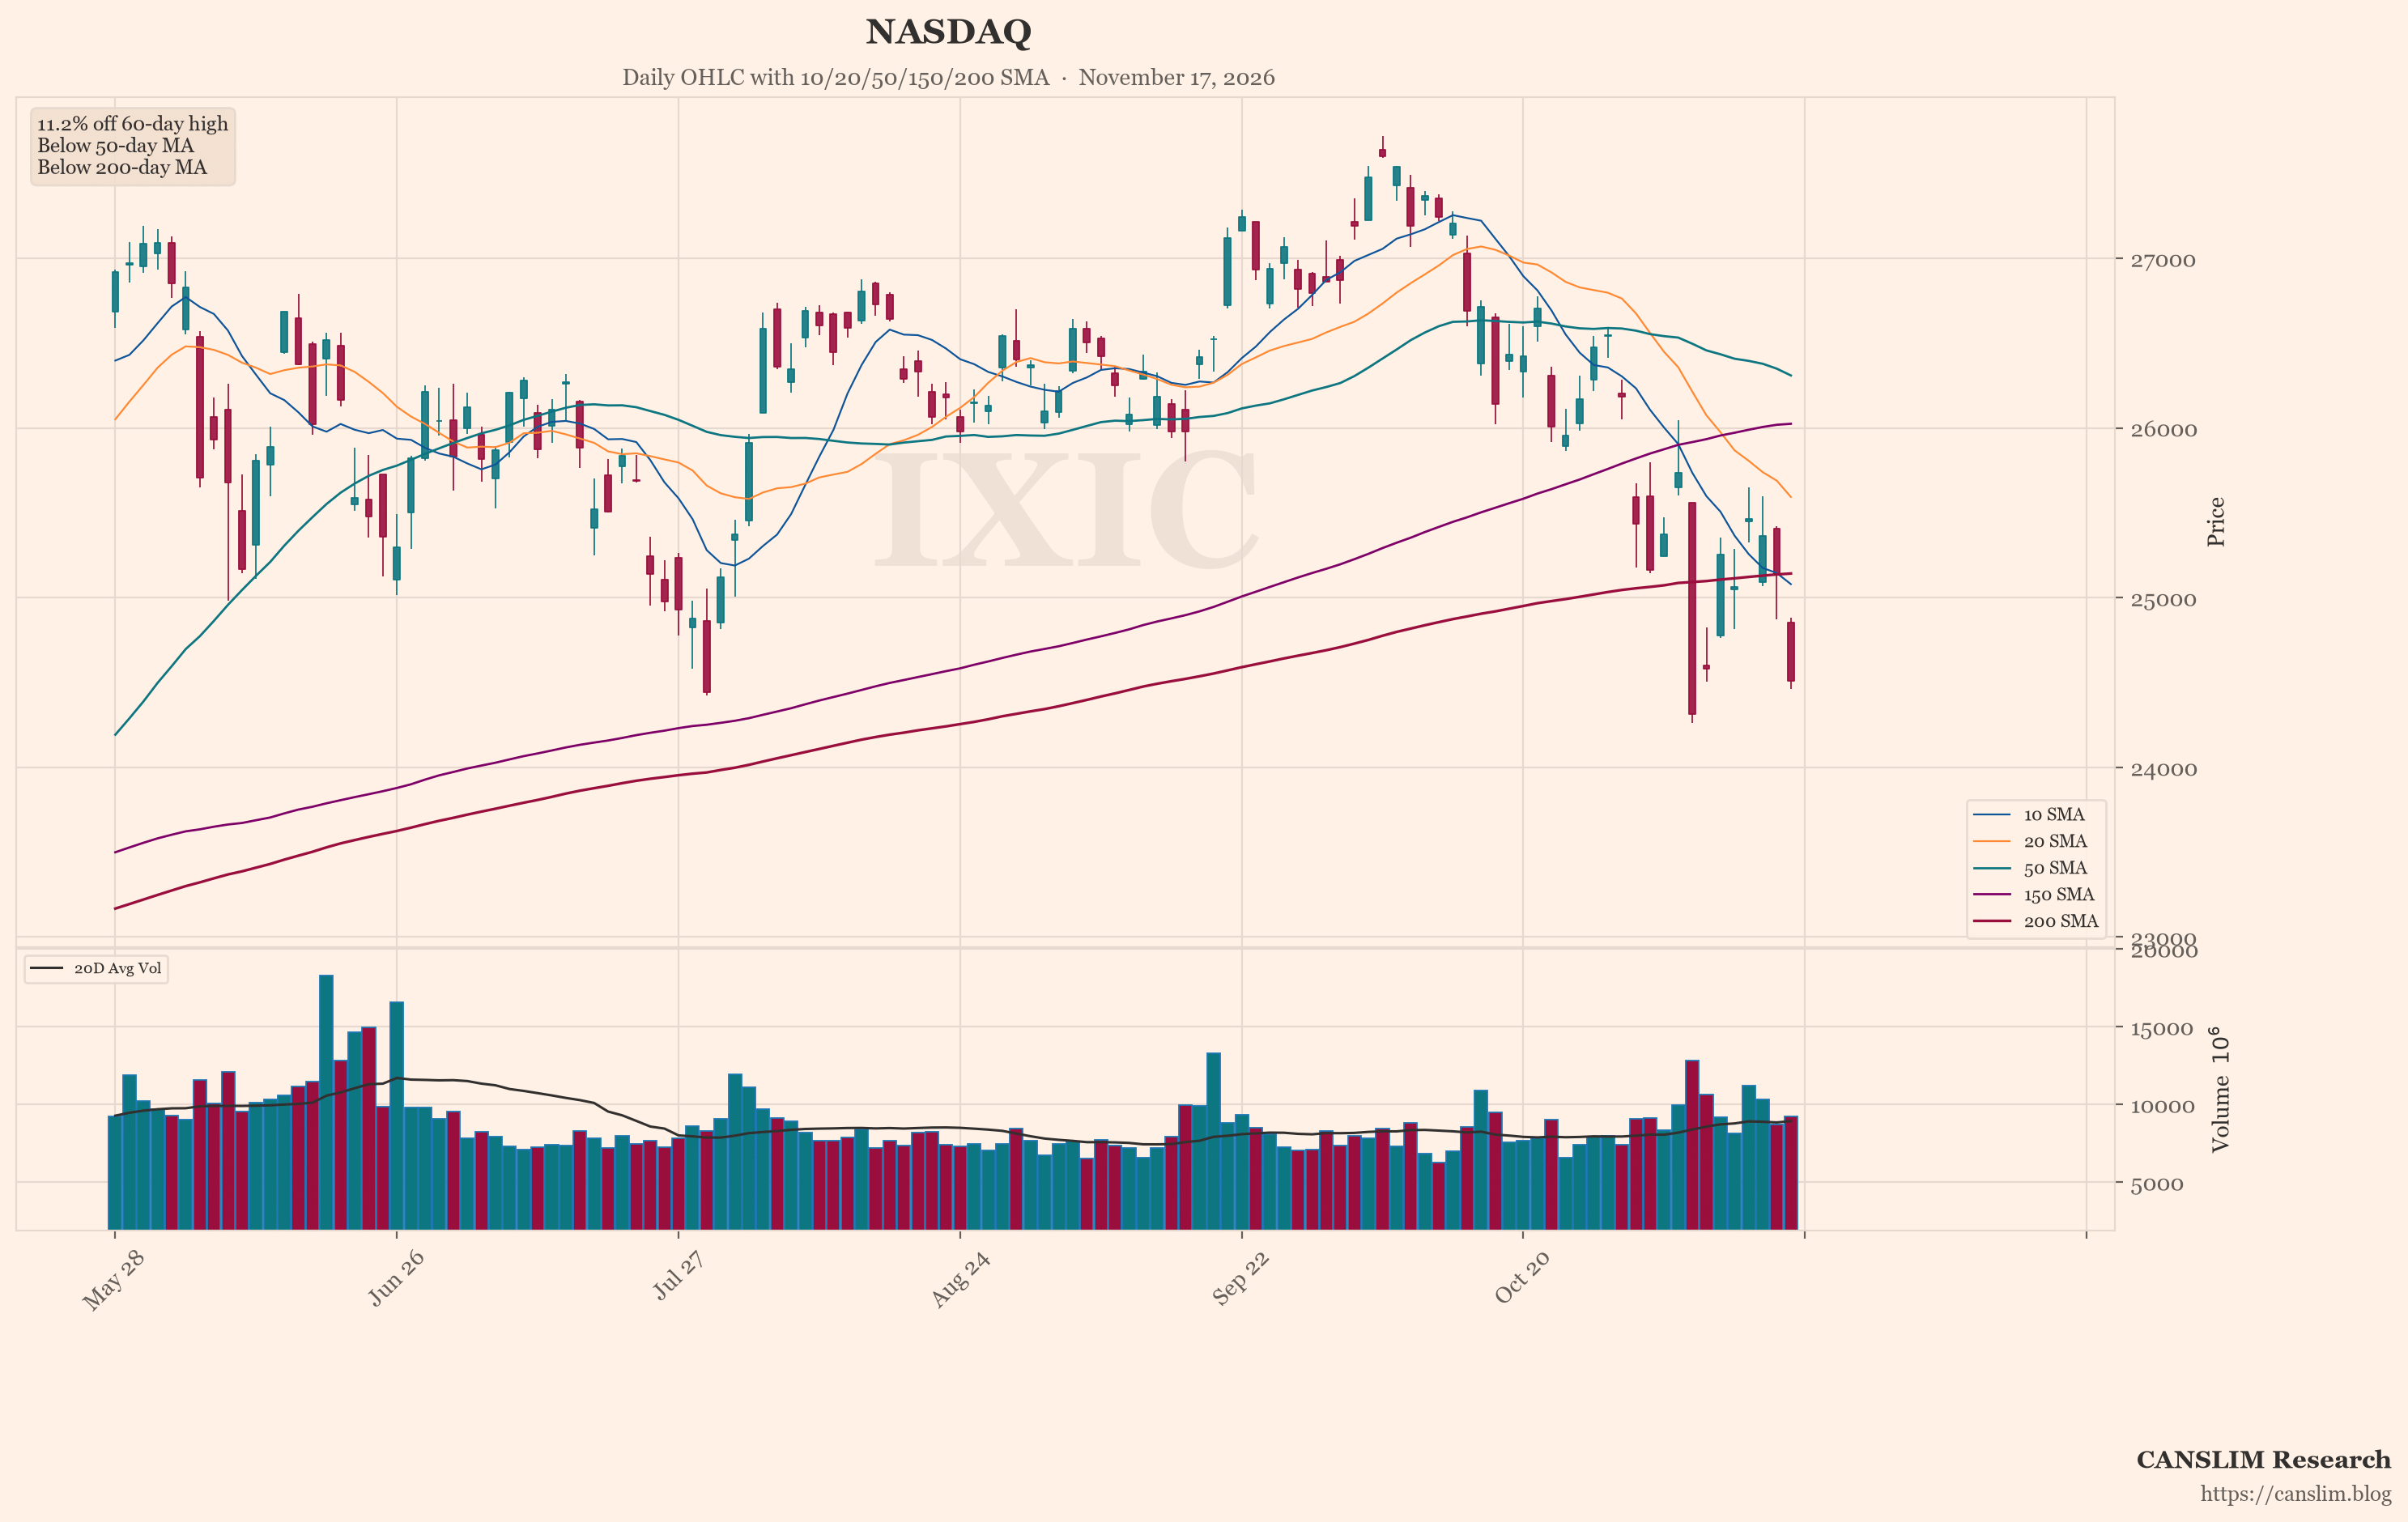
The featured chart shows the Nasdaq (^IXIC). An automated technical screen selected it because, among the indices and stocks it checked, it showed the most weakness on several measures. These were distance from its recent high, position versus its 50-day and 200-day moving averages, and down days on higher volume. One screen is not a full view of the market. Past price patterns do not predict future results.
A Market Testing Valuations against Uncertain Events
Conditions this week rest on several unresolved items. Inflation data could shift rate expectations. AI-infrastructure earnings could confirm or ease doubts about data-center spending. The earnings beat margin is narrow, and the Nasdaq remains in correction territory. Overseas, China’s split inflation data, oil’s move on Iran comments and Japan’s yen intervention add crosscurrents. Online sentiment leans cautious, but it is unverified and should be treated as such. The direction of valuations, spending plans and policy remains uncertain.
Sources: a third-party AI-generated market news summary, and an AI summary of unverified posts by anonymous retail users online. This article was written by an AI language model from those summaries and published automatically without human review. Updated 2026-11-09 14:00 HKT.
CANSLIM Research (canslim.blog) is an independent educational publisher. It is not licensed or registered as a broker, investment adviser, research analyst or asset manager in any jurisdiction. This article is general information for education only. It is not investment advice, a research report, an investment recommendation, or an offer or solicitation to buy or sell any security, and it does not consider any reader's objectives, financial situation or needs. No ticker, chart, heading or technical comment is a suggestion to buy, sell, hold or short. Figures come from third-party sources, are not independently verified, and may be incomplete, out of date or wrong. Online sentiment may include rumour, speculation or coordinated posting. Past performance and past price patterns do not predict future results. Investing involves risk, including the loss of capital. This article is not updated after publication. Laws differ by country; seek advice from a licensed professional in your jurisdiction before making any investment decision.