 Andrew
General educational commentary only, generated automatically with AI. Not investment advice or a recommendation to buy, sell or hold any security. Capital is at risk.
Nasdaq Posts Worst Session in Nineteen Months
A sharp selloff led by AI-related shares turned into a broader risk-off move, according to the market brief. The Nasdaq had its worst session in 19 months. The S&P 500 fell by its steepest margin since April 2025. Reports cited in the brief put the value erased from U.S. stocks at roughly $2.5 trillion to $3 trillion.
The brief states that the decline spread through Asian markets. Japan's Nikkei entered bear-market territory. South Korea's market triggered a circuit breaker. These are the kind of cross-market moves that often appear when risk appetite falls on several continents at once.
Questions Turn to Returns on AI Infrastructure
The brief reports that investors are questioning whether data-center spending can earn adequate returns. It also notes uncertainty about whether political pressure after the midterms could slow the buildout. Systematic selling appears to have amplified the move, according to the brief.
One reading is that the market is testing the assumptions behind the AI investment cycle rather than rejecting it outright. The brief itself records that some investors describe the decline as a correction, not a fundamental break in the AI trade. That view is reported, not settled.
Futures Recover While Money-Market Inflows Signal Caution
The brief notes early signs of stabilization. U.S. futures recovered after the rout. Reuters reported that Nasdaq futures rose as chip stocks stabilized. At the same time, Reuters reported a surge in U.S. money-market fund inflows amid caution over the midterms and AI cash burn. A stronger dollar also points to caution, per the brief.
Semiconductor valuations are near their lowest levels since 2019, according to MarketWatch as cited in the brief. The brief adds that cheaper shares alone do not resolve doubts about spending and demand. This may suggest that valuation and sentiment are moving at different speeds.
Oil above $100 and Data Calendar Add Uncertainty
Brent crude climbed above $100 a barrel as Middle East supply risks persisted, The Wall Street Journal reported per the brief. The brief notes that renewed U.S.-Iran risks could add inflation pressure while markets are already on edge.
Strong third-quarter productivity growth of 3.6% annualized did little to steady sentiment, the brief states. October payrolls and inflation data are next in focus, alongside signals on AI regulation and hyperscaler investment plans. The brief does not say how those releases may land.
Online Sentiment Turns Defensive across Growth Themes
Separately, online sentiment tracked in unverified posts by anonymous retail users has turned more defensive toward AI and semiconductor themes, based on a reading of such posts. This material may include rumour or speculation and has not been checked. It is not institutional flow or confirmed positioning.
The tone in these posts appears to have shifted from enthusiasm about data-center demand toward questions about cost and payoff. Some commentary circles around whether the AI trade has changed character. That is theme-level chatter only, and it should be treated as noise until verified. One interpretation is that retail tone is following price action rather than leading it, though that cannot be confirmed from posts alone.
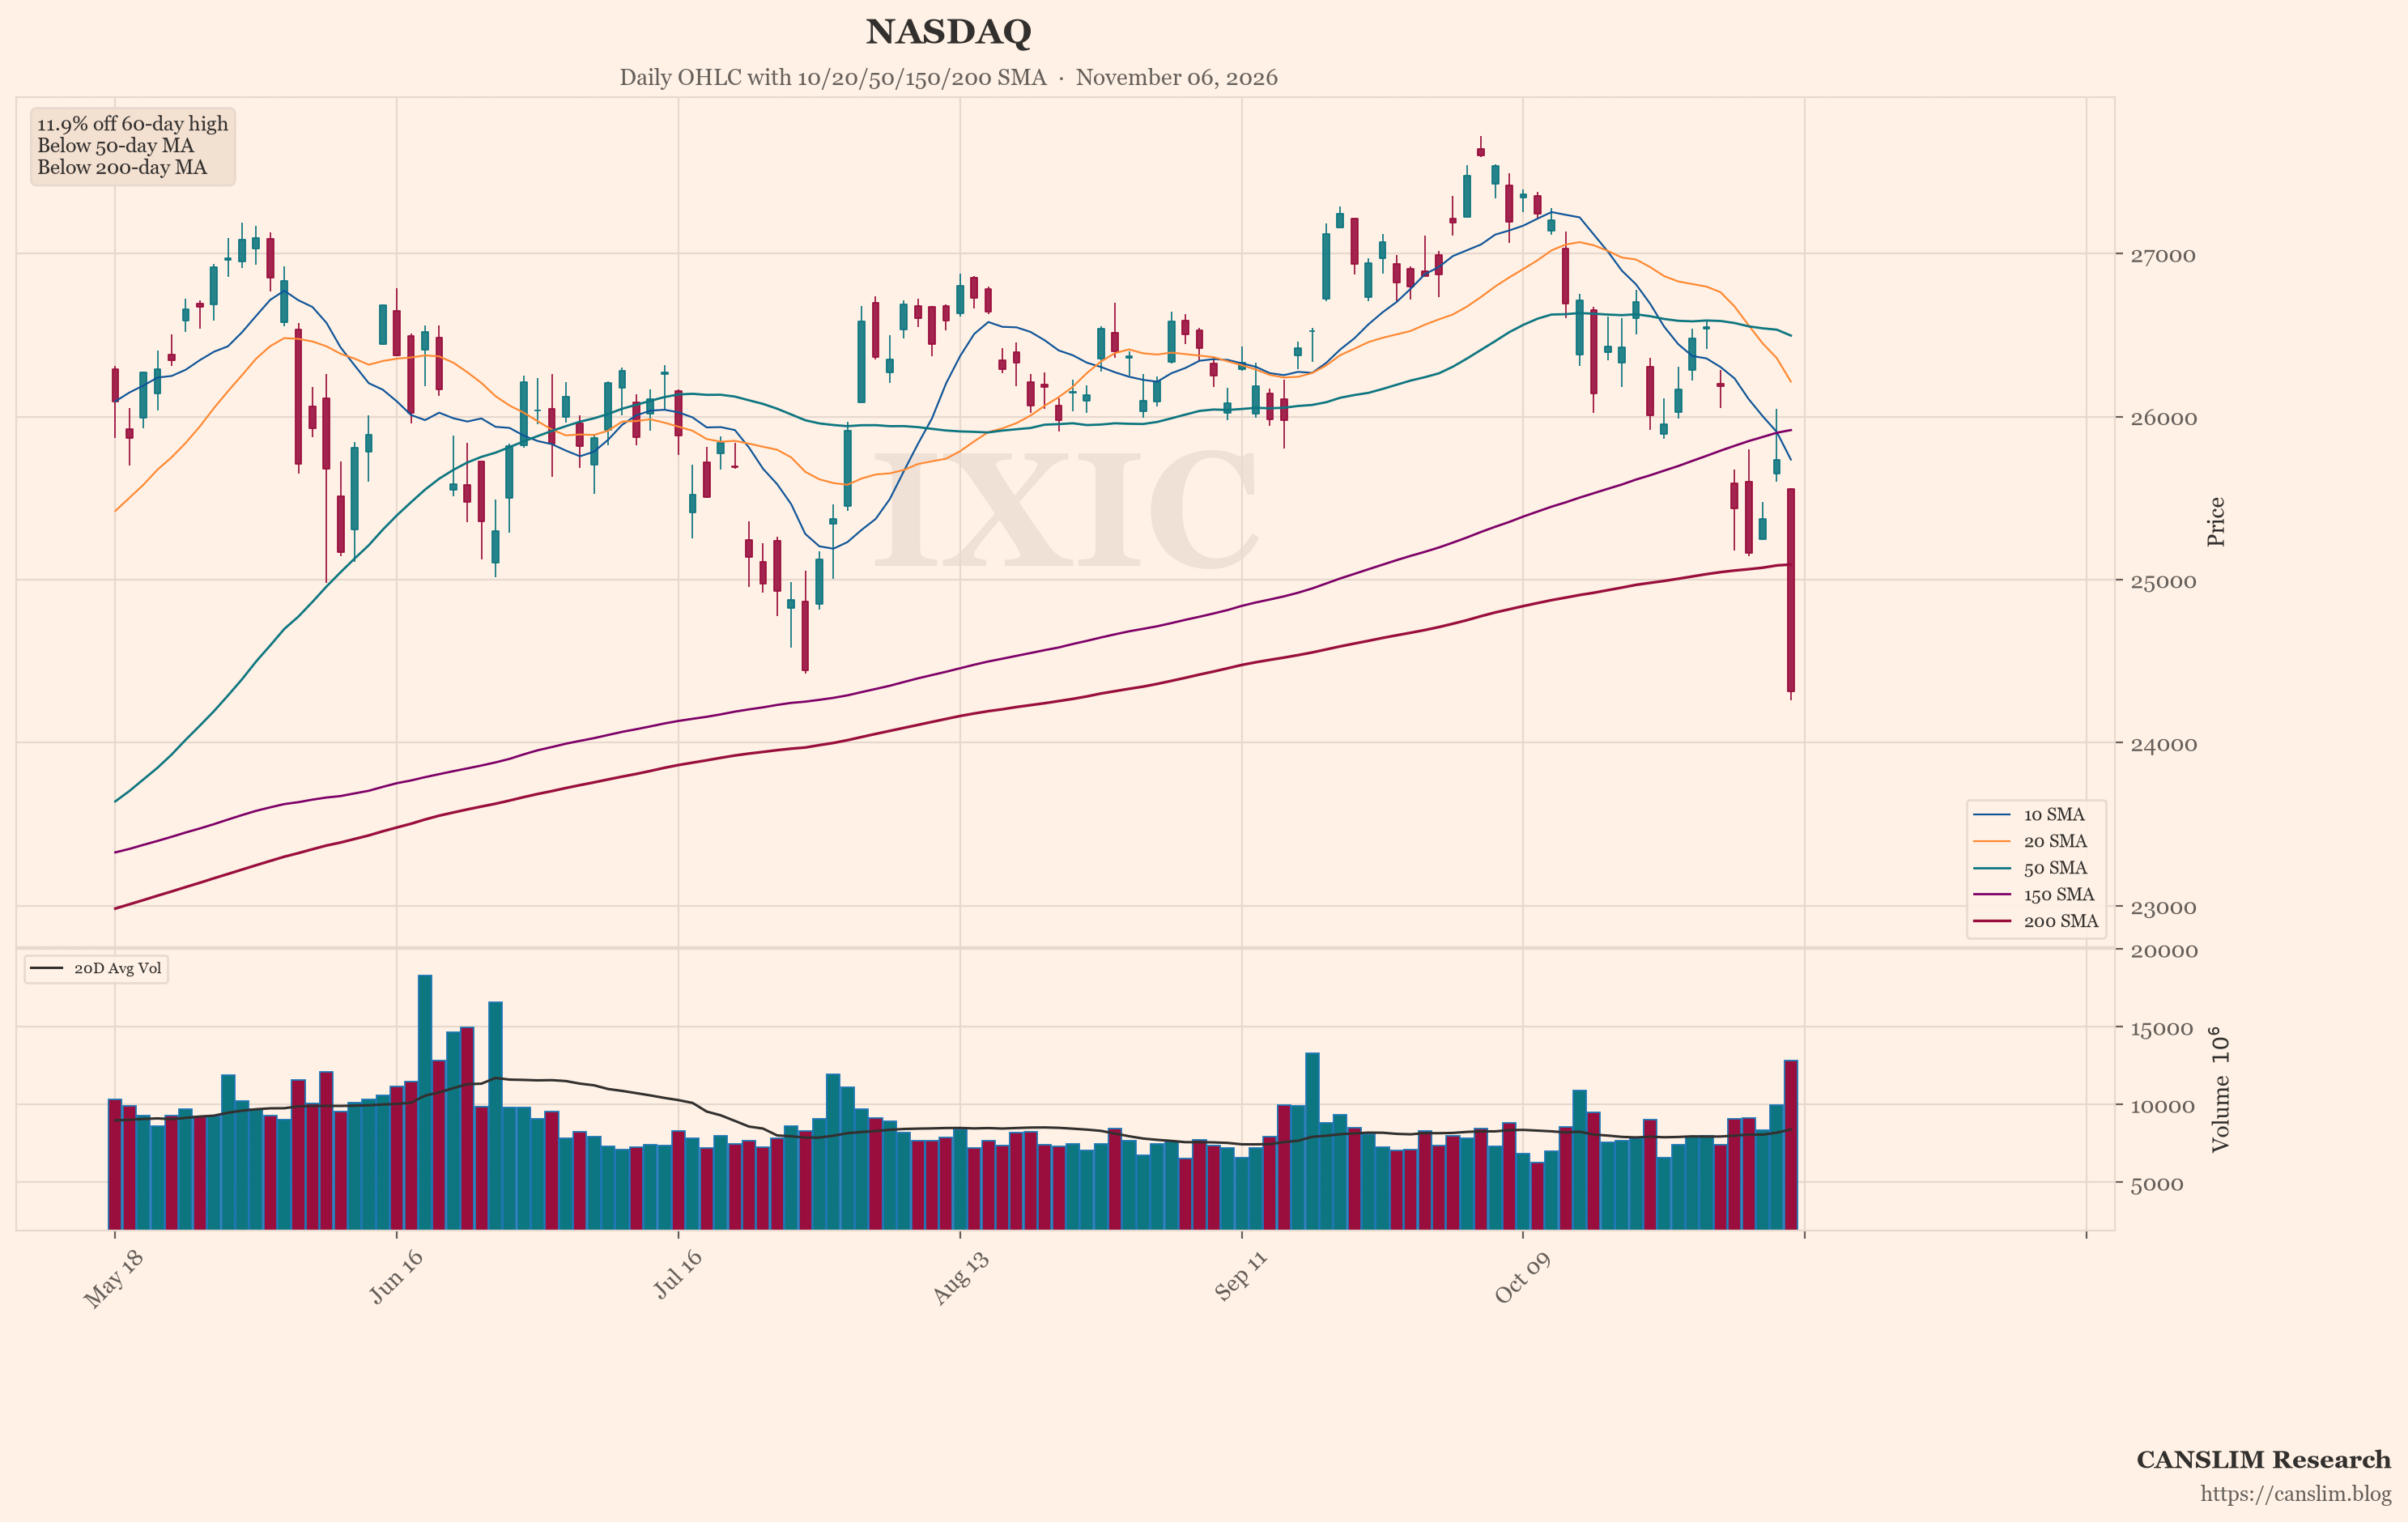
Chart Screen Flags Nasdaq Weakness on Several Measures
The featured chart shows the Nasdaq (^IXIC). An automated technical screen selected it because, among the indices and stocks it checked, it showed the most weakness on a few measures. These include distance from its recent high, position versus its 50-day and 200-day moving averages, and down days on higher volume.
This is one screen, not a full view of the market. Past price patterns do not predict future results. The reading describes what has happened in price and volume, not what comes next.
Correction or Break Remains Unresolved
Conditions described in the brief are mixed. A sharp AI-led decline, global contagion, oil above $100 and political uncertainty sit alongside recovering futures, low semiconductor valuations and strong productivity data. Online sentiment among anonymous retail users leans defensive, but that material is unverified and may be wrong.
The main uncertainty is whether data-center spending will justify its cost. A second is whether policy and inflation pressures widen the pullback. The brief records both correction views and fundamental-doubt views without resolving them.
Sources: a third-party AI-generated market news summary, and an AI summary of unverified posts by anonymous retail users online. This article was written by an AI language model from those summaries and published automatically without human review. Updated 2026-11-06 22:00 HKT.
CANSLIM Research (canslim.blog) is an independent educational publisher. It is not licensed or registered as a broker, investment adviser, research analyst or asset manager in any jurisdiction. This article is general information for education only. It is not investment advice, a research report, an investment recommendation, or an offer or solicitation to buy or sell any security, and it does not consider any reader's objectives, financial situation or needs. No ticker, chart, heading or technical comment is a suggestion to buy, sell, hold or short. Figures come from third-party sources, are not independently verified, and may be incomplete, out of date or wrong. Online sentiment may include rumour, speculation or coordinated posting. Past performance and past price patterns do not predict future results. Investing involves risk, including the loss of capital. This article is not updated after publication. Laws differ by country; seek advice from a licensed professional in your jurisdiction before making any investment decision.