 Andrew
General educational commentary only, generated automatically with AI. Not investment advice or a recommendation to buy, sell or hold any security. Capital is at risk.
Technology Shares Resume Their Decline
U.S. stocks finished mixed on Monday. Technology shares fell and offset relief from lower oil prices earlier in the day. The Nasdaq Composite fell 1.07% and the S&P 500 lost 0.50%, according to the news brief. The Wall Street Journal described the session as U.S. stocks mixed, with percolating AI fears offsetting oil relief. Invezz reported that the Nasdaq fell 1% as AI spending concerns weighed on tech stocks.
AI Spending Questions Pressure the Nasdaq-100
Investors are increasingly asking whether large AI investments will generate enough returns. MarketWatch reported that the Nasdaq-100 fell into its third correction this year. The index fell 6.66% in October, while the Dow gained 1.7% over the same period, according to the brief. One reading is that this reflects a shift in market leadership rather than a breakdown in the broader market. Seeking Alpha framed the issue as AI's rising bill of expectations.
Earnings Beats Spread beyond Technology
Barron's reported that the biggest earnings beats this season are coming from outside tech. The brief cites stronger earnings surprises in energy, utilities and industrials. This may suggest that market strength is spreading beyond mega-cap technology. The next test for AI-linked stocks is whether company results can show that heavy investment is translating into durable returns.
Oil Reverses as Rate News Adds Uncertainty
Oil prices first fell on hopes for U.S.-Iran negotiations. Reuters then reported a U.S. strike on Iran's Qeshm Island, which renewed supply concerns and pushed crude higher. Australia's central bank raised its benchmark rate by 25 basis points to 4.85%, citing a material upward revision to inflation forecasts, CNBC reported. This may suggest that inflation concerns could keep monetary policy restrictive.
Online Sentiment Turns Cautious on Growth Themes
Online sentiment around growth and technology themes has turned more cautious, based on unverified posts by anonymous retail users. These posts may include rumour or speculation and have not been checked. They are not a measure of institutional flow or confirmed positioning. Some posts discuss whether AI spending will pay off. Others focus on the gap between large-cap tech and the rest of the market. This commentary describes theme-level chatter only and does not repeat specific claims.
Chart Screen Flags Nasdaq Weakness on Several Measures
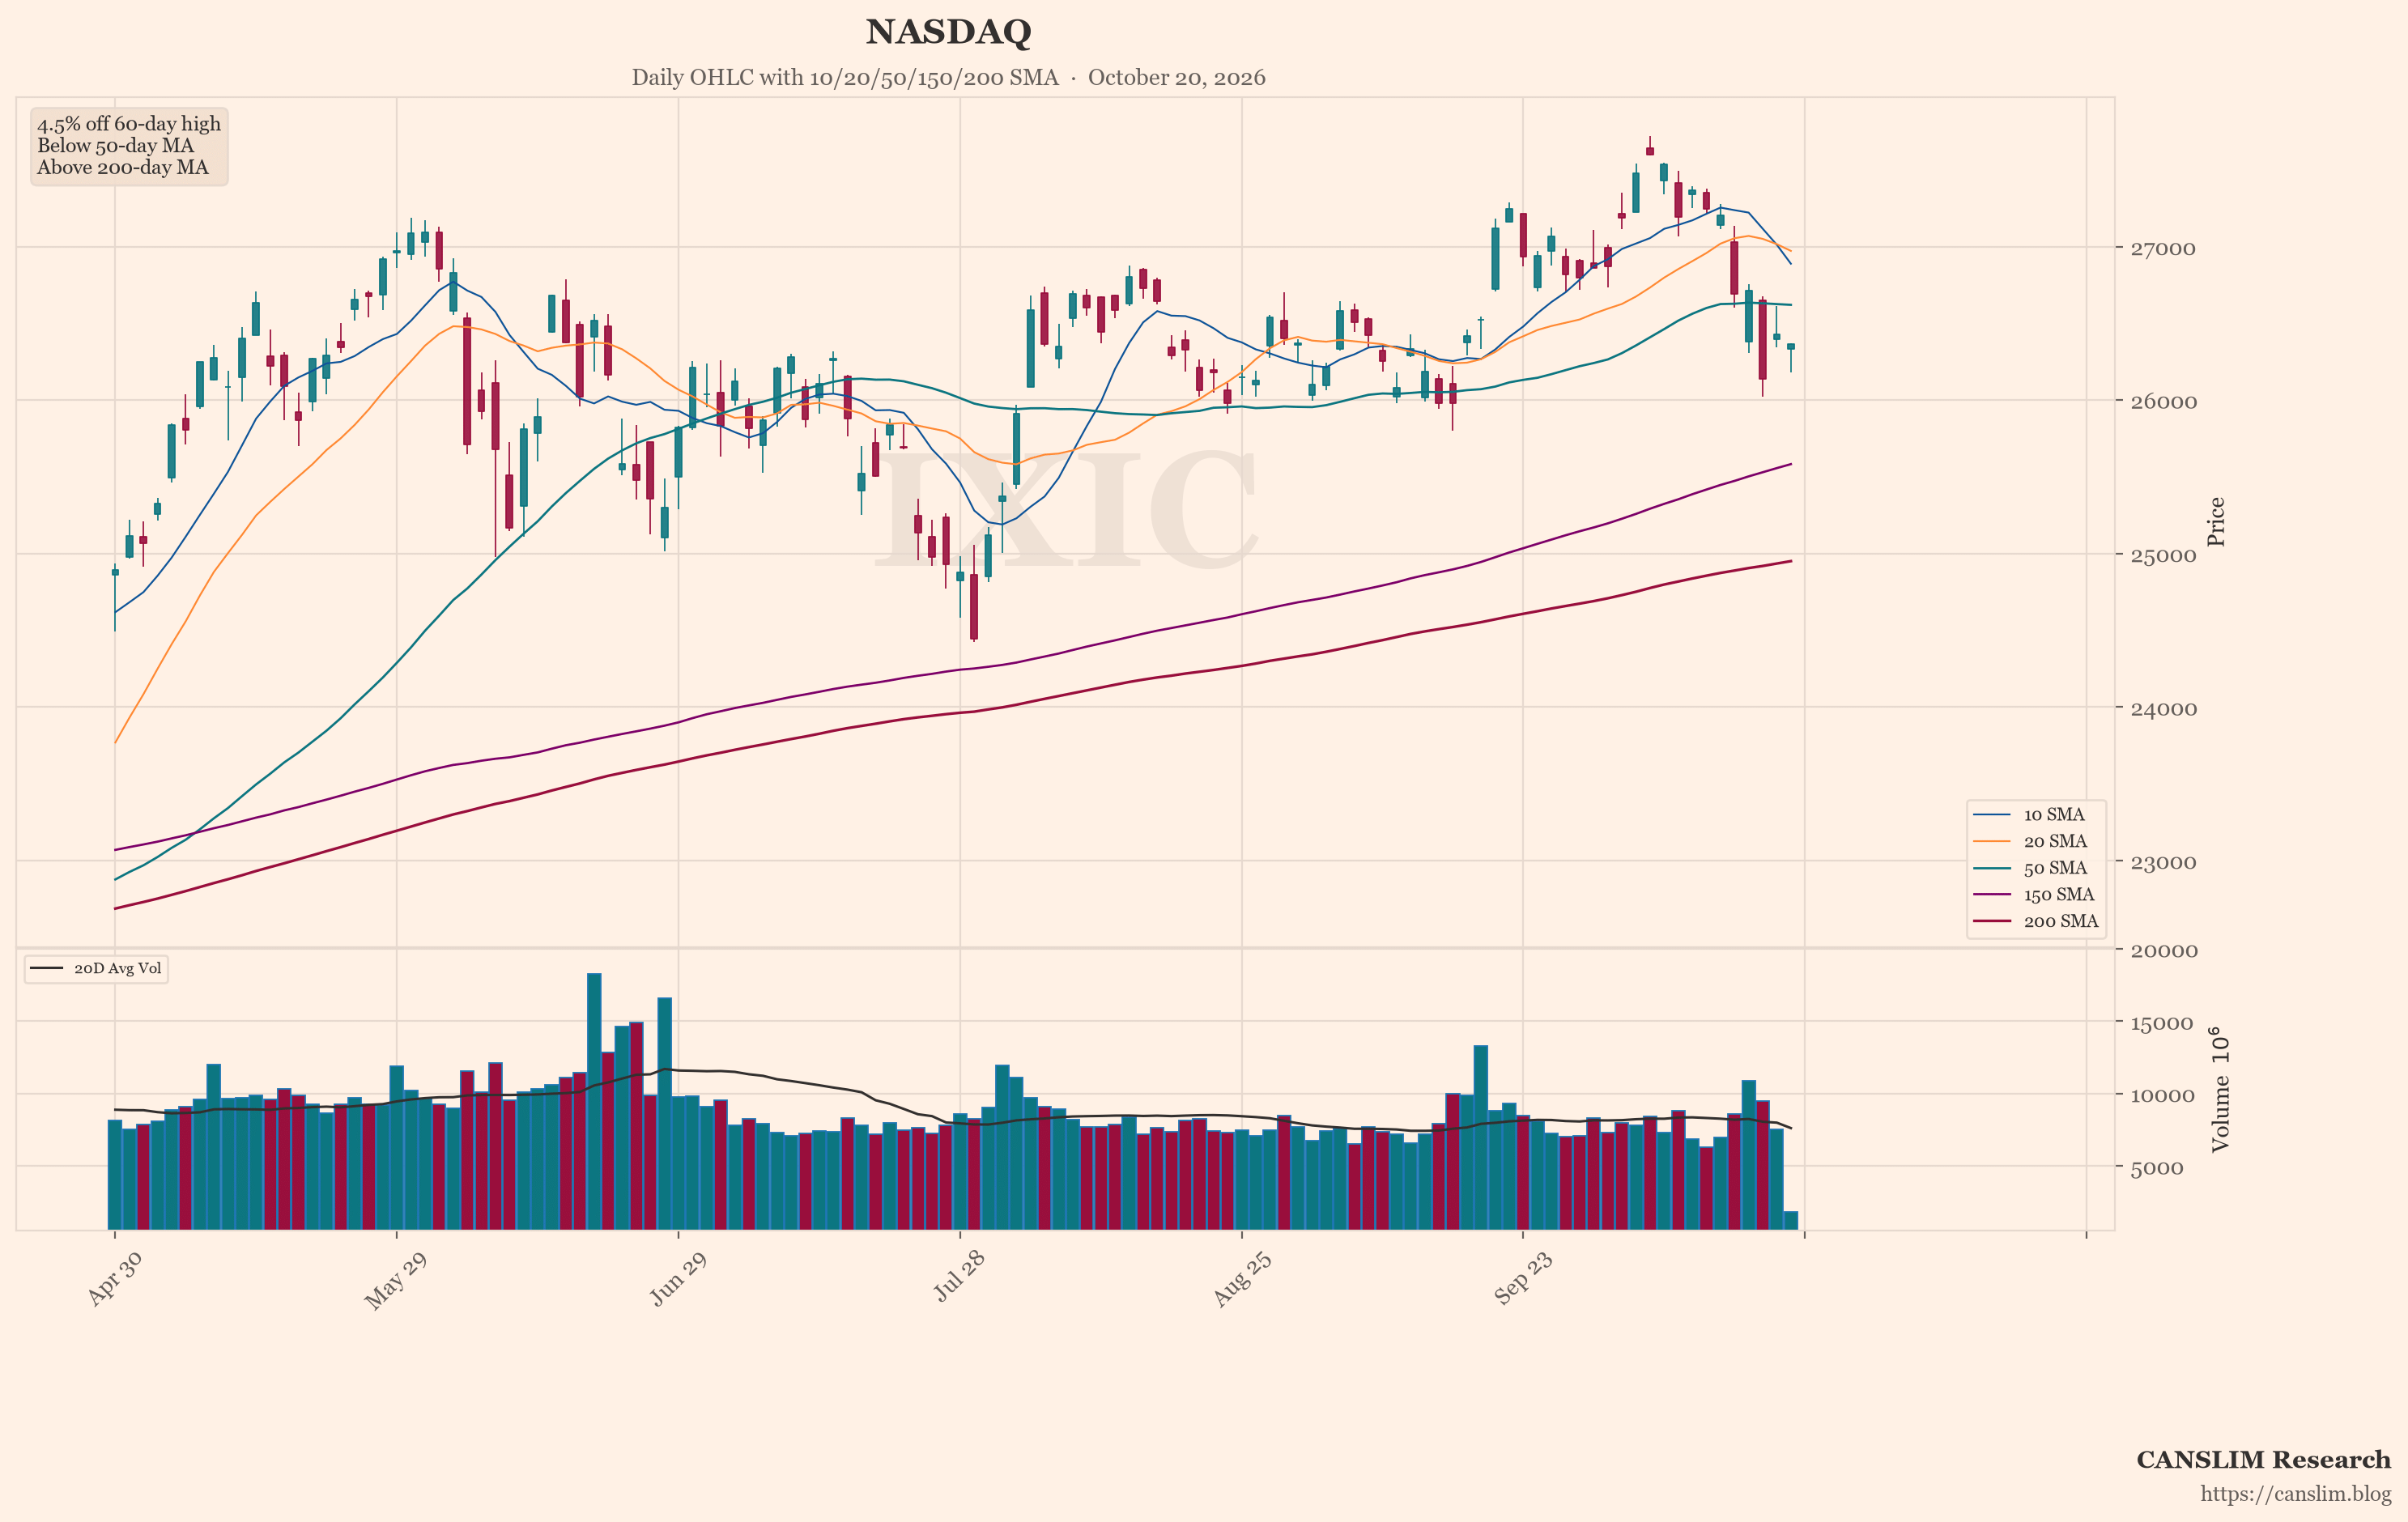
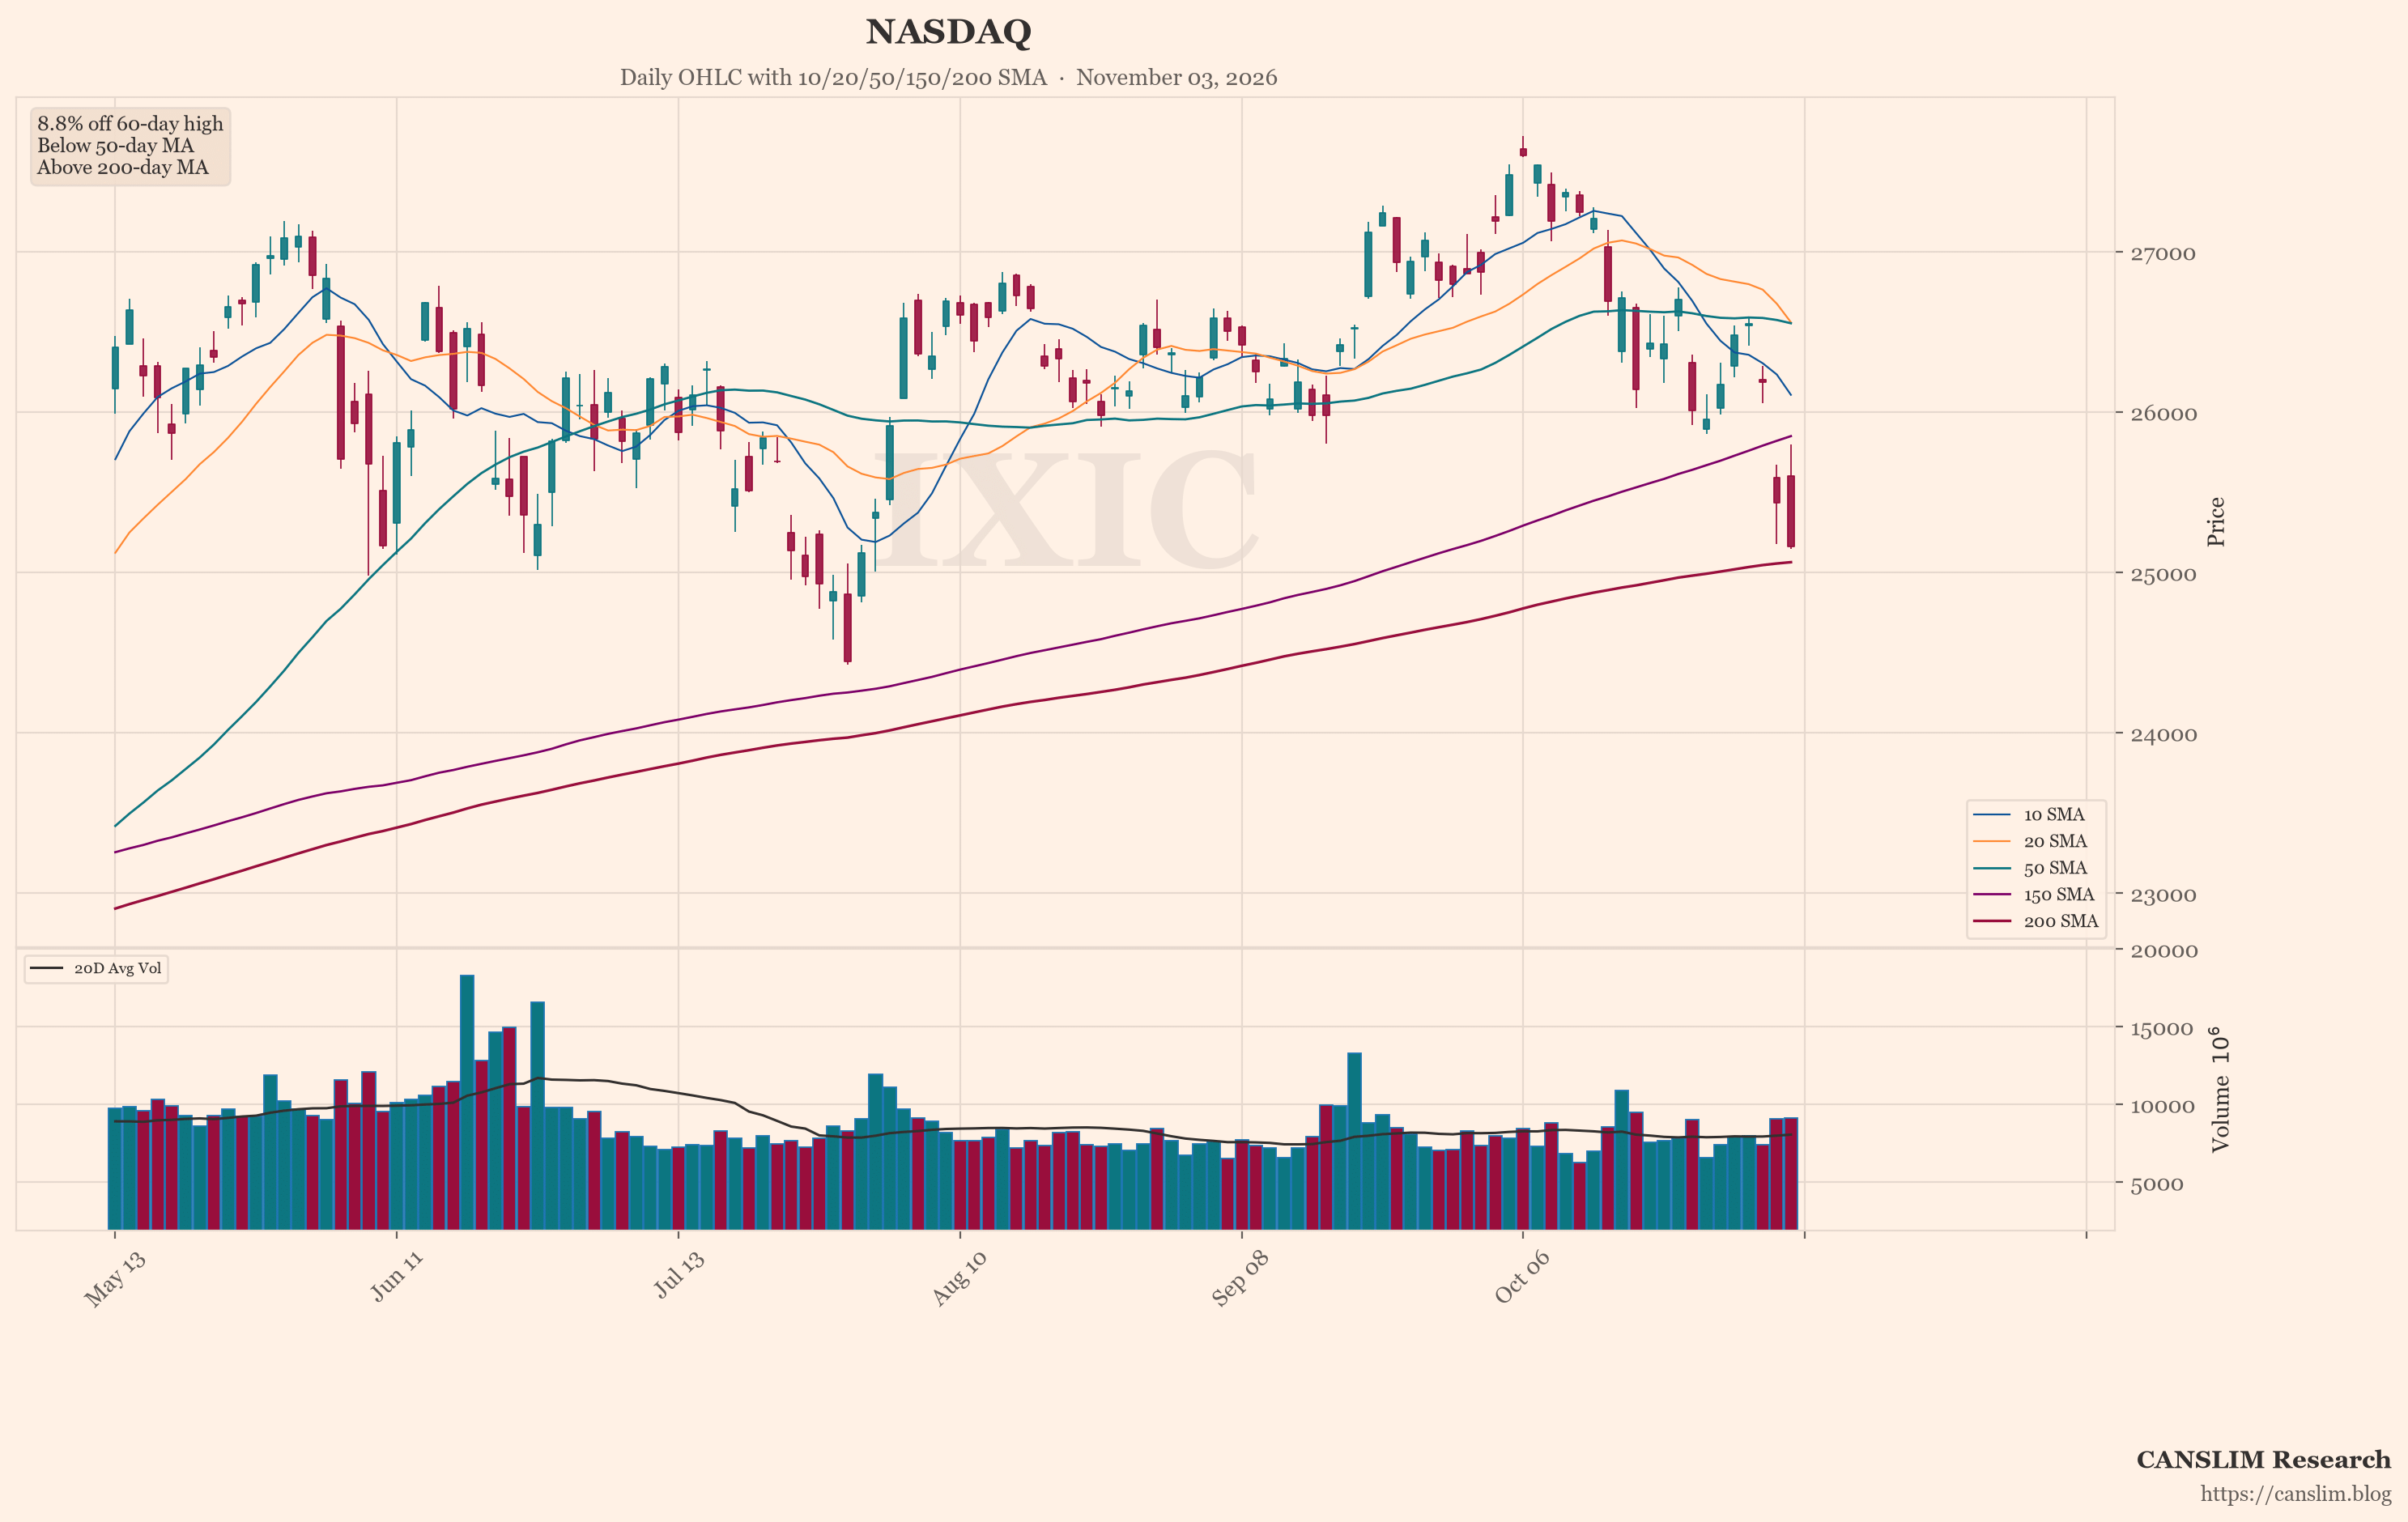
The featured chart shows the Nasdaq (^IXIC). An automated technical screen picked it because, among the indices and stocks it checked, it showed the most weakness on a few measures. These were distance from its recent high, position versus its 50-day and 200-day moving averages, and down days on higher volume. One screen is not a full view. Past price patterns do not predict future results.
Mixed Leadership Leaves the Outlook Uncertain
Conditions are split. Tech and AI-linked shares face questions about spending and returns. Energy, utilities and industrials have shown stronger earnings surprises. Oil headlines can shift quickly. Global rate news shows inflation risks remain. Online sentiment is cautious, though such posts are unverified. The screen's weakness reading for the Nasdaq is one data point, not a forecast. Whether strength broadens further, and whether tech results show returns on AI investment, is uncertain.
Sources: a third-party AI-generated market news summary, and an AI summary of unverified posts by anonymous retail users online. This article was written by an AI language model from those summaries and published automatically without human review. Updated 2026-11-03 14:00 HKT.
CANSLIM Research (canslim.blog) is an independent educational publisher. It is not licensed or registered as a broker, investment adviser, research analyst or asset manager in any jurisdiction. This article is general information for education only. It is not investment advice, a research report, an investment recommendation, or an offer or solicitation to buy or sell any security, and it does not consider any reader's objectives, financial situation or needs. No ticker, chart, heading or technical comment is a suggestion to buy, sell, hold or short. Figures come from third-party sources, are not independently verified, and may be incomplete, out of date or wrong. Online sentiment may include rumour, speculation or coordinated posting. Past performance and past price patterns do not predict future results. Investing involves risk, including the loss of capital. This article is not updated after publication. Laws differ by country; seek advice from a licensed professional in your jurisdiction before making any investment decision.