 Andrew
General educational commentary only, generated automatically with AI. Not investment advice or a recommendation to buy, sell or hold any security. Capital is at risk.
Technology Shares Lead a Third Weekly Decline
The S&P 500 fell 0.6% last week. It has now closed lower for three weeks in a row, according to the market brief. The retreat has been led by technology and AI-related shares. The brief reports that investors are asking whether very large AI spending plans can produce returns fast enough. They are also weighing high valuations and rising financing costs.
The same brief notes that the index is still only 3.1% below its record high. So the pullback has not erased the longer-term uptrend. Even so, the brief describes Friday's break of a key support level as a near-term technical warning.
Credit Markets Show Strain beyond Equities
Concern is not limited to stocks. The brief reports that credit-default swap spreads for some AI-linked companies have widened. It says this suggests financing worries are reaching beyond the stock market. The brief also notes that recent tech weakness has pulled down Japan's Nikkei index.
One reading is that investors are rethinking the cost of the AI build-out, not just its potential. This may suggest that financing conditions deserve attention alongside price charts. The source material does not give specific spread levels or company names.
Elections, Jobs Data and Two Earnings Reports Ahead
The brief lists several catalysts for the week. Tuesday brings U.S. midterm elections. October employment data is also due. The brief says the jobs report is expected to show 65,000 payroll gains and 4.2% unemployment. It adds that stronger data could support the view that the economy remains resilient. Softer wage and spending trends may ease pressure on the Fed.
Earnings from Apple and AMD are also scheduled. The brief says these reports could reset expectations for policy, growth and the AI trade. Oil slipped more than 1% as Iran-related talks continued, according to Reuters. Bloomberg reports that the Strait of Hormuz remains unsafe, and the brief says crude supply is still constrained. Energy prices and inflation therefore stay in focus.
Online Sentiment Turns Defensive on Growth Themes
Online sentiment around growth and AI themes has turned more cautious, based on unverified posts by anonymous retail users. These posts may include rumour or speculation and have not been checked. They are not a measure of institutional flow or confirmed positioning. The tone described in these posts leans defensive toward high-multiple technology themes. Some posts also discuss whether the multi-week slide changes the picture for momentum-style growth methods. This is sentiment at the theme level only, and it can shift quickly.
A Screen Flags Weakness in One Chip Name
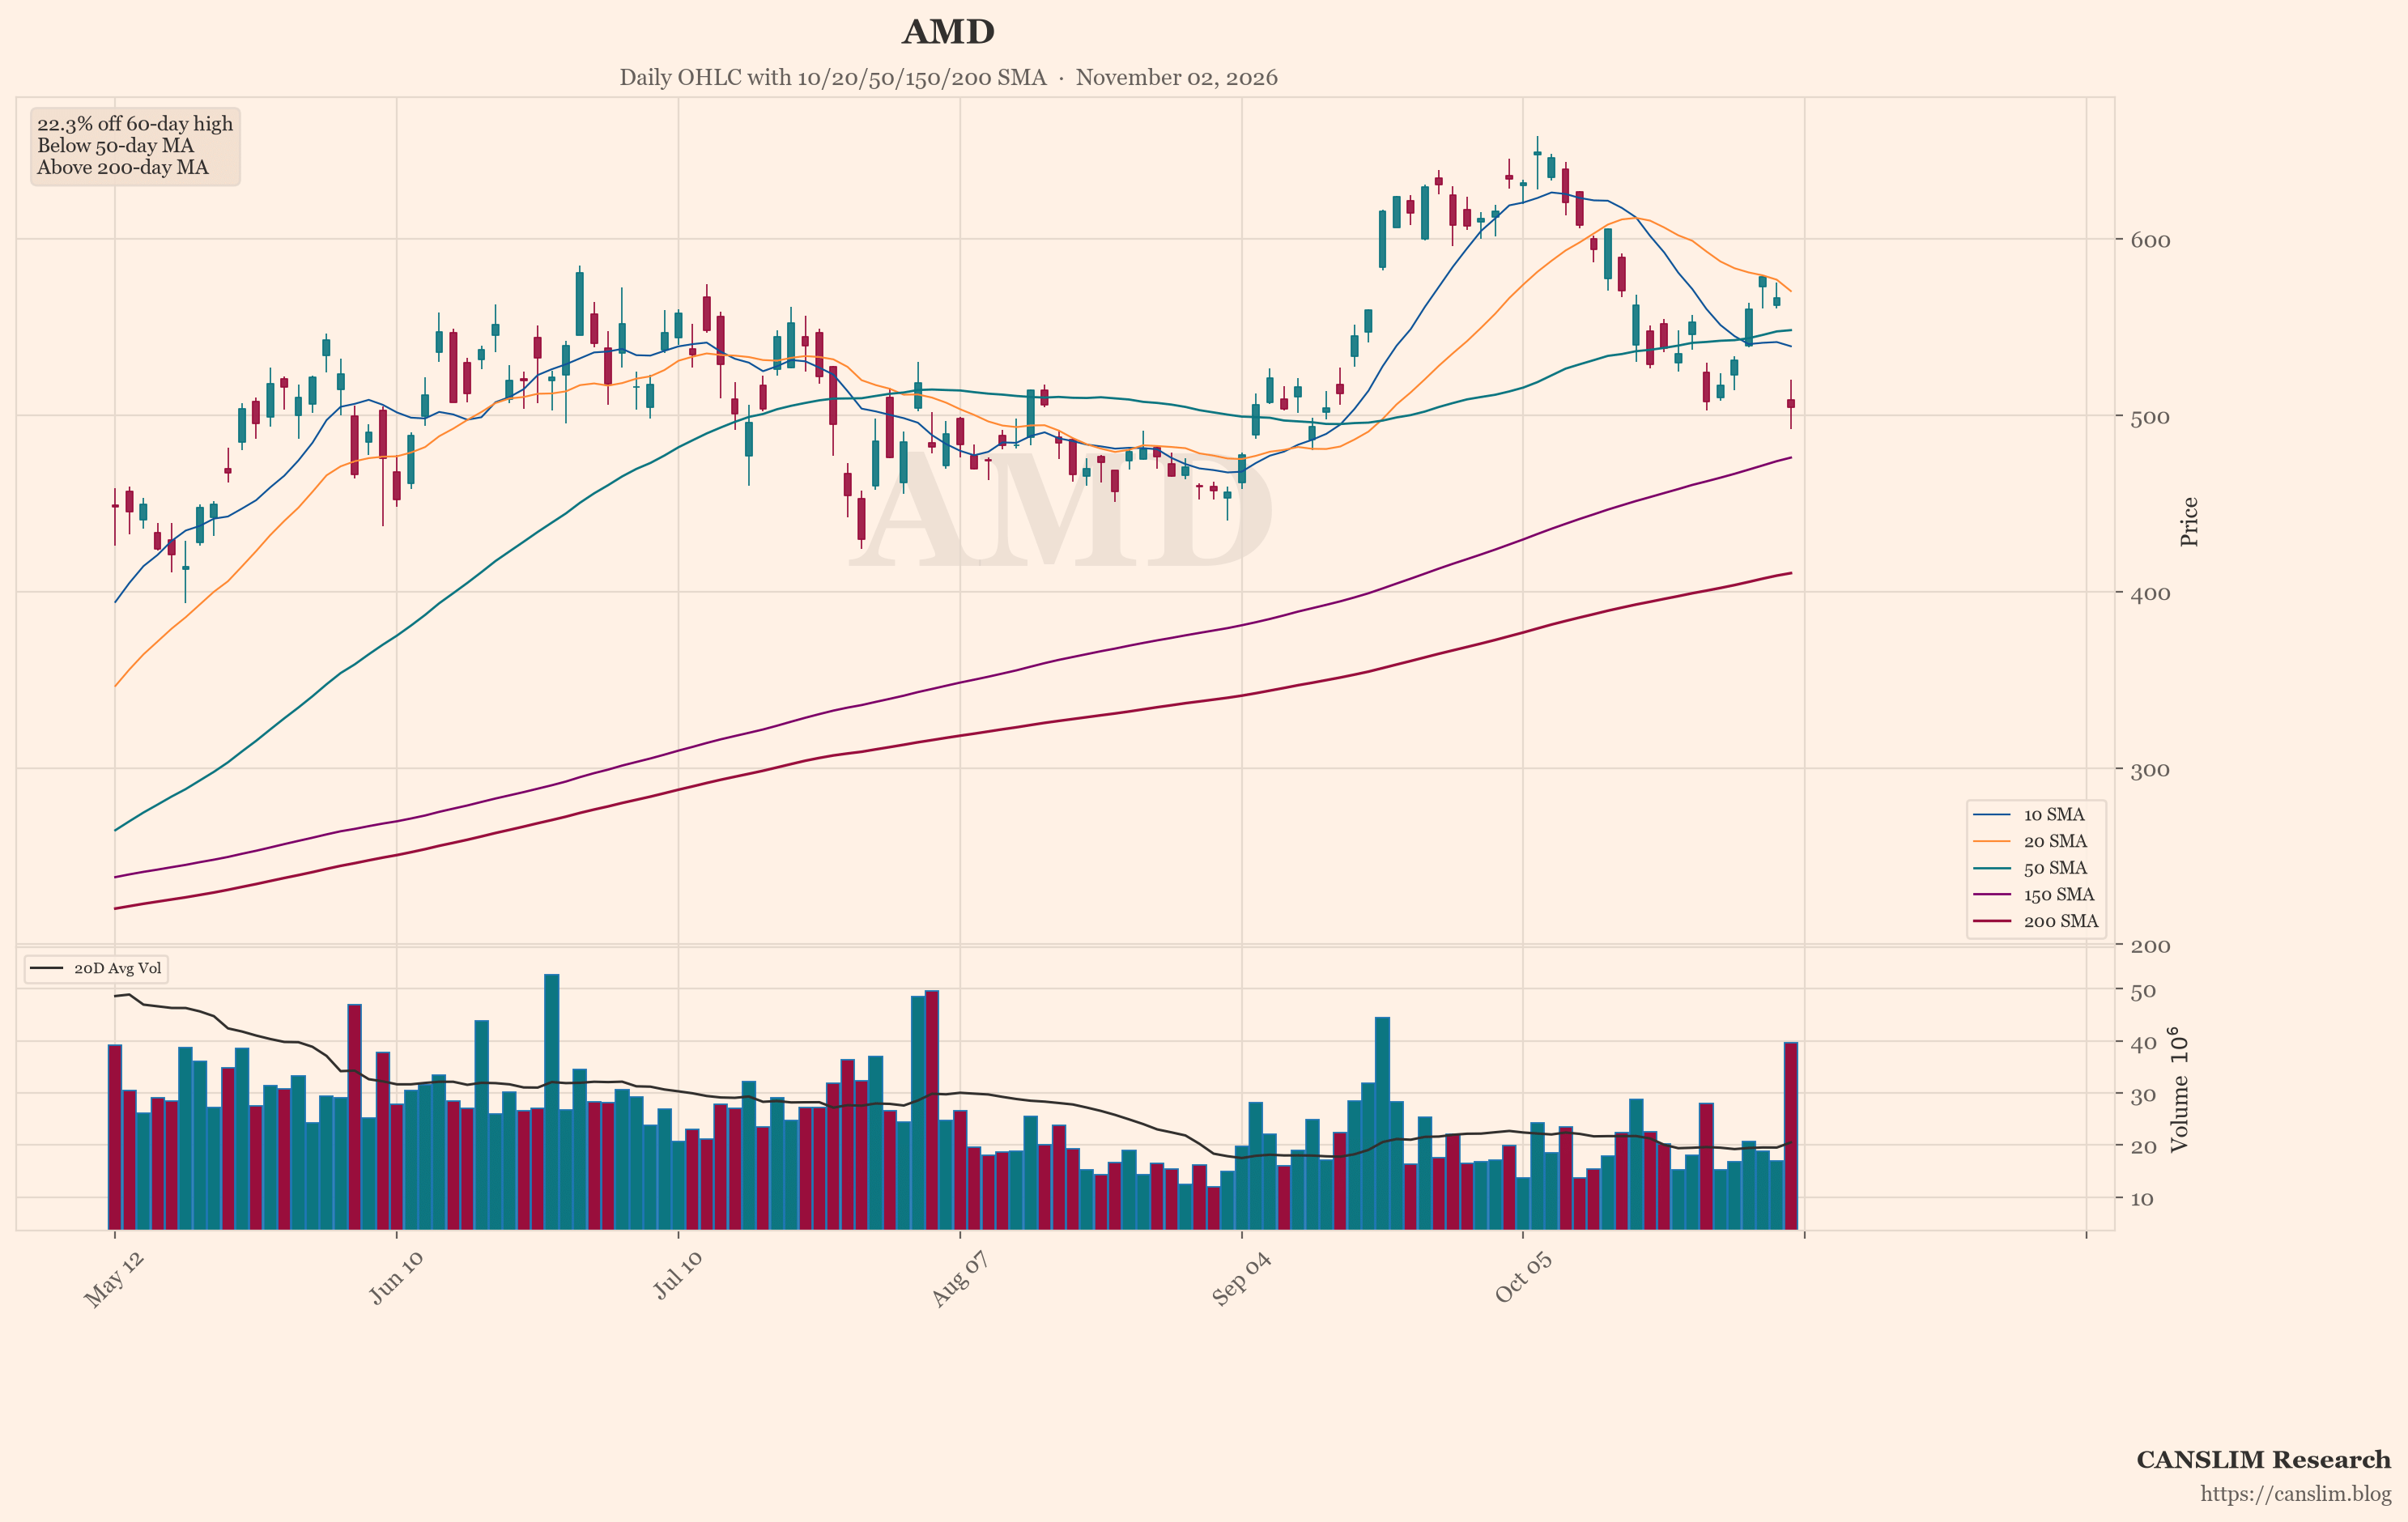
The featured chart shows AMD (AMD). An automated technical screen selected it from the indices and stocks it checked. Among those, it showed the most weakness on a few measures. These were distance from its recent high, position versus its 50-day and 200-day moving averages, and down days on higher volume. This is a description of what the measures show, not a signal about the company. One screen is not a full view, and past price patterns do not predict future results.
Risks Sit in Credit, Energy and Policy
The risks in the source material are mostly on the bearish side. The brief flags widening credit-risk indicators for AI-linked firms. It notes the index's break of support and its three-week decline. It also points to unsafe Gulf shipping and constrained crude supply as inflation risks. Abroad, Brazil's post-election selloff shows how fiscal uncertainty can hit currencies and stocks. Binance resumed withdrawals after a $6.3 billion hack, and CNBC reports $3.64 billion in net outflows. The brief says the scale of the hack remains a risk to crypto trust. On the other side, commodities have outperformed other major asset classes this year, which the brief calls a counterpoint to weakness in U.S. growth stocks.
A Market still near Highs but under Pressure
Conditions are mixed. The S&P 500 remains close to its record, yet it has fallen for three weeks and has broken a support level. AI and technology shares are under pressure, and credit markets show some strain. The week's elections, jobs data and earnings could shift expectations in either direction. Energy and inflation risks remain elevated. Online sentiment is cautious, though such posts are unverified and may be wrong. The source material supports a picture of a market under near-term pressure within a longer uptrend that is still intact.
Sources: a third-party AI-generated market news summary, and an AI summary of unverified posts by anonymous retail users online. This article was written by an AI language model from those summaries and published automatically without human review. Updated 2026-11-02 14:00 HKT.
CANSLIM Research (canslim.blog) is an independent educational publisher. It is not licensed or registered as a broker, investment adviser, research analyst or asset manager in any jurisdiction. This article is general information for education only. It is not investment advice, a research report, an investment recommendation, or an offer or solicitation to buy or sell any security, and it does not consider any reader's objectives, financial situation or needs. No ticker, chart, heading or technical comment is a suggestion to buy, sell, hold or short. Figures come from third-party sources, are not independently verified, and may be incomplete, out of date or wrong. Online sentiment may include rumour, speculation or coordinated posting. Past performance and past price patterns do not predict future results. Investing involves risk, including the loss of capital. This article is not updated after publication. Laws differ by country; seek advice from a licensed professional in your jurisdiction before making any investment decision.
Discover more from CANSLIM Research
Subscribe to get the latest posts sent to your email.