 Andrew@CANSLIM RESEARCH
Tech Records Ring Loud While the Rest Stays Quiet
The Nasdaq closed at another record on Tuesday. QQQ rose 0.82% to 747.52. AI optimism kept pushing big technology names higher. But the rest of the market did not confirm the move. SPY finished nearly flat at 773.79, up just 0.03%. DIA fell 0.31%. Breadth stayed thin, with few new highs outside large-cap tech. This is a narrow rally. Growth leadership is intact, but it stands on very few legs.
The Bond Market Is Quietly Pushing Back
Investors demanded the highest yield at a two-year Treasury auction since 2024. The online crowd barely mentioned it. Richmond Fed President Thomas Barkin warned that one rate hike may not be enough if energy-driven inflation persists. The 2-year yield above 4.75% got almost no discussion in social sentiment. That silence is itself a warning. Rising short-term yields raise borrowing costs and pressure stock valuations. Growth names feel this first.
Fuel Prices Add Heat to an Already Hot Inflation Story
The Hormuz supply shock is lifting diesel and jet-fuel prices. Diesel now tops $6.5 per gallon. The White House is weighing a full or partial diesel-export ban. That could ease domestic prices but creates uncertainty for refiners and global fuel markets. Cruise stock RCL fell 5.75% to 235.83 on higher fuel costs and weaker demand. USO dropped 2.75%. Shipping ETF BWET plunged 17.44%. Energy headlines kept shifting all day, and the market swung with each one.
Memory Chips Run Hot as the Crowd Chases the Move
Memory names were the emotional center of the session. MU jumped 5.05% to 1096.17, just shy of 1100. SNDK surged 7.08% to 1890.88. SOXL gained 7.08%. The crowd sees 1100 as MU's key battleground before its 9/30 earnings report. Some call for 1200 or even 1500. Others warn of the "rally before earnings, sell the news" pattern. One long-time holder noted the "+15% then -15%" cycle has repeated several times. Fear and greed sit near 74/100, up from 72. FOMO is back, but full euphoria is not here yet.
Financials Crack While Few Are Watching
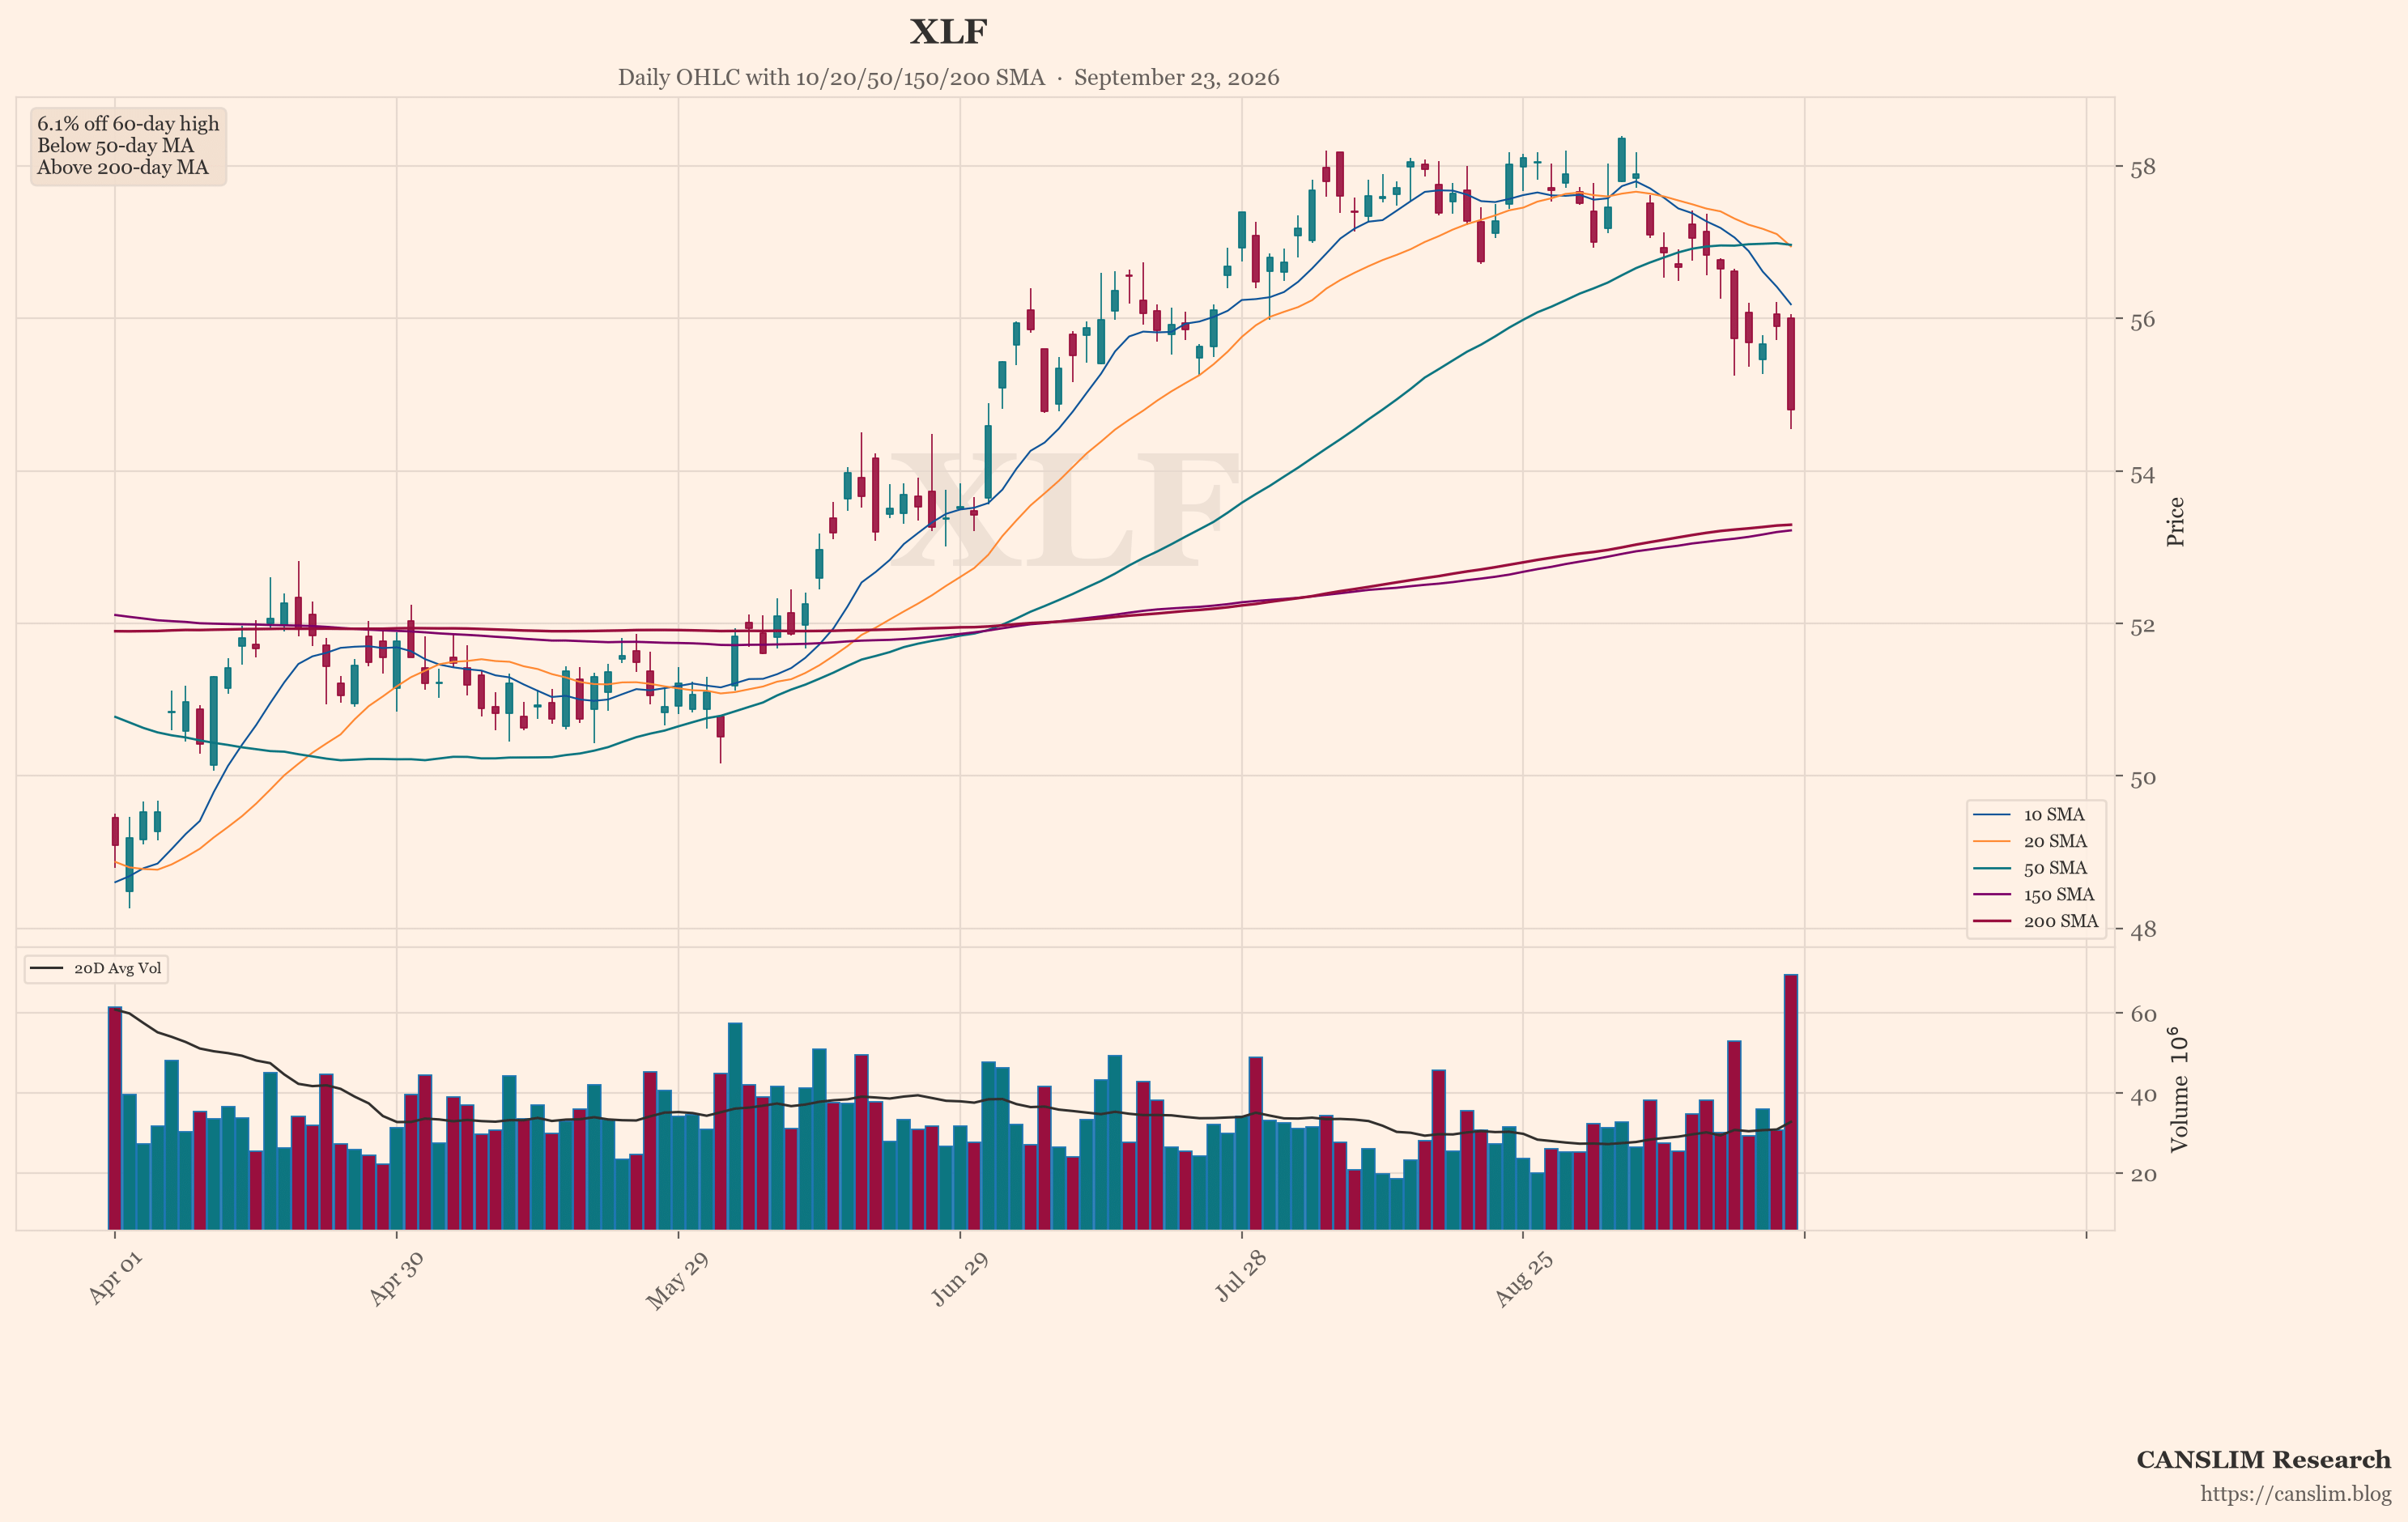
The featured chart, XLF, shows the weakest technical pattern right now. Financials extended their declines. JPM fell 3.36%. XLF dropped 1.93%. This is a real divergence. The Dow is weak. The 2-year yield is rising. Yet the online crowd talks only about chips and the Nasdaq. Legacy tech also split apart. GOOGL fell 1.07%. META lost 0.70%. DELL dropped 4.14%. CSCO fell 4.38%. Meanwhile, NVDA added just 0.71% and stayed below 230. Leadership is narrowing, not widening.
Watch the Leaders, Not the Index
The AI trade may not be enough to save the whole market. That is the key lesson from Barron's this week. U.S.-China talks on AI and trade could help risk assets, but expectations for a durable deal remain modest. Crypto regulation is moving through agencies after the Clarity Act stalled. None of this fixes thin breadth. For growth investors, the playbook stays simple. Follow the leaders that hold firm. Avoid the laggards. XLF is a laggard. MU and SNDK are leaders, but they are extended. When the crowd treats bad news as normal, risk is building. Stay disciplined. Let the market prove itself before you commit.
Sources: market news brief & global social sentiment data. Updated 2026-09-23 06:00 HKT. For educational purposes only — not investment advice.
Discover more from CANSLIM Research
Subscribe to get the latest posts sent to your email.