 Andrew@CANSLIM RESEARCH
The Index Looks Calm, but the Foundation Is Shaking
The S&P 500 finished last week nearly flat. That sounds calm. It is not. Under the surface, the market is splitting apart. The Dow and small caps fell. META dropped 2.49%. NFLX fell 4.65%. Yet the Nasdaq still closed green. Almost all of that strength came from a handful of semiconductor names. SNDK jumped 10.99%. MU rose 3.95%. AVGO gained 3.01%. This is narrow leadership. For growth-stock investors, breadth is the oxygen. When it thins, rallies suffocate.
The AI Trade Meets Its Expensive New Landlord
The AI story is still alive. Semis and large-cap growth keep drawing money. But a new problem is growing. The buildout is becoming more capital intensive. It leans more on debt. Higher funding costs can squeeze returns. They also make it harder to tell real winners from hype. Howard Marks just flagged uncertainty in AI investing. That matters. When a legendary value investor warns, growth investors should listen. The market is asking a simple question: does the spending justify the return? Right now, nobody knows for sure.
AMAT Shows the Cracks in the Chip Story
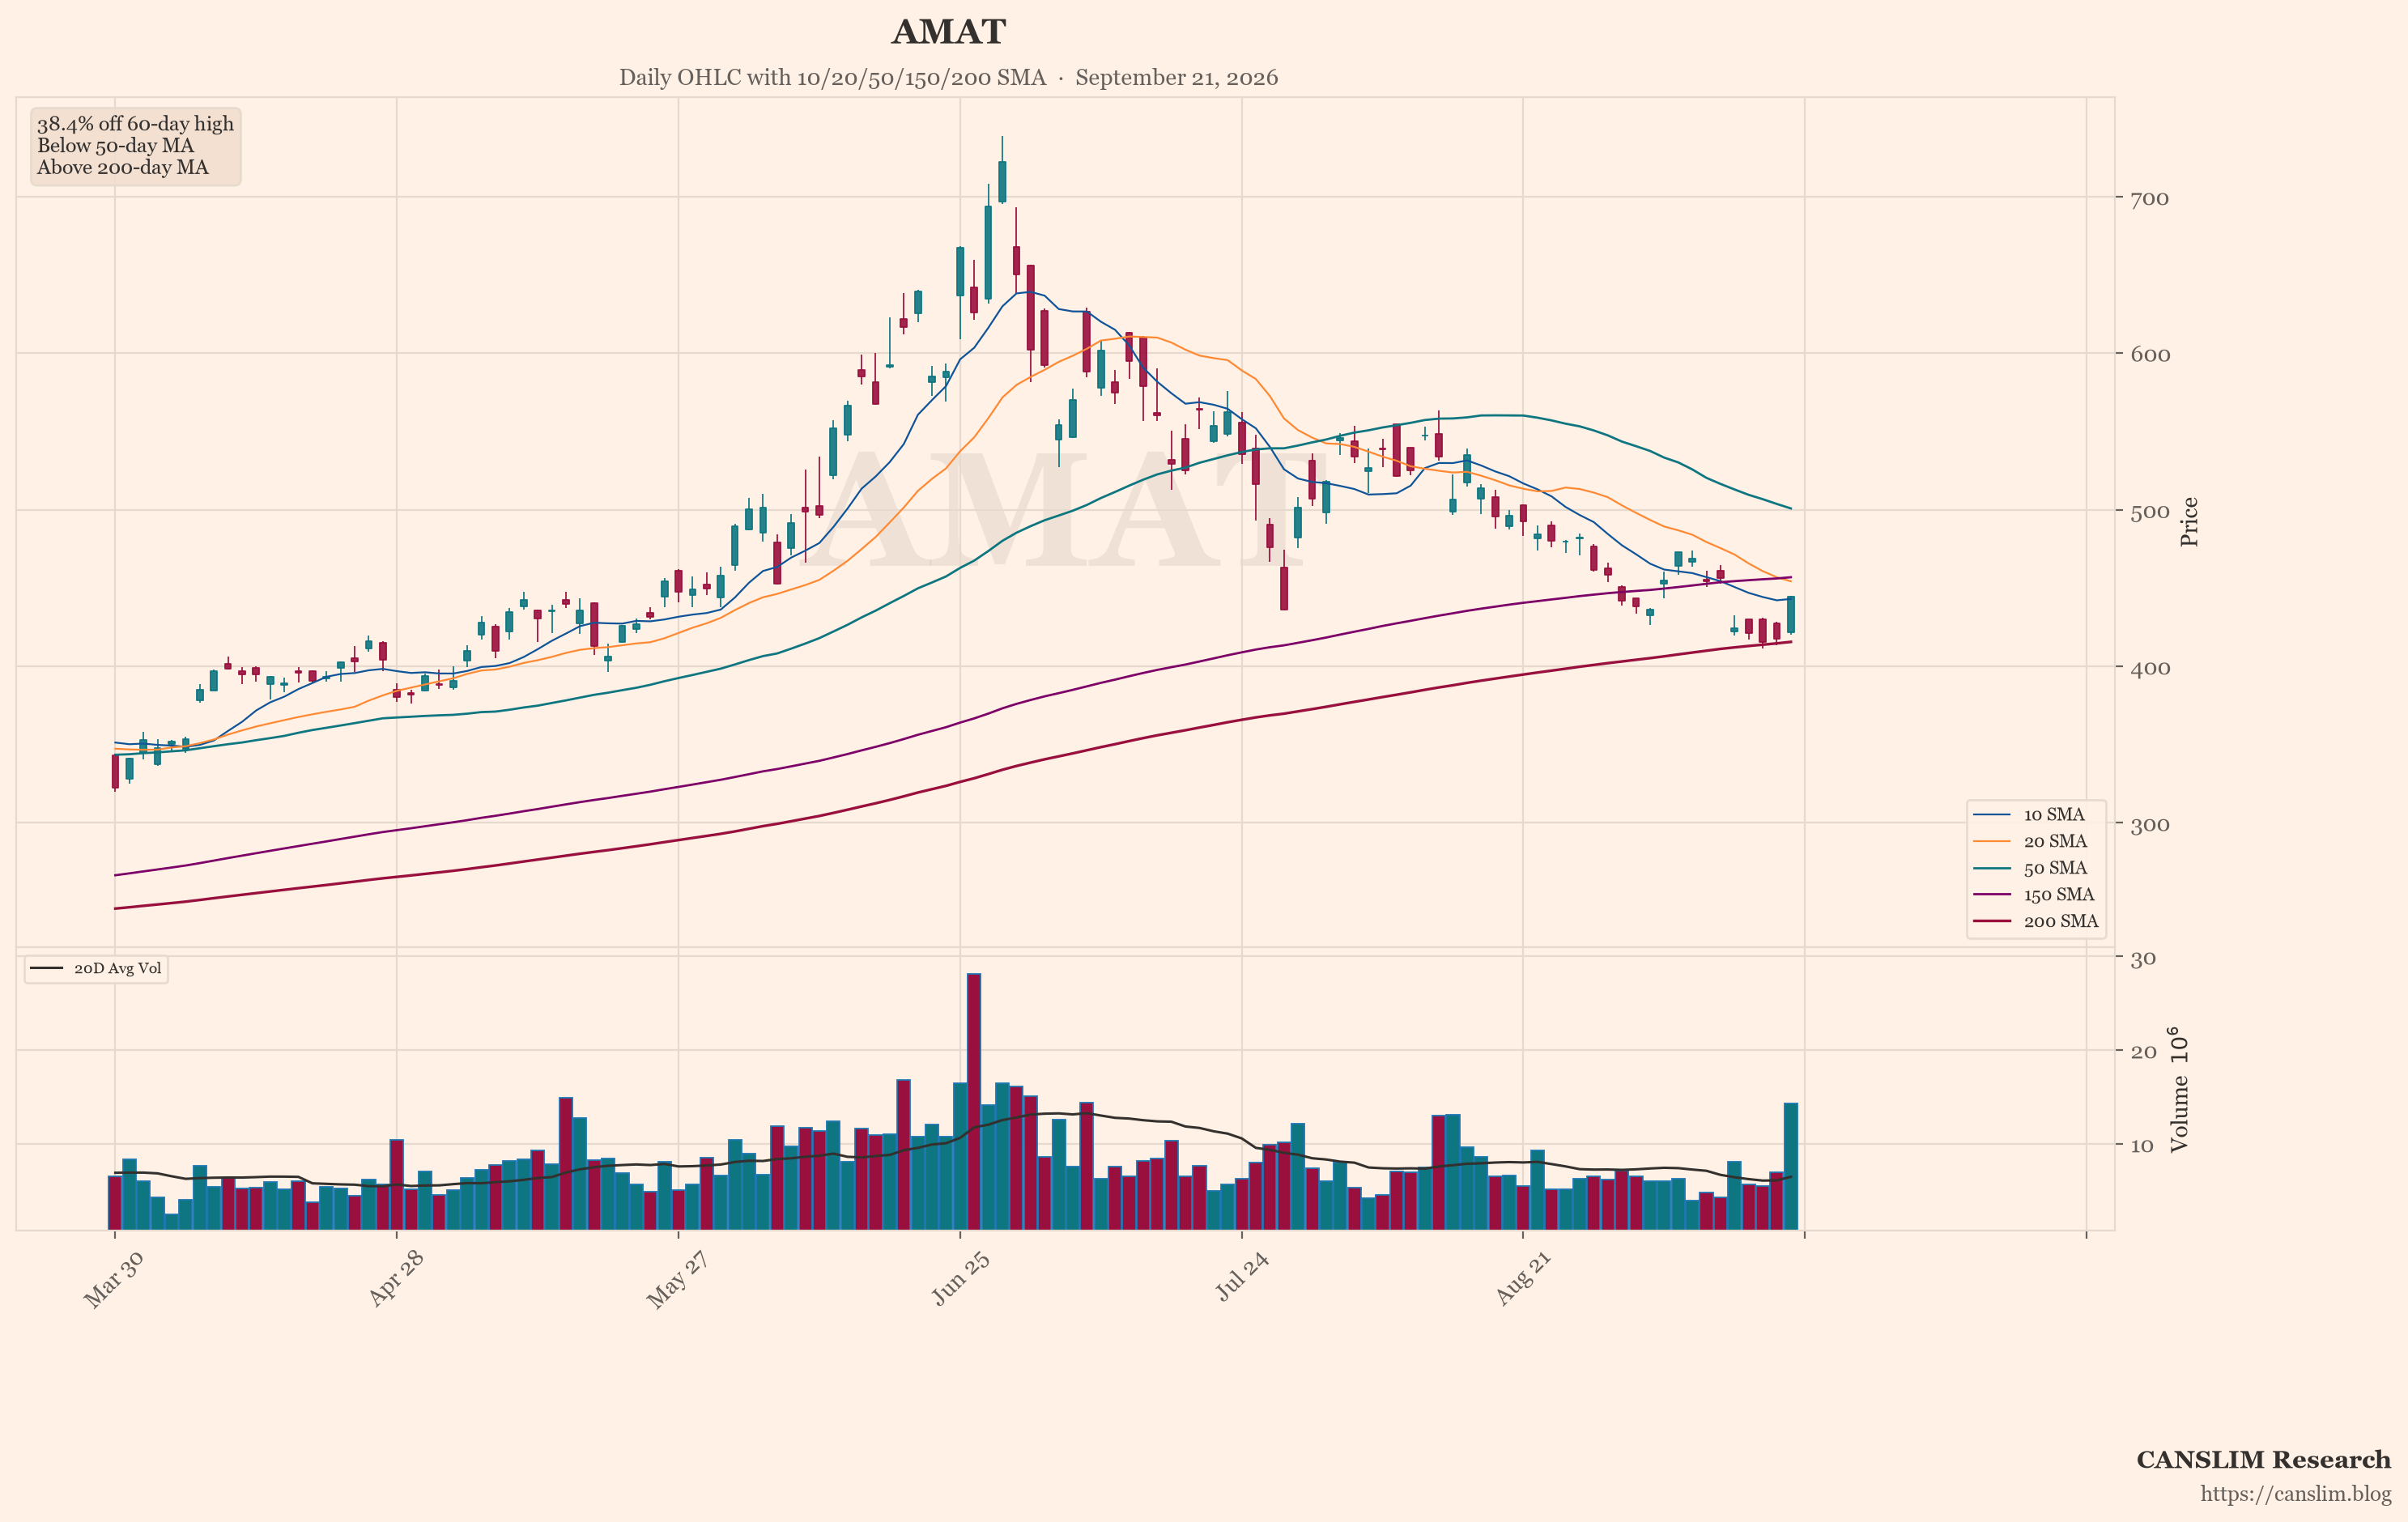
Look at the featured chart: AMAT. It currently shows the weakest technical pattern among the major semis. While MU, AVGO, and AMD push higher, AMAT lags. This divergence is a warning. In a healthy sector, leaders move together. When one major name breaks down, the group is weaker than it looks. AMAT is not just any chip stock. It sells the equipment that makes chips. If its chart is failing, the market may be quietly doubting the capex boom itself. Watch this name closely. It may be the tell.
Rates and the Fed Keep Pressing the Brakes
The Fed just hiked rates again. It signaled more tightening may come. Treasury yields are rising. This is the "higher for longer" problem. It hits rate-sensitive stocks hardest. It also raises the cost of funding the AI buildout. The S&P 500 needs a clean breakout to confirm a stronger upside phase. Until then, resistance holds. The technical picture improved after the recent drop. But improvement is not confirmation. Growth investors should demand confirmation before adding risk.
Oil, Geopolitics, and the Online Crowd's Blind Spot
Global social sentiment is focused on one big binary: war or peace. Iran sent ceasefire conditions through Qatar. Trump's response is pending. Ukraine hit a major Russian refinery. Brent sits near $103. U.S. diesel hit a record $6.43 per gallon. The online crowd is almost unanimously bullish on oil. They see USO, BNO, and XOP as obvious trades. But energy stocks did not follow. XOM was flat. CVX fell 1.04%. That is a red flag. Meanwhile, the crowd read Friday's green Nasdaq as a healthy market. They missed the breadth collapse entirely. They translated it into one idea: semis can still go higher. That is exactly the kind of complacency that precedes trouble.
What the Smart Money Is Quietly Doing
The week ahead is about headlines, not data. Fed speakers, consumer sentiment, retail earnings, and the Trump-Xi summit all loom. Bessent and He Lifeng already met to lay groundwork. AI security, tariffs, and critical minerals are on the table. Any headline can move markets fast. The S&P 500 is flashing warning signs last seen in 2018 and 2022. That does not mean a crash is coming. It means the risk-reward has shifted. Leaders still hold. But the base is narrow. Cash is a position. Patience is a strategy. Wait for the breakout. Wait for breadth to confirm. The market will tell you when it is ready.
Sources: market news brief & global social sentiment data. Updated 2026-09-21 06:00 HKT. For educational purposes only — not investment advice.
Discover more from CANSLIM Research
Subscribe to get the latest posts sent to your email.