 Andrew@CANSLIM RESEARCH
The KOSPI Roars Back, But the Fuel Is Familiar
South Korea’s KOSPI has officially entered a technical bull market, surging more than 20% from its July low. The index jumped nearly 3% at Thursday’s open and climbed as much as 4.8% intraday. The rally is powered by the usual suspects: Samsung Electronics and SK Hynix, which gained 5.2% and 7.7% respectively. These chip giants dominate the benchmark, and their fate is tied directly to the global AI and semiconductor cycle. History suggests this bull run could last one to two years, but a 40- to 50-day pause around the 200-day mark is common. The bigger question is whether chip earnings and Fed policy stay aligned. For now, domestic liquidity is supportive, even if foreign investors turn cautious.
Chip Stocks Lead Overnight Strength, But Oracle Lags
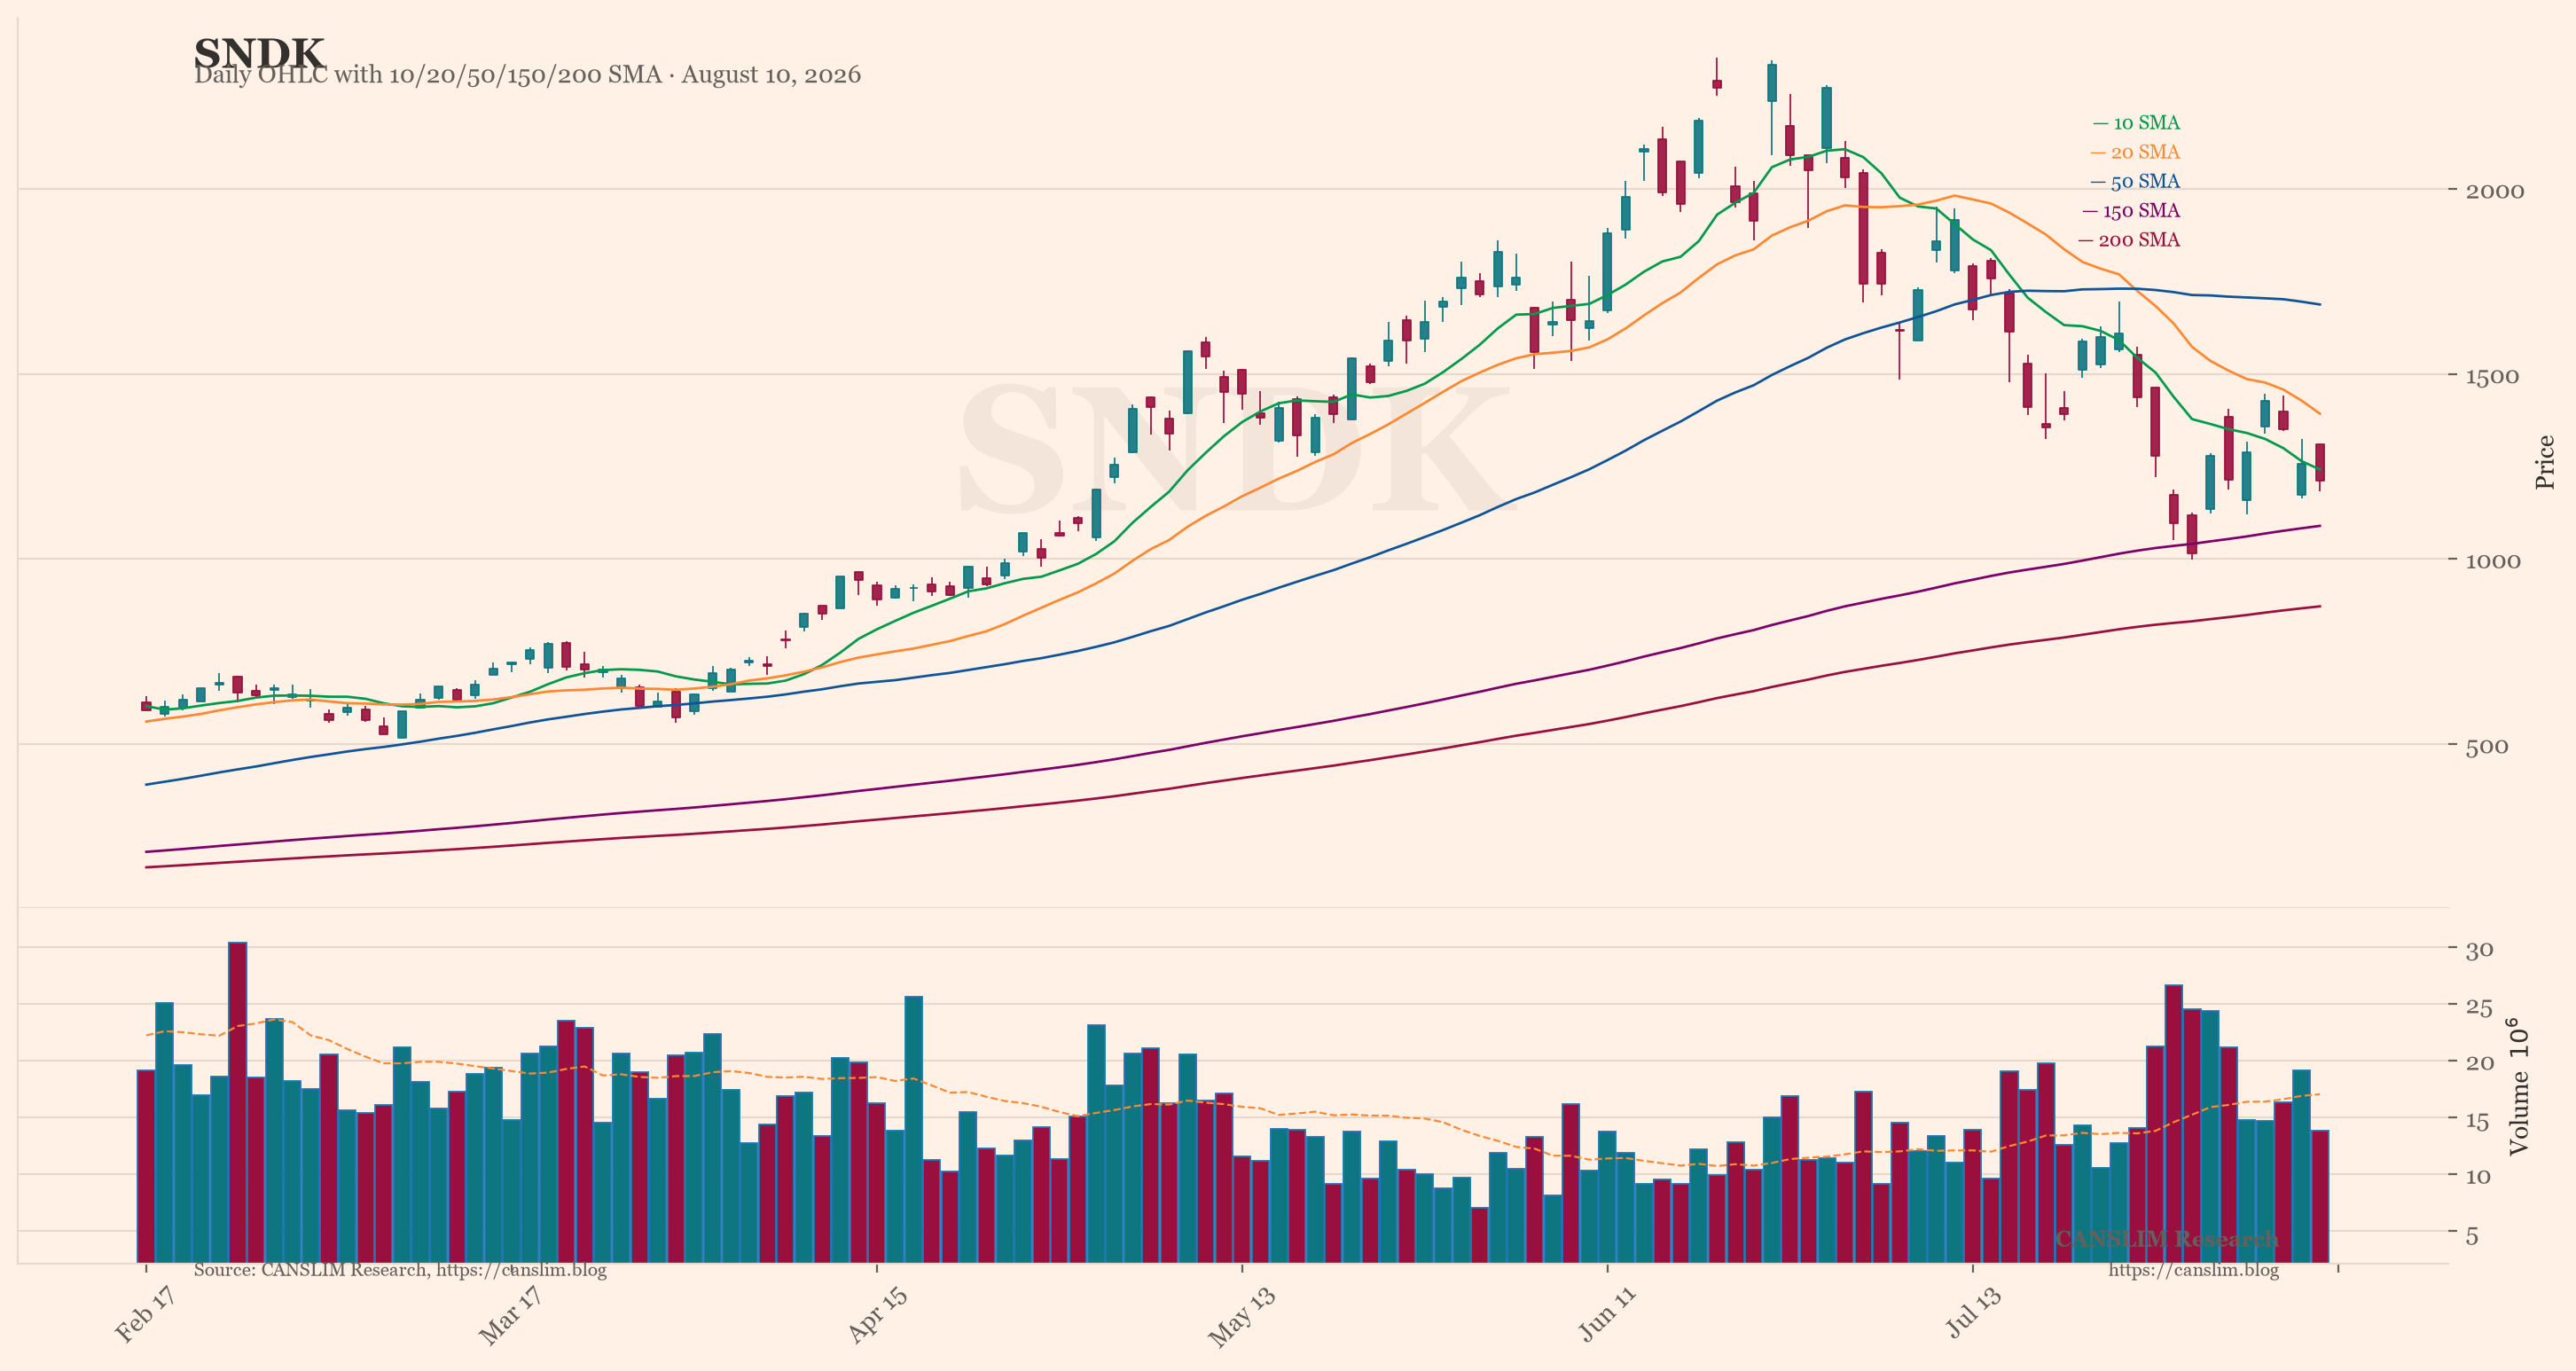
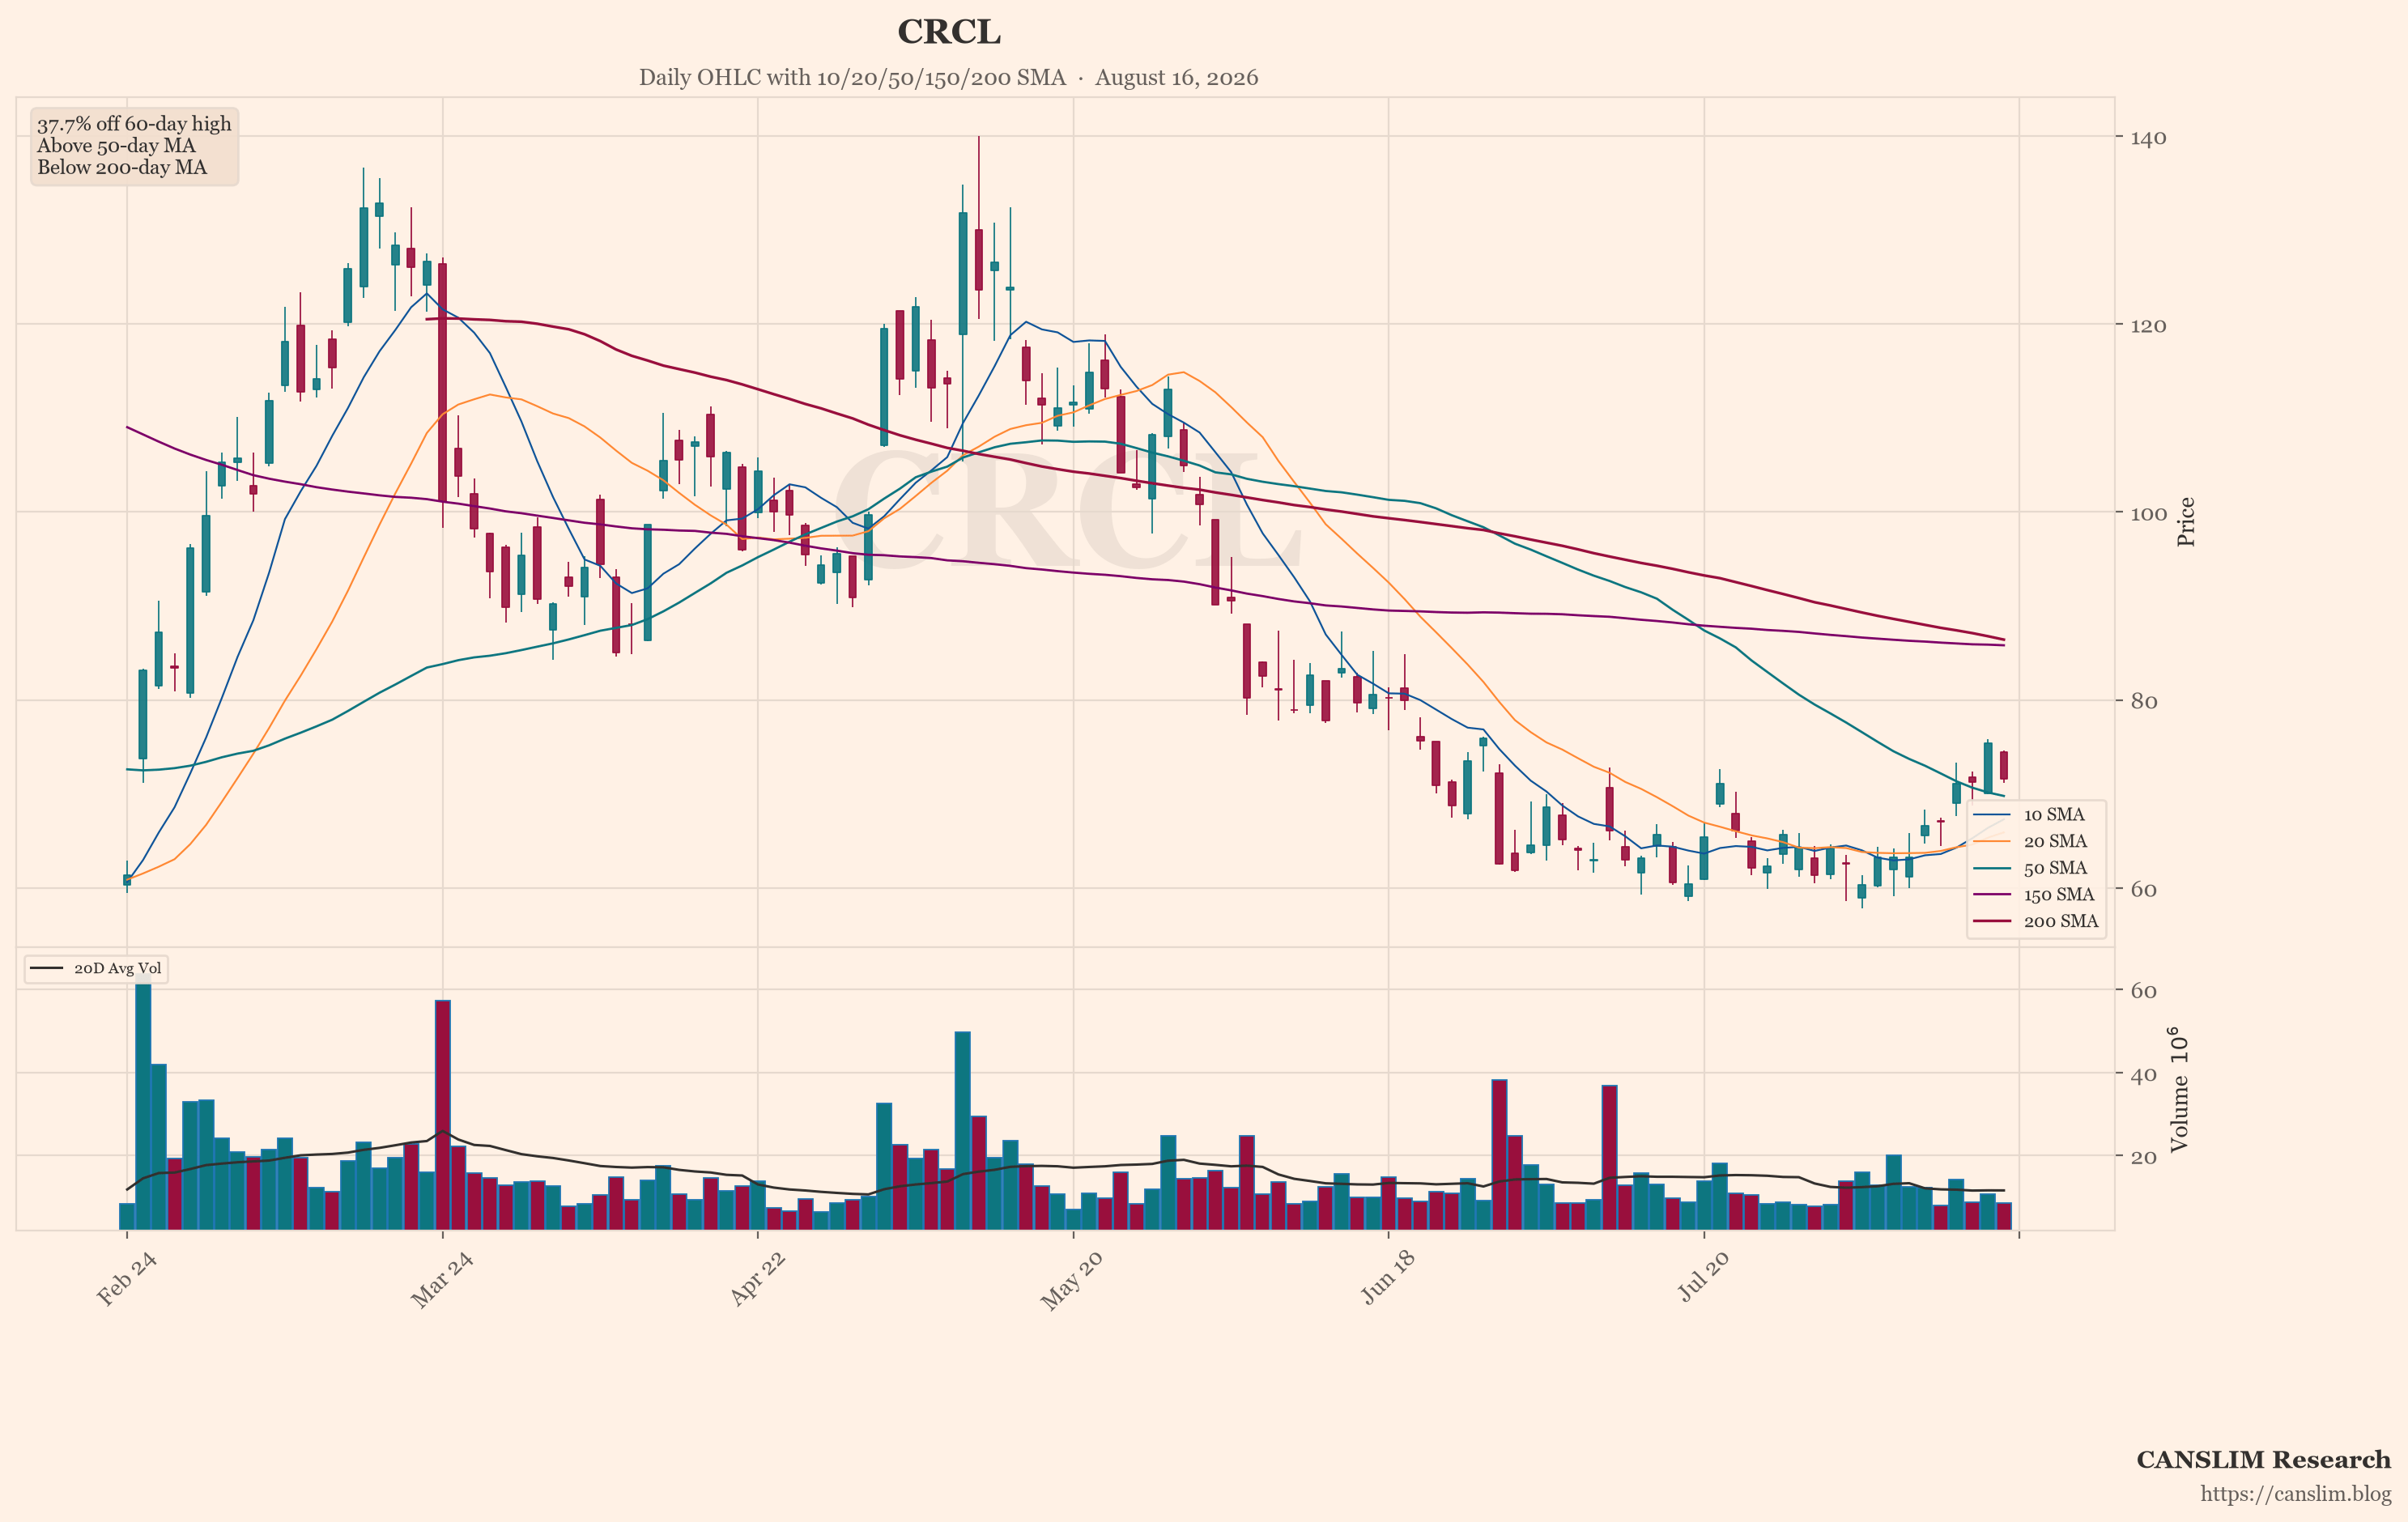
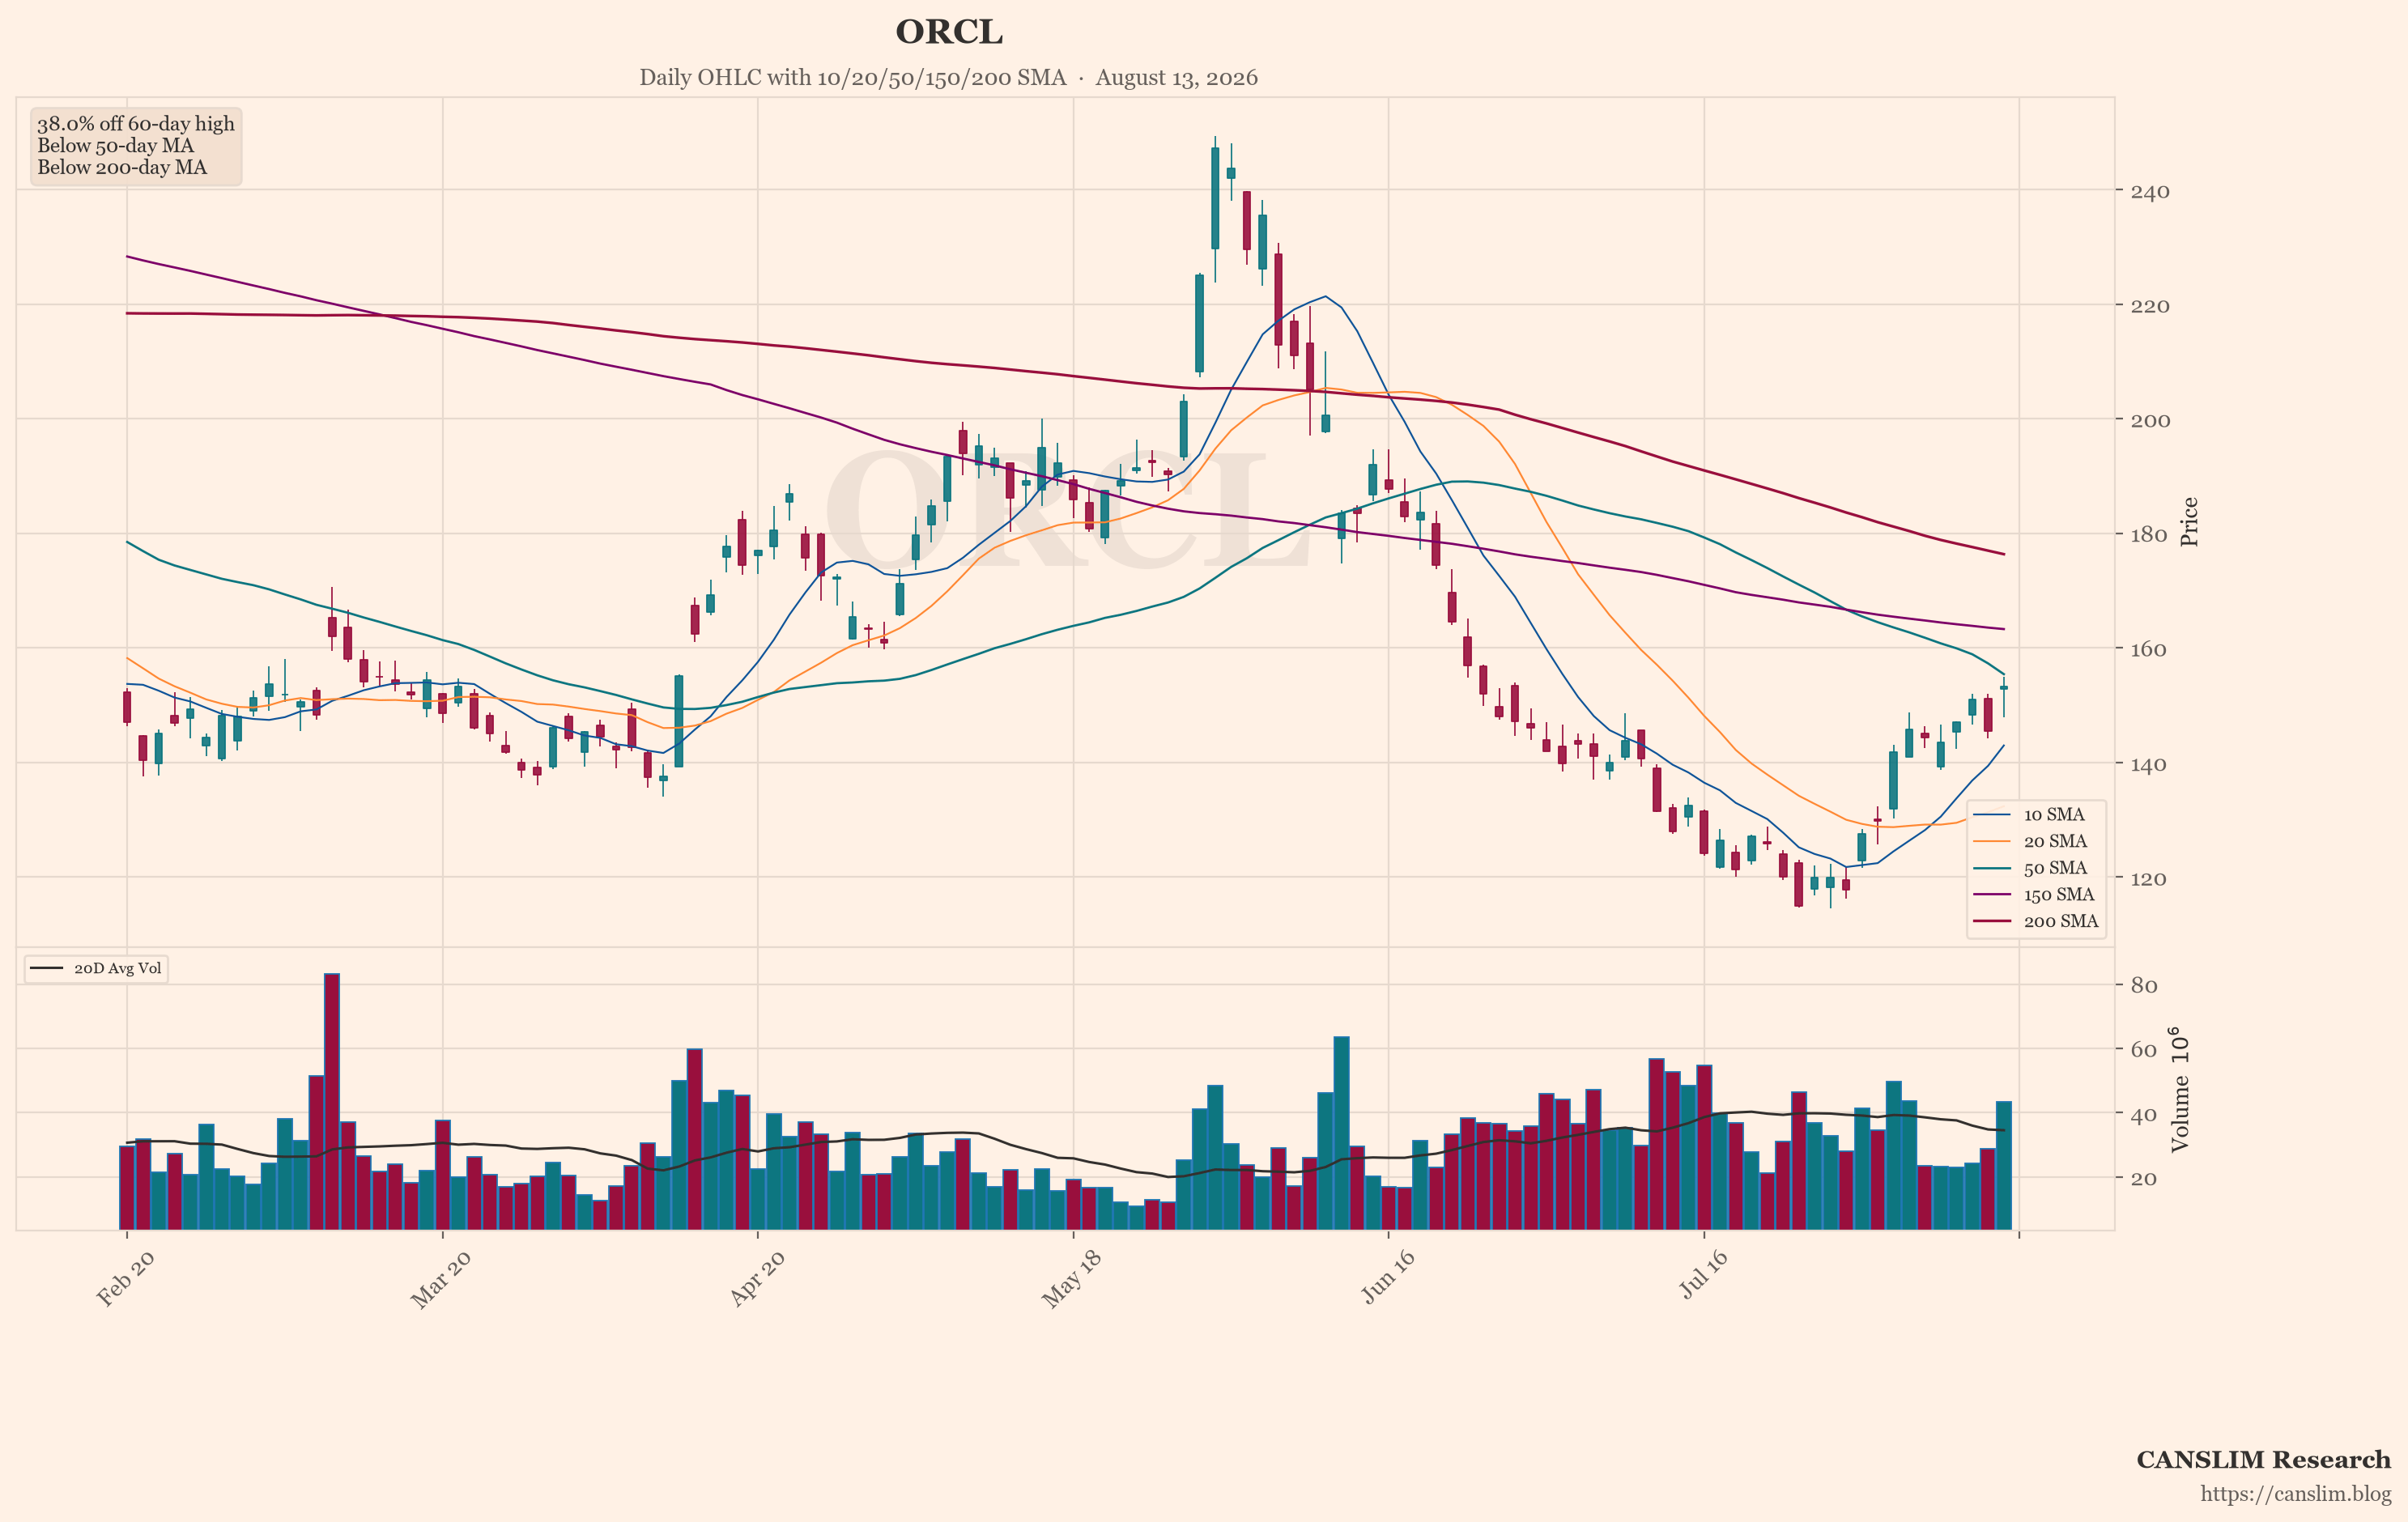
The memory supply chain caught a bid overnight as the KOSPI rallied. MU traded at 921.96, SNDK hit 1366.17, and NVDA rose to 224.38. The online crowd is euphoric, calling for targets like “MU 1200” and “SNDK 1600.” But the featured chart tells a different story. ORCL shows the weakest technical pattern among the leaders. It is failing to participate in the AI hardware surge. While memory names break out, Oracle sits flat, unable to attract buyers. This divergence is a warning. When the laggards stay weak while the leaders run, the rally lacks broad confirmation. The crowd is celebrating the winners, but the smart money is watching the stragglers.
Inverse Burry Trade Becomes Crowded Dogma
The online crowd has turned a famous investor’s short positions into a contrarian playbook. After NBIS delivered explosive earnings, the mood shifted from debate to worship. The stock surged 30% in the regular session, with revenue up 454% year-over-year. The investor added to his shorts on NBIS, MU, and ORCL, but the crowd now treats his every move as a buy signal. One user joked that the “Inverse Burry Fund” is simply NVDA and SPY. A few rational voices warned that his alarm level feels different this time. But those voices were drowned out. The real top signal, one user noted, will be when the famous bear turns bullish. Until then, the trade is crowded and dangerous.
Indexes Stuck in a Range While VIX Sits at Lows
The broader market is dead quiet. SPY has traded between 770 and 776 for four straight days. The S&P closed up 0.3%, the Nasdaq gained 0.5%, and the Dow was flat. July CPI came in exactly as expected, so there was no catalyst to break the range. The VIX closed near 14, its lowest level of the year. That sounds calm, but the crowd is nervous. One user noted that in 19 years when the VIX fell below 14.5 after August, only three times did it later reach 30. The fear and greed index sits at 78, which is greedy. The community jokes that “we’re too bullish, and that’s not a good thing.” The party is in individual stocks, but the index is silent. That split is unsustainable.
Oracle’s Weakness Signals a Fractured Market
The market is defined by a party in momentum names and dead silence in the broader index. ORCL is the clearest example of the fracture. While MU and SNDK soar, Oracle cannot hold its ground. The online crowd is mocking bears after the NBIS squeeze, but the bears have not disappeared. They are hiding in the laggards. Oracle’s weak chart is a contrarian warning. If the AI trade is truly healthy, the leaders should pull the laggards higher. Instead, we see divergence. The crowd is euphoric, but the tape is telling a different story. The next move depends on whether chip earnings and Fed policy hold up. If they do, the laggards may catch up. If they do not, the leaders will fall too.
The Divergence Demands Caution, Not Complacency
The market is at a crossroads. The KOSPI is in a bull market, and memory chips are leading. But ORCL is weak, the VIX is low, and the crowd is too confident. The “Inverse Burry” trade is now dogma, which means it is likely near its end. The index is stuck in a range, and the leaders are running without the laggards. That is not a healthy setup. The smart play is to respect the trend but watch the weak hands. If Oracle breaks down further, it could drag the whole AI trade with it. The crowd is celebrating, but the chart of ORCL is a quiet warning. Stay disciplined, keep your stops tight, and do not chase euphoria.
Sources: market news brief & global social sentiment data. Updated 2026-08-13 14:00 HKT. For educational purposes only — not investment advice.
Discover more from CANSLIM Research
Subscribe to get the latest posts sent to your email.