 Andrew@CANSLIM RESEARCH
Record Highs Mask a Dangerous Divide in Market Leadership
The S&P 500 closed at a record 7757.64 on Friday, up 3.6% for the week. The Nasdaq surged 5.2%. Index bulls are in a frenzy, with online slogans escalating from SPY 800 to SPY 900. Yet beneath this euphoric surface, a violent fracture is forming. The online crowd is celebrating new highs while simultaneously nursing wounds in beaten-down sectors. This split personality defines the current tape. The rally is real, but it is narrow. Meanwhile, the 10-year Treasury yield sits near the top of its four-year range. That keeps a hard ceiling on valuation expansion. The market is balancing weak labor data against sticky inflation risks. This week’s CPI print will likely decide the next major move.
Memory Sector Collapse Tests the Faith of the Online Crowd
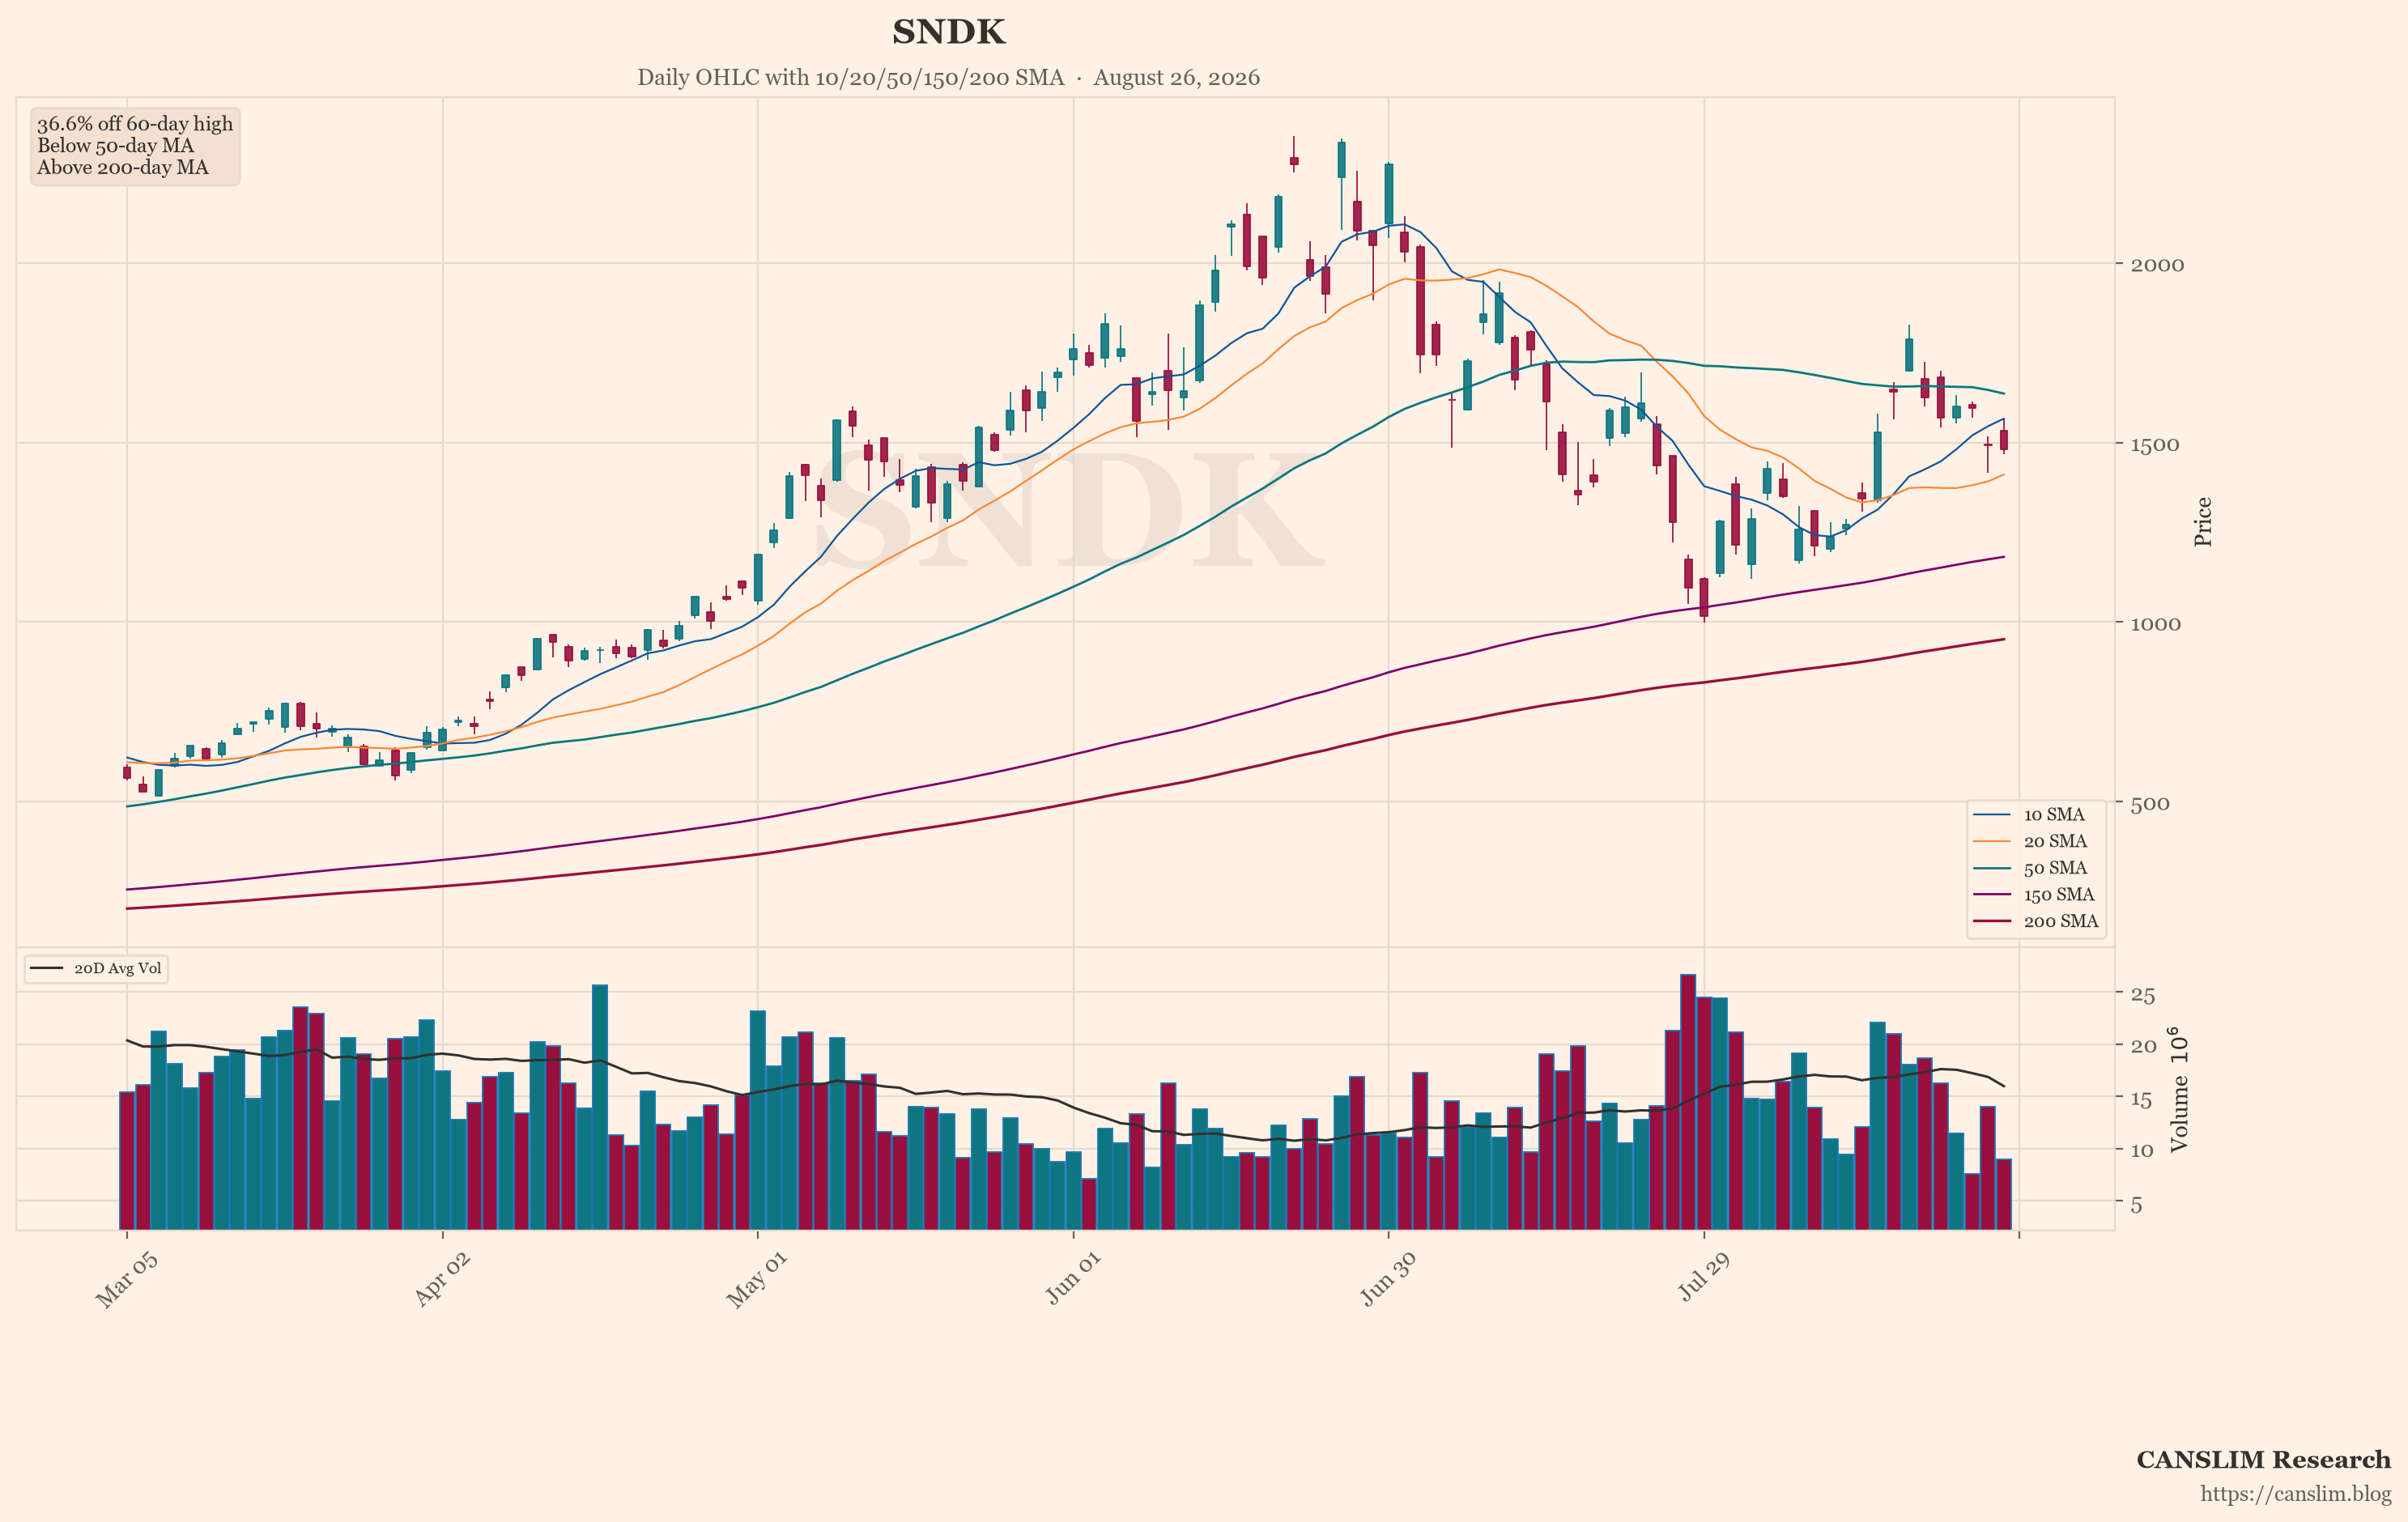
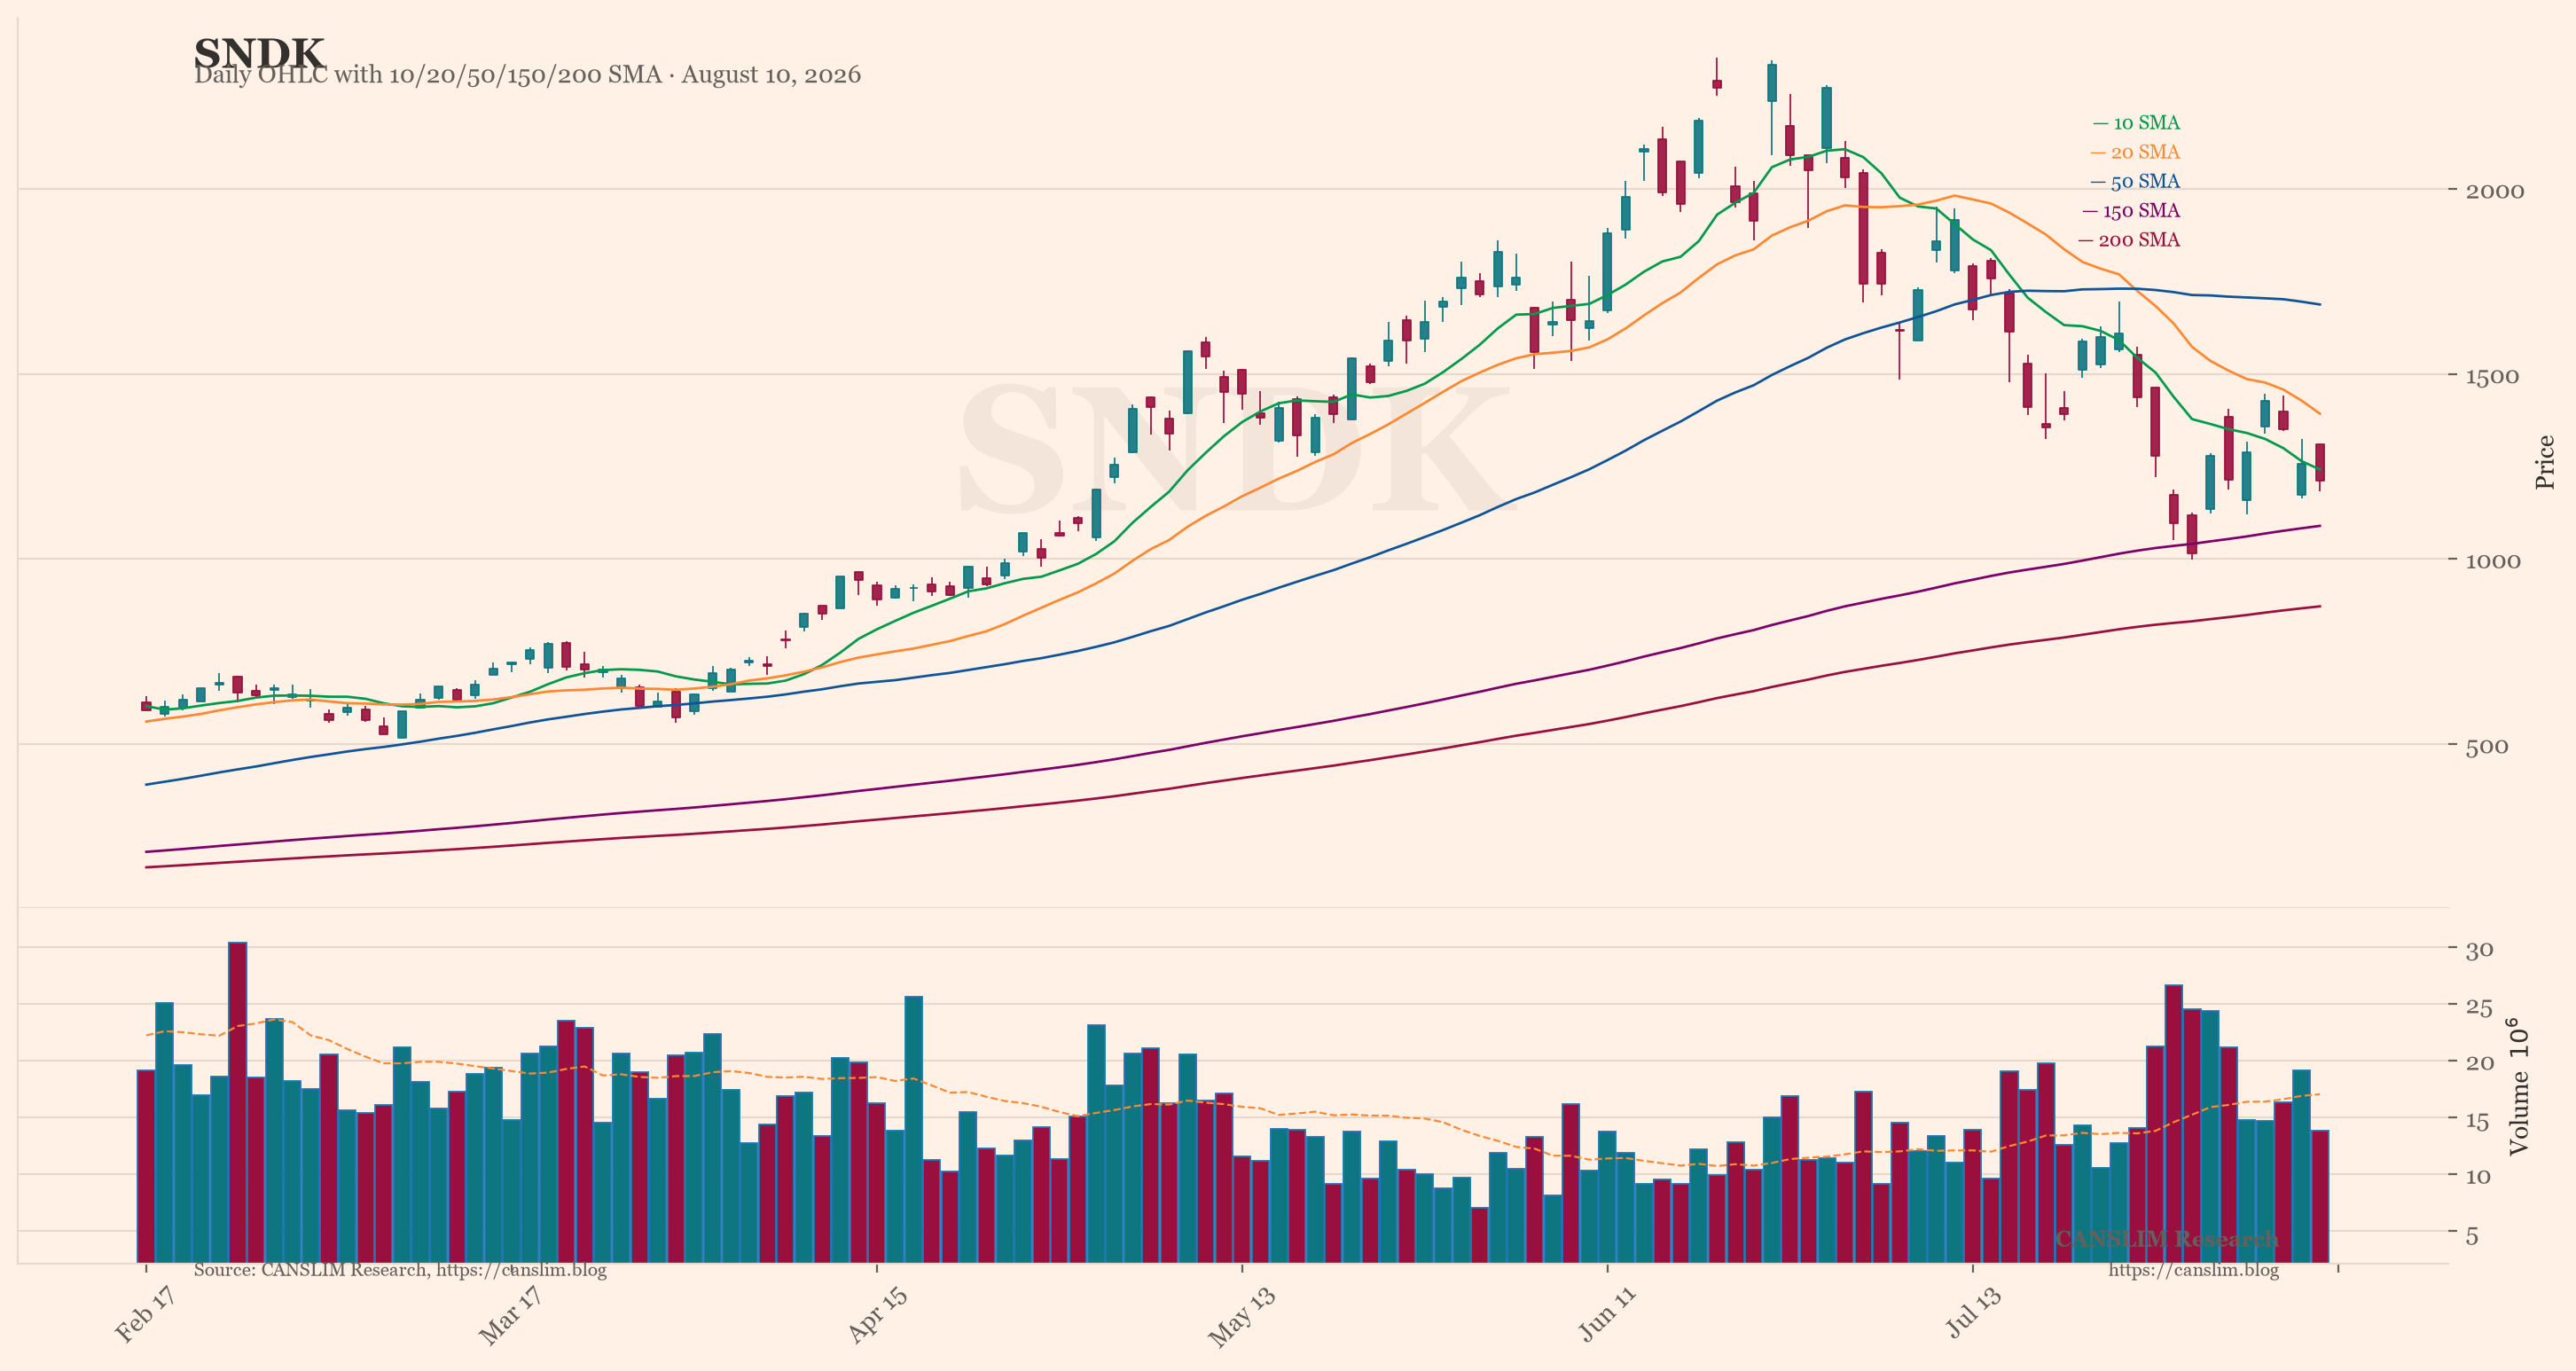
The most striking damage is in the memory complex. SNDK plunged 3.75% to close at 1211.61 on Friday. It fell from 1308 to 1185 intraday. MU dropped 0.58% to 876.35, sliding from a high of 902.77. WDC fell 3.69%. The trigger was SNDK’s weak FY27 Q1 revenue guidance midpoint of $10.3–$10.8 billion, which missed consensus. Competition from CXMT and capital flight from the crowded AI trade added pressure. The online crowd has flipped from "buy the dip" to outright surrender. They now mock each other with phrases like "copium at new highs." This is a stark contrast to sell-side consensus, where 43 of 56 institutions remain Strongly Bullish on Micron. Historically, retail capitulation combined with institutional optimism often signals a relay, not a top. But the featured chart for SNDK shows the weakest technical pattern in the market right now. That is a warning flag for momentum traders.
Earnings Season Brings High-Stakes Gambles in Rocket and Satellite Names
Attention shifts to after-hours earnings for RKLB and ASTS. Market expectations for RKLB revenue sit near $231.6 million, roughly 60% higher year-over-year. The company guided for $225–$240 million. Focus is on Neutron progress and a $397 million Space Force contract. Both stocks ran up hard on Friday. RKLB closed at 83.09, up 9.76%. ASTS closed at 71.91, up 6.71%. This pre-earnings surge creates a classic "sell-the-news" setup. The online crowd is split. Bulls call for RKLB at 150 or even 200. Bears point to the systematic pattern of pumping before the report. The outcome will likely set the tone for speculative growth names this week.
Extreme Moves in Single Stocks Fuel a Speculative Undercurrent
Individual stock action is wild. TTD plummeted roughly 22% to 13.79, hitting a seven-year low after a double miss on revenue and earnings. HTZ rose 14.43% to 2.30, gaining 50% over two days. The stock beat expectations with adjusted EPS of -0.11 versus an expected -0.24. About 74% of its float is shorted. This creates a powerful squeeze dynamic. The online crowd is using these extreme moves to fuel a gambling mentality. Truly directional views are rare. Most are simply betting on immediate reactions to earnings and CPI. This is a sign of stretched sentiment. Good news is being priced against a very high bar.
Oil and Inflation Risks Threaten to Unwind the Rate-Friendly Setup
The macro backdrop is mixed. Weak jobs data has boosted risk appetite. It reduces pressure on the Fed to keep hiking. Treasury yields are easing ahead of inflation data. That is a bullish signal. But oil is firmer. Iran-related shipping risks remain unresolved. This can feed back into inflation just as traders watch Wednesday’s CPI print. The market expects a monthly rate of -0.1% due to energy pullbacks. June’s year-over-year rate was 3.5%. If CPI comes in soft, the rally has room to grind higher. If it is sticky, the recent optimism around Fed cuts could unwind fast. The 10-year yield near the top of its four-year range remains a real constraint.
The Online Crowd’s Target Prices Have Run Ahead of Reality
Community slogans like SPY 800 or 900 are far ahead of the actual price of 773.16. This is a classic case of target price inflation after new highs. Conversely, the crowd’s pessimism toward memory deviates sharply from institutional optimism. This combination of retail capitulation and institutional buying is historically more common in a relay than at a top. However, the crowd no longer views this as a reason to buy. Bears in the comments are being systematically swarmed. That is itself evidence of a crowded trade. The market is in a fractured state of "high-level euphoria plus localized wreckage." Index bulls are in a frenzy. Those trapped in memory, HTZ, and other beaten-down lines are mocking each other. This oppositional tension is the strongest in recent data.
A Hot CPI Print Could Quickly Reverse the Market’s Optimism
The only hard macro event this week is July CPI on Wednesday. A soft print would confirm the market’s lean toward easier Fed policy. It would give the current rally room to extend. But a firm print would hit both bonds and equities quickly. Elevated valuations and stretched sentiment leave little room for error. The market is balancing growth support against inflation and supply shocks. Oil and Hormuz headlines keep energy pressure alive. The path forward depends on inflation data and how Treasury yields react at the long end. The setup is neutral but fragile. The market is trying to build on gains, but the high bar for good news means any disappointment will hurt. The online crowd’s euphoria is running ahead of reality. The memory sector’s technical breakdown is a warning. This is a market that can rally further, but only if the data cooperates.
Sources: market news brief & global social sentiment data. Updated 2026-08-10 17:41 HKT. For educational purposes only — not investment advice.
Discover more from CANSLIM Research
Subscribe to get the latest posts sent to your email.