 Andrew@CANSLIM RESEARCH
President Trump is pursuing a broad policy agenda encompassing agricultural subsidies, military action against Iran, deregulation of environmental protections, and the creation of a permanent fraud enforcement body. Meanwhile, the Federal Reserve has raised interest rates for the first time in three years, signalling a tightening cycle that could weigh on equities. These developments create a complex landscape for investors, with sector-specific opportunities and risks.
In a week marked by significant policy shifts, President Trump has advanced a series of initiatives that could reshape key sectors of the US economy. From optimistic signals on a long-delayed farm bill to escalating tensions with Iran, the administration’s actions are injecting uncertainty into markets already grappling with the Federal Reserve’s first rate hike in three years. As the political and economic landscape evolves, investors must navigate a maze of regulatory changes and geopolitical risks.
Key Theme: The Trump administration’s aggressive policy agenda, spanning agriculture, military action, deregulation, and financial oversight, is colliding with a newly hawkish Federal Reserve, creating a volatile mix for markets.
Trump Optimistic Senate Will Pass Farm Bill
Published: 18 September
President Trump expressed confidence that the Senate will pass a comprehensive farm bill, which includes increased subsidies for farmers and funding for agricultural research. The bill aims to support rural communities and stabilize food prices.
Market Implication: The passage of the farm bill would benefit agricultural companies, particularly those in grain processing and distribution, by providing greater certainty and potential subsidies.
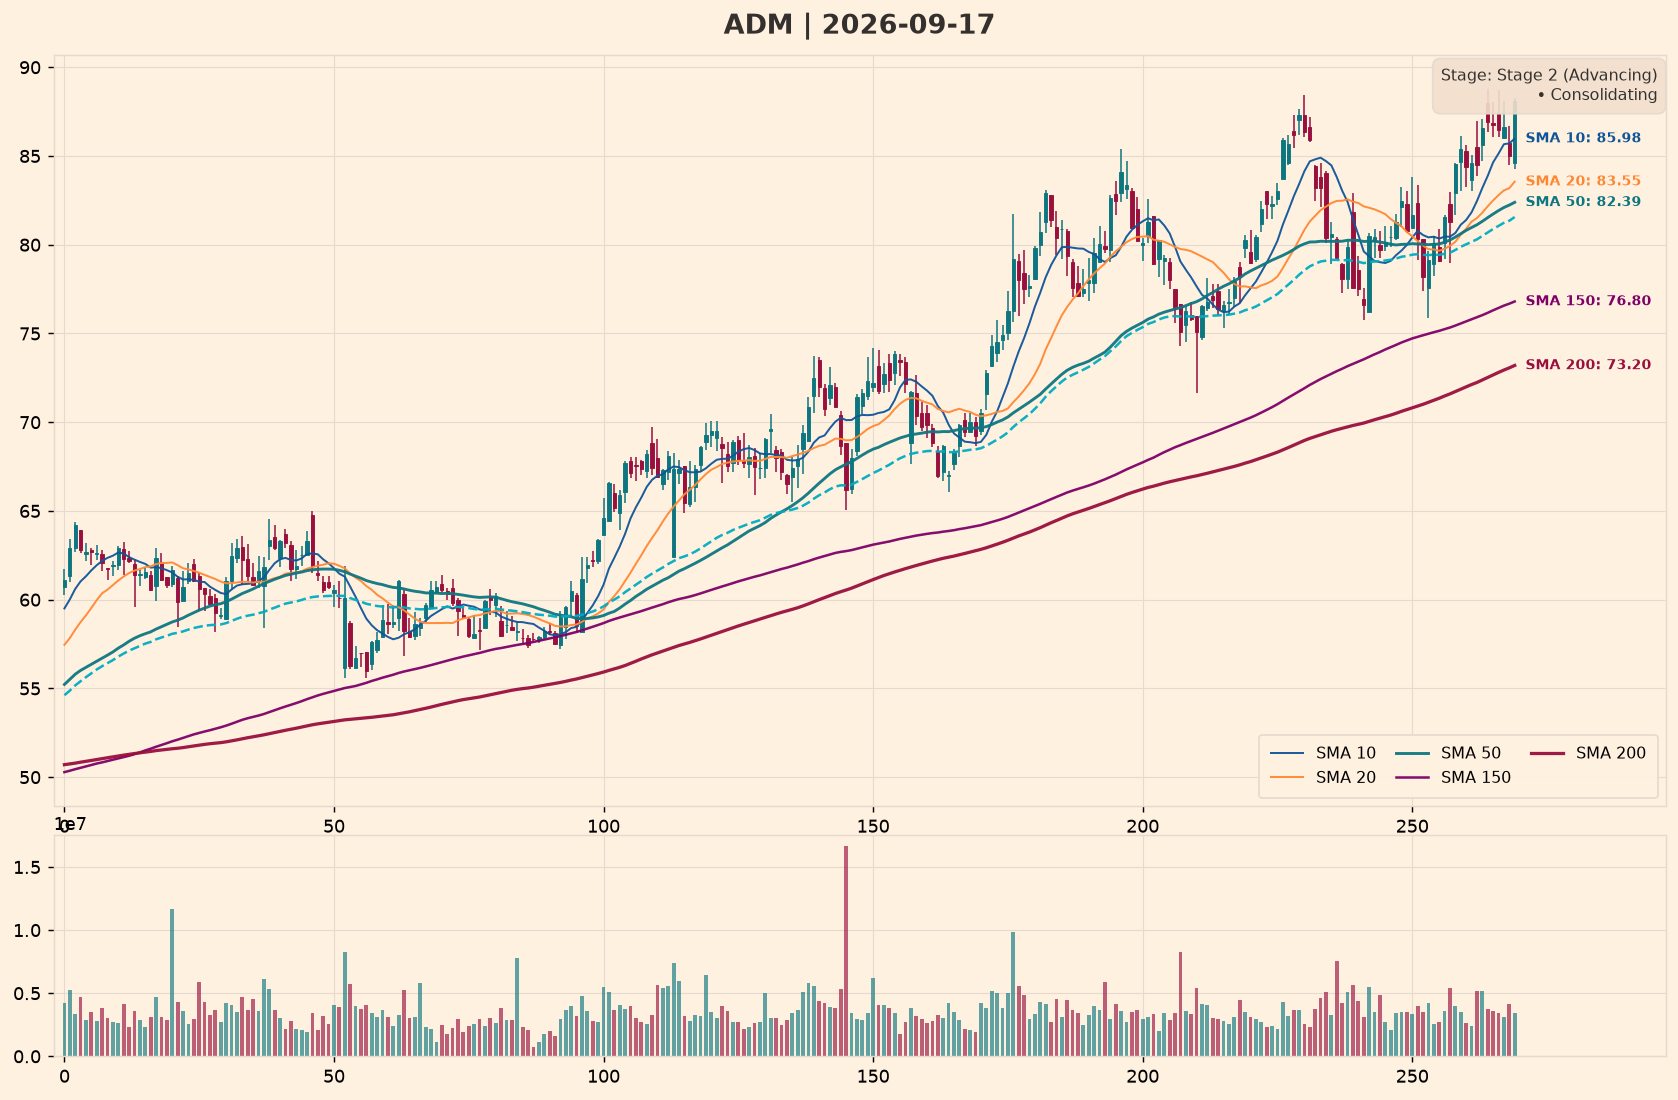
ADM — Archer-Daniels-Midland CompanyBullish
Policy Nexus: As a major agricultural processor, ADM stands to gain from increased farm subsidies and stable crop prices.

Trend Structure: Stage 2 (Advancing)
Trump Faces ‘Big Decision’ on Iran War
Published: 18 September
President Trump is weighing military action against Iran in response to recent provocations. The decision could have far-reaching consequences for Middle East stability and global oil supplies.
Market Implication: Escalation of conflict would likely disrupt oil supplies, driving prices higher and benefiting energy companies, while broader market uncertainty could weigh on equities.
XOM — Exxon Mobil CorporationNeutral
Policy Nexus: While higher oil prices would boost revenues, the uncertainty and potential for broader conflict create offsetting risks.

Trend Structure: Stage 2 (Advancing)
Groups Sue Over Rollback of Power Plant Climate Rules
Published: 18 September
Environmental groups have filed lawsuits challenging the Trump administration’s rollback of Obama-era regulations limiting carbon emissions from power plants. The rollback is part of a broader deregulatory agenda.
Market Implication: Utilities may face legal uncertainty and potential compliance costs if the rollback is overturned, while fossil fuel producers could benefit from reduced regulatory burdens.
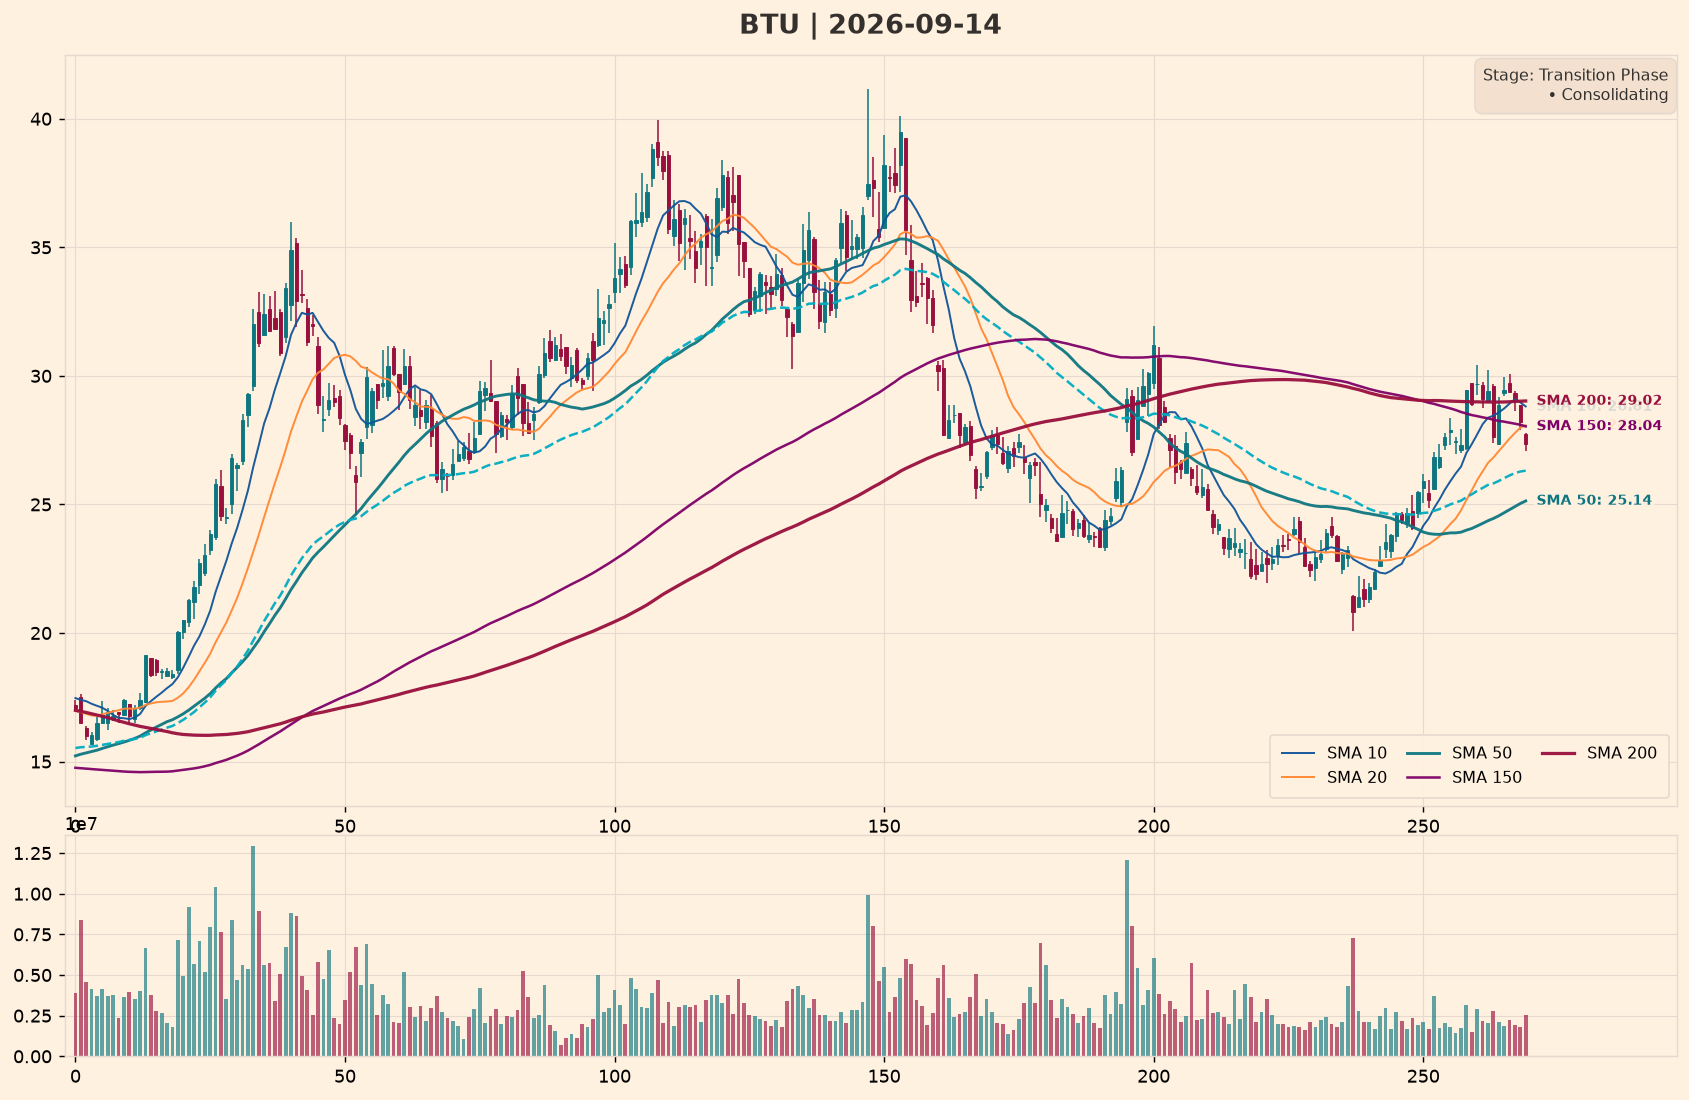
SO — The Southern CompanyBearish
Policy Nexus: As a major utility with coal-fired plants, Southern could face higher costs and legal challenges from the rollback.

Trend Structure: Transition Phase
House Votes to Make Trump’s National Fraud Enforcement Division Permanent
Published: 18 September
The House voted 352-72 to permanently establish the National Fraud Enforcement Division, a body created by Trump to investigate financial crimes. The division has been controversial for its broad mandate.
Market Implication: The permanent division could lead to increased scrutiny of financial institutions, potentially raising compliance costs but also enhancing market integrity.
JPM — JPMorgan Chase & Co.Bullish
Policy Nexus: As a leading bank with robust compliance, JPM may benefit from a cleaner market environment and increased investor confidence.

Trend Structure: Transition Phase
Fed Raises Rates 0.25%, First Hike in Three Years
Published: 18 September
The Federal Reserve raised its benchmark interest rate by 0.25%, the first increase in three years, citing strengthening economic conditions. The move defies pressure from President Trump to keep rates low.
Market Implication: Rising rates typically weigh on equities, especially growth stocks, while benefiting financials through higher net interest margins. The dollar may strengthen.
SPY — SPDR S&P 500 ETF TrustBearish
Policy Nexus: Higher rates increase borrowing costs and pressure valuations, particularly for high-growth sectors.

Trend Structure: Stage 2 (Advancing)
Risk Management & Conclusion
In this environment of heightened policy uncertainty and monetary tightening, investors must adhere to disciplined risk management. The CAN SLIM methodology emphasises buying fundamentally strong stocks breaking out of sound bases, but with the Fed hiking rates, it is crucial to implement strict stop-losses to protect against downside. Keep position sizes moderate and avoid chasing extended stocks, as political and economic crosscurrents could trigger sharp reversals.
Read more market analysis at http://canslim.blog
Disclaimer: For institutional research observation only. Not investment advice. Always apply prudent risk management and strict stop-loss protocols.
Discover more from CANSLIM Research
Subscribe to get the latest posts sent to your email.